$ETHUSDT 1H Trade Setup CRYPTOCAP:ETH – 1H Trade Setup
- Entry: CMP
- SL: $2,410
- Target: $2,506
ETH broke above the falling trendline and retested it. Clean breakout setup, bullish continuation likely above $2,445.
DYRO, NFA
Ethlong

Ethereum is still bullish!#ETH
The price is moving within a descending channel on the 30-minute frame and is expected to break and continue upward.
We have a trend to stabilize above the 100 moving average once again.
We have a downtrend on the RSI indicator that supports the upward move with a breakout.
We have a support area at the lower boundary of the channel at 2450, acting as strong support from which the price can rebound.
We have a major support area in green that pushed the price upward at 2400.
Entry price: 2460.
First target: 2485.
Second target: 2510.
Third target: 2543.
To manage risk, don't forget stop loss and capital management.
When you reach the first target, save some profits and then change your stop order to an entry order.
For inquiries, please comment.
Thank you.

#ETH/USDT#ETH
The price is moving within a descending channel on the 1-hour frame, adhering well to it, and is on its way to breaking it strongly upwards and retesting it.
We are seeing a rebound from the lower boundary of the descending channel, which is support at 2427.
We have a downtrend on the RSI indicator that is about to break and retest, which supports the upward trend.
We are looking for stability above the 100 moving average.
Entry price: 2447
First target: 2476
Second target: 2500
Third target: 2533

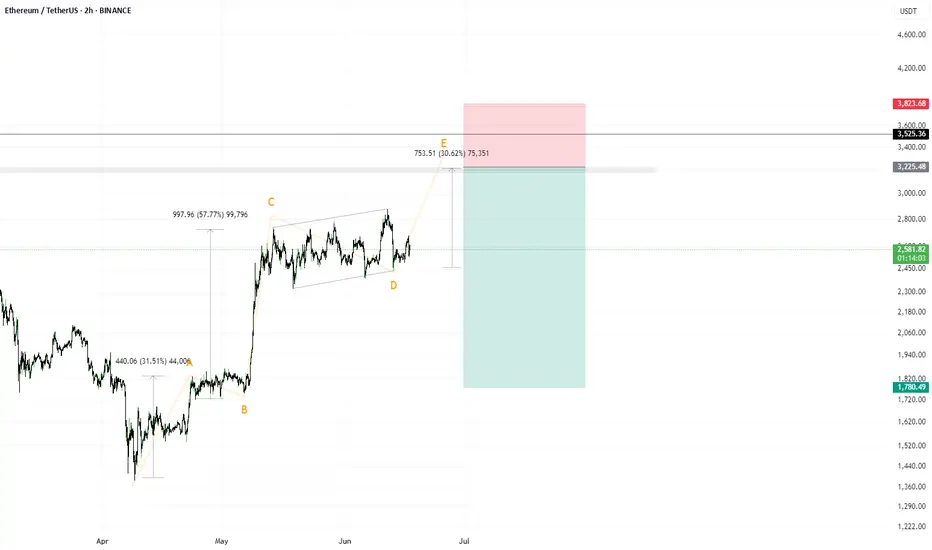
Short idea on $ETHJudging by the structure, if the vector is correctly identified, then on the ETH instrument, a rise to 3400–3600 remains relevant until the first serious correction (this idea would be invalidated in that case).
As for the potential trade — a breakout of the local highs amid global chaos and during the formation of wave 4 of a 5-wave structure. Typically, during the formation of wave 4, there is more media involvement, more noise, and panic.
I’m observing and planning to enter this trade.
Do not follow my vision blindly, as it could be detrimental to you.
Decision Phase in ETHBTCI would like to offer an idea about ETHBTC. Although it showed a nice bottom formation with its last breakout move, I think it is at a very critical point with the horizontal movement and downward break that followed. If you look at the ETH chart ( ) , you can see that it corrected almost 60% of its sharp rise and gave a nice test to the red box and went up. It is currently trying to stay within its old range. ETHBTC, on the other hand, is making a downward move. It would not be wrong to say that it has evolved into an structure as if it made a downward retest, despite having made a similar move.
I have 3 plans for this process:
Plan 1: The price retesting the 0.026 levels after entering the old range and throwing it above this area with a slow and small pullback. I will consider the last downward move as manipulation and take a position accordingly.
Plan 2: Defining its last move as a retest to the range it broke down, continuing its decline and first coming back to the 0.019 levels. Maybe a decline to the green box zone below after the reaction there.
Plan 3: After making the rise in plan 1, testing the 0.021 levels for the last time by pulling back more and starting a rapid rise from there. Frankly, although it is a bit difficult, such a move seems good to me since seeing sharp movements and volume in the bottom formation will increase the opinion that the rate is the bottom.
This is the roadmap I will follow in general. I think these movements can be until the first week of July. I hope that the next 10 days will give a good idea of how we will spend the summer months. It should not move horizontally in these areas anymore and I don't think it will. I don't care about drawing both up and down and then saying "aha" and being right. If my goal is not to make money, being right is useless. If there is a movement that is suitable for one of the movements I draw, I want to take a position and turn it into reality.
Good day everyone.

ETHEREUM ETHUSD H&S ON 4H TIMEFRAMEHello Traders,
as we can see with good chances COINBASE:ETHUSD is doing a head and shoulders pattern on 4 h targeting 2600-2800 zone.
Need to close this 4 H candle first, the support is around 2375.
remember, dips happens!

Ethereum Whale Buys $422M in ETH: Bullish Signal or False Hope?
The cryptocurrency market has always been a playground for big players, often referred to as "whales," whose massive transactions can influence market sentiment and price action. Recently, one such Ethereum whale has made headlines by accumulating a staggering $422 million worth of ETH in less than a month. This aggressive buying spree has sparked curiosity and speculation among investors and analysts alike. Is this whale positioning for a massive rally, or are they simply hedging against market uncertainty? Let’s dive into the details of this significant accumulation and explore its potential implications for Ethereum’s price trajectory.
The Whale’s Buying Spree: A Breakdown
Blockchain analytics platforms like Lookonchain and Whale Alert have been tracking the movements of this Ethereum whale over the past few weeks. According to their data, the whale has been systematically purchasing large quantities of ETH across multiple transactions, totaling over 150,000 ETH at an average price of approximately $2,800 per token. This accumulation, valued at $422 million, represents one of the largest buying sprees by a single entity in recent months.
What’s particularly intriguing is the timing of these purchases. The whale began accumulating during a period of relative market uncertainty, with Ethereum hovering near key support levels after a significant correction from its earlier highs. This suggests that the whale may have viewed these price levels as a buying opportunity, potentially anticipating a rebound or long-term growth in Ethereum’s value.
Why Are Whales Accumulating Now?
There are several reasons why a whale might choose to accumulate such a massive amount of ETH at this juncture. First, Ethereum remains the backbone of decentralized finance (DeFi) and non-fungible tokens (NFTs), two sectors that continue to drive innovation and adoption in the crypto space. Despite short-term price volatility, Ethereum’s fundamentals—such as its developer activity, network usage, and upcoming upgrades—remain strong.
Second, the whale may be betting on the long-term impact of Ethereum’s transition to Proof-of-Stake (PoS) via the Merge and subsequent upgrades like sharding. These upgrades are expected to make Ethereum more scalable, energy-efficient, and cost-effective, potentially driving greater adoption and value over time.
Finally, macroeconomic factors could be at play. With inflation concerns and uncertainty in traditional markets, some institutional investors and high-net-worth individuals are turning to cryptocurrencies like Ethereum as a store of value or hedge against economic instability. This whale’s buying spree could be a signal of growing institutional interest in Ethereum as a long-term investment.
Market Implications of the Whale’s Actions
The actions of whales often have a ripple effect on the broader market. When a single entity accumulates such a large amount of a cryptocurrency, it can create a supply crunch, reducing the amount of ETH available for sale on exchanges. This, in turn, can drive up prices if demand remains constant or increases.
Moreover, whale activity often attracts the attention of retail investors, who may interpret such moves as a bullish signal. Social media platforms like Twitter and Reddit are already buzzing with discussions about this whale’s accumulation, with many speculating that a major price rally could be on the horizon. However, it’s worth noting that whale movements can also be a double-edged sword—while accumulation can signal confidence, sudden sell-offs by the same whale could trigger panic and price crashes.
For now, the Ethereum market appears to be reacting positively to this news. In the days following the whale’s most recent purchases, ETH’s price has shown signs of recovery, bouncing off key support levels. But is this just a temporary blip, or the beginning of a sustained rally? Let’s explore this further in the next section.
________________________________________
Ethereum Bounces Hard After Support Bluff: A False Alarm or Fresh Rally?
Ethereum’s price action in recent weeks has kept traders on edge. After a prolonged period of consolidation and a dip toward critical support levels, ETH staged a powerful bounce, reclaiming key technical levels and reigniting hopes of a broader rally. However, the question remains: is this bounce a genuine signal of bullish momentum, or merely a false alarm before another downturn?
The Support Bluff and Subsequent Bounce
Ethereum had been trading in a tight range for much of the past month, with $2,500 acting as a crucial support level. This level was tested multiple times, and on several occasions, it appeared that bears would succeed in pushing the price lower. However, each time ETH approached this support, buyers stepped in, preventing a breakdown.
This repeated defense of $2,500 created what some analysts call a “support bluff”—a situation where the market tests a key level multiple times, creating uncertainty about whether it will hold. Just when it seemed like the support might finally give way, Ethereum staged a hard bounce, surging over 10% in a matter of days to reclaim the $2,800 level. This move caught many traders off guard, particularly those who had positioned for a breakdown.
Technical indicators also supported the bullish case for this bounce. The Relative Strength Index (RSI) moved out of oversold territory, signaling renewed buying pressure, while the Moving Average Convergence Divergence (MACD) showed a bullish crossover on the daily chart. Additionally, on-chain data revealed a spike in transaction volume and active addresses during the bounce, suggesting that the move was backed by genuine market participation.
False Alarm or Fresh Rally?
While the bounce has undoubtedly injected optimism into the Ethereum market, it’s too early to declare a full-fledged rally. Several factors could determine whether this move has legs or if it’s just a temporary relief rally before further downside.
On the bullish side, the whale accumulation discussed earlier could provide a psychological boost to the market. If other large players follow suit and start buying ETH at these levels, it could create a self-reinforcing cycle of demand. Additionally, Ethereum’s fundamentals remain strong, with ongoing developments like the upcoming Cancun-Deneb (Dencun) upgrade, which aims to reduce Layer 2 transaction costs, potentially driving greater adoption.
However, there are also bearish risks to consider. The broader cryptocurrency market remains correlated with macroeconomic conditions, and any negative developments—such as interest rate hikes or geopolitical tensions—could weigh on risk assets like Ethereum. Moreover, if the whale who accumulated $422 million in ETH decides to take profits at higher levels, it could trigger a sharp sell-off, undermining the current momentum.
For now, traders are closely watching key resistance levels around $3,000 and $3,200. A break above these levels could confirm a fresh rally, potentially targeting Ethereum’s previous highs near $4,000. On the other hand, a failure to sustain the current bounce could see ETH retest the $2,500 support, with a breakdown below this level opening the door to further declines.
________________________________________
Ethereum Developer Proposes 6-Second Block Times to Boost Speed, Slash Fees
Ethereum’s scalability and transaction costs have long been points of contention among users and developers. While the transition to Proof-of-Stake has improved energy efficiency, issues like high gas fees and network congestion persist, particularly during periods of high demand. In a bid to address these challenges, Ethereum developer Barnabé Monnot has proposed a radical change: reducing Ethereum’s slot times (the time between blocks) from 12 seconds to just 6 seconds. This proposal aims to make the network more responsive, improve efficiency for DeFi applications, and significantly lower transaction fees. But what are the implications of this change, and is it feasible?
Understanding Slot Times and Their Impact
In Ethereum’s current Proof-of-Stake consensus mechanism, validators propose and confirm blocks in slots that occur every 12 seconds. This slot time was chosen to balance network security, decentralization, and performance. A shorter slot time means blocks are produced more frequently, which could theoretically increase transaction throughput and reduce latency for users.
Barnabé Monnot’s proposal to halve slot times to 6 seconds is based on the idea that faster block production would make Ethereum more responsive, particularly for time-sensitive applications like decentralized exchanges (DEXs) and other DeFi protocols. Additionally, by processing transactions more quickly, the network could reduce congestion during peak periods, potentially leading to lower gas fees for users.
Potential Benefits of 6-Second Slot Times
If implemented successfully, Monnot’s proposal could have several positive impacts on Ethereum:
1. Improved User Experience: Faster block times would reduce the time users have to wait for transactions to be confirmed, making Ethereum more competitive with centralized payment systems and other blockchains like Solana, which boast sub-second transaction finality.
2. Enhanced DeFi Efficiency: DeFi protocols often rely on rapid transaction processing for arbitrage opportunities, liquidations, and other automated functions. A 6-second slot time could make these processes more efficient, potentially attracting more users and capital to Ethereum’s DeFi ecosystem.
3. Lower Gas Fees: By increasing the frequency of block production, the network could process more transactions per minute, reducing competition for block space during high-demand periods. This could lead to lower gas fees, addressing one of the most persistent criticisms of Ethereum.
4. Competitive Edge: Faster block times could help Ethereum maintain its dominance in the smart contract space, especially as rival blockchains continue to innovate with speed and cost efficiency.
Challenges and Risks
While the proposal sounds promising, it’s not without challenges. Reducing slot times could place additional strain on validators, particularly those with less powerful hardware. This could lead to missed slots or delays in block production, potentially undermining network stability. Additionally, shorter slot times could increase the risk of network forks or reorgs (reorganizations of the blockchain), where competing blocks are proposed simultaneously, creating temporary uncertainty about the canonical chain.
Another concern is the impact on decentralization. If faster block times disproportionately favor validators with high-performance hardware or low-latency connections, it could lead to greater centralization of the network, as smaller validators struggle to keep up. This would go against Ethereum’s core ethos of maintaining a decentralized and accessible infrastructure.
Finally, implementing such a change would require extensive testing and coordination among Ethereum’s developer community. Any misstep could result in bugs or vulnerabilities that compromise the network’s security.
Community Response and Next Steps
Monnot’s proposal has sparked lively debate within the Ethereum community. Some developers and users are enthusiastic about the potential for faster transactions and lower fees, while others caution against the risks of rushing such a significant change. Ethereum co-founder Vitalik Buterin has expressed cautious optimism, noting that shorter slot times could be a viable long-term goal but emphasizing the need for thorough research and simulation to understand the full implications.
For now, the proposal remains in the discussion phase, with no concrete timeline for implementation. If it gains traction, it could be tested on Ethereum testnets before being rolled out to the mainnet as part of a future upgrade. Regardless of the outcome, Monnot’s idea highlights Ethereum’s ongoing commitment to innovation and addressing user pain points.
________________________________________
Is Ethereum Staging a Repeat of 2021? Here’s Why a 200% Surge Could Follow
Ethereum’s price history is full of dramatic rallies and corrections, with 2021 standing out as a particularly bullish year. During that period, ETH surged from around $700 at the start of the year to an all-time high of nearly $4,900 in November—a gain of over 600%. As Ethereum shows signs of recovery in 2023, some analysts are drawing parallels to 2021, suggesting that a 200% surge could be on the horizon. But are these comparisons justified, and what factors could drive such a rally?
Parallels Between 2021 and 2023
Several factors from 2021 appear to be resurfacing in 2023, fueling speculation of a repeat performance:
1. Market Sentiment: In early 2021, the crypto market was riding a wave of optimism driven by institutional adoption, mainstream media coverage, and retail FOMO (fear of missing out). Today, while sentiment isn’t quite at 2021 levels, there are signs of growing interest, with major financial institutions exploring blockchain technology and retail investors returning to the market.
2. Network Upgrades: The lead-up to Ethereum’s London Hard Fork in 2021, which introduced the EIP-1559 fee-burning mechanism, was a major catalyst for price appreciation. In 2023, upcoming upgrades like Dencun and potential improvements to block times (as discussed earlier) could similarly boost confidence in Ethereum’s long-term value.
3. DeFi and NFT Growth: The explosive growth of DeFi and NFTs in 2021 drove massive demand for Ethereum, as most of these projects were built on its blockchain. While the hype around NFTs has cooled, DeFi continues to evolve, and new use cases like decentralized social media and gaming could reignite interest in Ethereum.
4. Macro Conditions: In 2021, loose monetary policies and stimulus packages created a favorable environment for risk assets like cryptocurrencies. While the macro environment in 2023 is more challenging, any shift toward accommodative policies—such as interest rate cuts—could provide a tailwind for Ethereum.
Why a 200% Surge Could Happen
If Ethereum is indeed staging a repeat of 2021, a 200% surge from current levels (around $2,800) would take ETH to approximately $8,400—a new all-time high. Several catalysts could make this possible:
• Institutional Adoption: Increased participation from institutional investors, as evidenced by whale accumulation like the $422 million ETH purchase, could drive sustained demand.
• Bitcoin Halving Effect: The upcoming Bitcoin halving in 2024 historically triggers bull runs across the crypto market, with Ethereum often outperforming BTC during these cycles.
• Technical Breakout: If Ethereum breaks above key resistance levels like $3,200 and $4,000, it could trigger a wave of buying momentum from technical traders and algorithms.
• Network Improvements: Successful implementation of upgrades like Dencun or shorter block times could enhance Ethereum’s utility, attracting more users and capital to the ecosystem.
Risks to the Bullish Thesis
Despite the optimism, there are significant risks that could derail a 200% surge. Regulatory uncertainty remains a major concern, with governments worldwide scrutinizing cryptocurrencies and DeFi. Additionally, competition from other Layer 1 blockchains like Solana, Avalanche, and Polkadot could divert developer and user attention away from Ethereum if it fails to address scalability and cost issues.
Moreover, the macro environment remains unpredictable. Persistent inflation, geopolitical tensions, or a prolonged recession could dampen risk appetite, weighing on Ethereum’s price regardless of its fundamentals.
Conclusion
Ethereum is at a fascinating crossroads. The massive $422 million accumulation by a whale signals strong confidence from big players, while the recent price bounce suggests that bullish momentum may be building. At the same time, innovative proposals like Barnabé Monnot’s 6-second block times highlight Ethereum’s commitment to addressing long-standing issues like fees and speed. Whether these factors coalesce into a 2021-style rally remains to be seen, but the potential for a 200% surge is not out of the question if key catalysts align. For now, investors and traders should remain vigilant, keeping an eye on technical levels, on-chain activity, and broader market trends to navigate the exciting but volatile world of Ethereum.

ETH/USDTI think it's time for Ethereum to grow and we should wait for higher targets from Ethereum. Tell me what you think.

Ethereum Price Reversal ? $2100 Support & Altcoin Season OutlookAfter an extended period of consolidation, Ethereum (ETH) has finally retested the critical support level of $2,100, which aligns closely with the 0.5 Fibonacci retracement level of the bullish trend that began in April. This confluence of technical factors strengthens the validity of this level as a strong demand zone.
The price action suggests that ETH may be gearing up for a bullish reversal, as it respects both horizontal support and key Fibonacci structure. Historically, the 0.5–0.618 retracement zone acts as a high-probability reversal area in trending markets, particularly when accompanied by volume stabilization and long-tailed candles on the daily chart.
Trade Plan: Spot and Futures Positions
Given the current structure, this presents a favorable opportunity to accumulate ETH on spot for the anticipated altcoin season. In addition, leveraged long positions in futures can be considered with clearly defined risk parameters.
Entry Zone: Around \$2,100
Stop Loss: \$2,000 (below key support)
Target Levels:
Primary Target: $2,500 (previous resistance / psychological level)
Secondary Target: $2,600 (major structure high)
The risk-to-reward ratio remains attractive, particularly if the broader crypto market continues its uptrend and Bitcoin maintains stability.
Market Context
Broader macro sentiment and the dominance cycle suggest capital rotation into altcoins could be near. With Ethereum leading major Layer 1s, a recovery from this level could catalyze a wider altcoin rally**, making this an important zone to watch for both intraday traders and swing investors.
⚠️ Note: Due to ongoing geopolitical tensions between Israel, Iran, and the United States, global financial markets—including crypto—may experience heightened volatility. Traders are advised to manage risk carefully and avoid overleveraging during uncertain macro conditions.

ETH / USDC Pool StakeSharp sell-off following the U.S. strike on Iran—ETH whale has entered. Set your liquidity pool range wide to capture a potential rebound. If the price continues to drop, no problem—full ETH position is anchored at the bottom of the range. Avoid swapping ETH to realize losses. Hold your original ETH and continue adjusting the range downward if needed. Your only real costs are minting and gas fees, so operate on a low-cost network like Arbitrum or Base to keep expenses minimal.

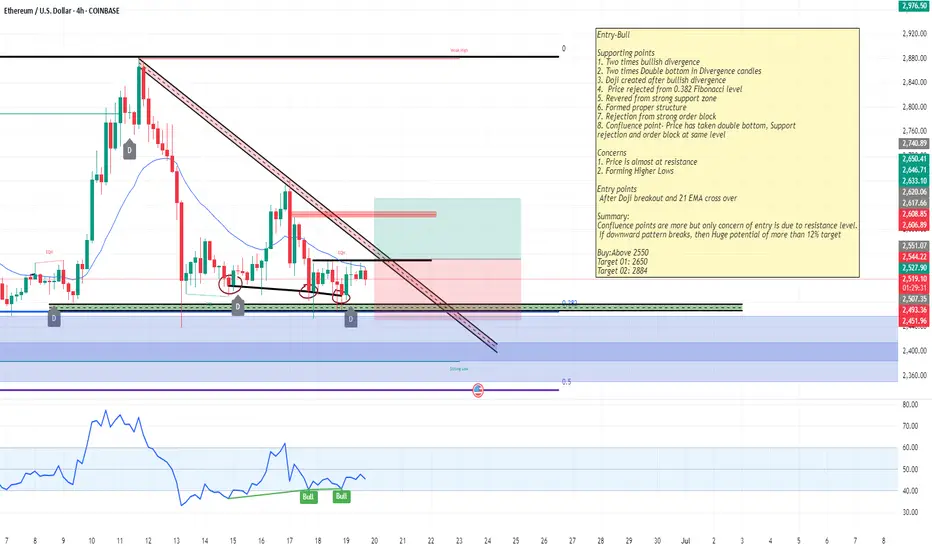
ETHUSD-Swing Trade Bull
Entry-Bull
Supporting points
1. Two times bullish divergence
2. Two times Double bottom in Divergence candles
3. Doji created after bullish divergence
4. Price rejected from 0.382 Fibonacci level
5. Revered from strong support zone
6. Formed proper structure
7. Rejection from strong order block
8. Confluence point- Price has taken double bottom, Support
rejection and order block at same level
Concerns
1. Price is almost at resistance
2. Forming Higher Lows
Entry points
After Doji breakout and 21 EMA cross over
Summary:
Confluence points are more but only concern of entry is due to resistance level.
If downward pattern breaks, then Huge potential of more than 12% target
Buy:Above 2550
Target 01: 2650
Target 02: 2884
Ethereum’s Last Chance: Let Jesus Take The WheelEthereum’s price action over the course of this crypto bull run, and especially since the beginning of this year, 2025, has been nothing short of horrendous. It’s failed to hold almost every single important level that it needed to, to be able to keep pushing higher. This has caused almost all crypto investors and altcoin traders to pull their investments out, and drive the price even lower. At its current point, altcoin traders have lost all but 100% of the confidence they once had in it, and to retail investors, this is basically toxic waste once they see the losses that have been taken, it’s driving them away en masse.
With that being said, this is ETH’s final stand, it’s time to either show out, or go home with nothing to show for itself. It’s at a very critical support level right now, and if it breaks down below this, the trade will be cancelled. It’s just finished completing the ‘Jesus Take The Wheel’ pattern on the weekly & MONTHLY. This is an extremely high probability pattern, and could cause a blow-off top for Ethereum.
We also see that we got a Wykoff Pattern here, with the last one that we got around the $2k level being a fake out. The only other times it has printed aside from the last fake out, it has been the start of a bull run. ETH now has 6 weeks in total, or about 4 more weeks from now to start recovering old levels, and taking off to the moon.
I drew a bar pattern on the chart that I took from its original bullish pattern from the start of the 2013 bull run. I believe we’ll have a shortened cycle, and due to not having much time left to complete the bull run during this 4-year cycle, that’s all we will get. Thankfully, the price has been beaten down so much, that getting in now, will offer 1000% gains, in just about 6 months. This will be one of the most incredible feats in all of crypto.
Fear is at an all time high, and ETH has been teasing everyone with a bull run for months and even years now. We haven’t seen an all time high since 2021. Most investors will suffer from boredom exhaustion as well, and with the stock market also sinking, we could see a huge push once we recover some levels, for the masses to finally come into the market via Ethereum ETF’s, so they don’t have to actually risk any money moving crypto around. The boomers and traditional investors with stock accounts will be free to throw cash at these ETF’s and that’s what will give us our final pumps past all time highs, once the crypto traders all get back into the market, and get us to new ATH’s in the first place, and help us recover key levels.
One thing is clear: ETH needs to stop trying so hard to control its environment, it’s time to just let Jesus Take The Wheel 🚀

ETH Gears Up for 8% Rally After Holding Key Support at $2,484Ethereum (ETH) is currently positioning itself for a potential bullish breakout on the 4-hour chart. After facing a period of mid-June consolidation and volatility, ETH has stabilized above the key support zone at $2,484–$2,551, which previously served as a strong reaction level. This range has now been retested successfully, and price action suggests growing bullish pressure.
At present, ETH is trading around $2,552, holding just above the defined support, which has acted as both a psychological and technical base. The past few candles show reduced selling momentum and a pattern of accumulation that often precedes a breakout. Buyers are stepping in at higher lows, and this shift in structure could signal the beginning of a new leg upward.
The overall setup suggests that Ethereum is now in a classic breakout-retest formation. Volume, while still moderate, has started to pick up slightly, which strengthens the case for a continuation toward the upper resistance zones. The resistance lines at $2,666 and $2,761 represent short- and mid-term upside targets, both previously tested levels where price struggled to close above. If ETH manages to break past $2,666 cleanly, a move to $2,761 becomes increasingly likely.
🔹 Trade Idea (Buy Setup)
• Entry Point: Around $2,552
• Stop Loss: $2,484 (placed just below the major support zone and recent reaction low)
• Target 1 (TP1): $2,666
• Target 2 (TP2): $2,761
• Risk-to-Reward Ratio: ~1:3.16
• Upside Potential: 8.26%
• Downside Risk: 2.62%
This trade setup provides a high-probability long opportunity, with a clearly defined support zone backing the entry. The stop loss at $2,484 gives the trade sufficient breathing room while minimizing downside risk in case of short-term volatility.
There is also a second entry opportunity defined at $2,416, should the market dip unexpectedly before continuing upward. However, this entry is more aggressive and should be approached with flexible risk management — the stop loss for this reentry point is not fixed and should be adjusted as per the trader’s individual risk appetite.
What further strengthens the bullish case is that this reentry zone aligns closely with a historical swing low that previously triggered a strong bullish reversal. If price tests this level again, it may offer a last-chance opportunity for buyers before a larger move unfolds.
The double target strategy — TP1 at $2,666 and TP2 at $2,761 — reflects realistic profit zones based on past price structure and market behavior. Both targets lie within resistance levels that saw significant reaction in recent trading sessions, making them ideal zones for partial or full profit-taking depending on price momentum.
In the broader context, despite ETH’s recent 10% drop, the asset’s ability to hold above the $2,480–$2,500 region demonstrates resilience. This range now acts as a solid foundation from which bulls could initiate a breakout, especially if macro conditions (like BTC strength or positive ETH-related news) align in coming days.
In summary, Ethereum presents a clean long setup from $2,552 with targets up to $2,761, backed by technical support, improving volume, and a bullish price structure. A secondary entry is available at $2,416 for those with higher risk tolerance. If momentum builds above $2,600, ETH could rapidly revisit prior swing highs — and this chart structure makes a compelling case for being prepared ahead of that move.

ETH-----Buy around 2530, target 2580 areaTechnical analysis of ETH contract on June 19:
Today, the large-cycle daily level closed with a small positive line yesterday, the K-line pattern was a single positive line with continuous negatives, the price was below the moving average, and the attached indicator was dead cross. The big trend of decline is still very obvious, but for now, the continuation and strength are relatively poor, which is also the reason why the price is simple and easy to wash; the short-cycle hourly chart yesterday's European market price fell and did not break down, the US market price supported the rebound, the current K-line pattern is continuous positive, and the attached indicator is golden cross, so there is a high probability that it will rise and break the high during the day.
Today's ETH short-term contract trading strategy:
Buy at the current price of 2530 area, stop loss at 2495 area, and target 2580 area;

$ETH / USDT – 4H Time Frame Analysis 3,000 INCOMING?? CRYPTOCAP:ETH / USDT – 4H Time Frame Analysis
Structure: Bullish Flag | Outlook: Neutral-Bullish | Target: $3000?
🔹 Chart Overview
-Pattern: Bullish Flag (continuation structure)
Current Range:
- Supply Zone: $2,680.00 – $2,786.21
- Demand Zone: $2,319.79 – $2,417.61
Price Action:
- Tight consolidation between higher lows and lower highs, forming a symmetrical triangle within a flag structure.
Trend:
- Consolidation, but within a macro uptrend (prior strong rally).
Volume Profile:
- Anchored Volume shows high participation around $2,540–$2,600.
OBV:
- Flattening, signaling indecision and potential energy buildup.
Key Psychological Levels:
$2,860: Minor resistance from past S/R flips.
$3,000: Major round-number psychological resistance.
📐 Technical Confluences
Fibonacci Retracement:
- The 0.618 golden pocket aligns with the support trendline, reinforcing this as a critical zone.
Fair Value Gaps (FVG):
- Above Price: Acts as a magnet in bullish continuation.
- Below Price: Risk zone if price drops; aligns with liquidity and trendline support.
- Liquidity Zone: Aligned with 0.5–0.618 retracement; strong reaction expected.
📈 Bullish Scenari o
Breakout of Pennant Resistance:
- A clean break above $2,786 (supply zone & swing high) with volume.
Close above Upper FVG and Liquidity Zone:
- Confirms bullish intent. Targets psychological level at $2,860, then $3,000.
Volume Confirmation:
- OBV uptick and high breakout volume would validate the move.
Bullish Target Zones:
TP1: $2,860 (psych level + previous resistance)
TP2: $3,000 (major psychological level)
TP3: $3,120–$3,180 (1.618 Fib extension)
📉 Bearish Scenario
Rejection from Current Supply or Liquidity Zone:
- Fails to break above supply; rolls over from the upper pennant line.
Break Below Support Trendline:
- Break below golden pocket and $2,417.61 demand zone.
Invalidation of Bullish Flag:
- A breakdown below $2,319.79 (swing low) invalidates the bullish flag and may signal a trend reversal.
Bearish Target Zones:
TP1: $2,200 (local volume gap + structure support)
TP2: $2,060–$2,120 (previous accumulation zone)
TP3: $1,950 (macro support & last strong demand)
✅ Summary
Structure:
- Price is compressing within a bullish continuation pattern, awaiting breakout confirmation.
Bias: Slightly bullish unless the swing low at $2,319 is broken.
Confirmation Needed:
- Break above or below pennant boundaries with volume.

ETH | BULLISH Pattern | $3K NEXT ??Ethereum has established a clear bullish pattern in the daily as we're seeing an inverse H&S:
The war issues across the globe must also be considered. So far, it's been bullish for crypto but this can also change overnight since it's a very volatile situation - and crypto being a very volatile asset.
For the near term, I believe ETH is due for another increase - at least beyond the current shoulder. This is IF we hold the current support zone:
It seems to be a bit of a slow burn with ETH for this season's ATH. In the ideal world, we'd either:
📢 consolidate under resistance (bullish)
📢make a flag (bullish)
📢OR smash right through the resistance.
But there's likely going to be heavy selling pressure around that zone.
__________________________
BINANCE:ETHUSDT

#ETH/USDT#ETH
The price is moving within a descending channel on the 1-hour frame, adhering well to it, and is heading toward a strong breakout and retest.
We are experiencing a rebound from the lower boundary of the descending channel, which is support at 2460.
We are experiencing a downtrend on the RSI indicator, which is about to break and retest, supporting the upward trend.
We are heading toward stability above the 100 moving average.
Entry price: 2540
First target: 2582
Second target: 2646
Third target: 2717

$CYBERUSDT 6H chart Setup$CYBER/USDT Trade Setup
Breakout Retest on 6H chart
Entry: $1.362–$1.384
SL: $1.275
TP 1:- $1.753
TP 2:- $1.995
Hold above $1.362 for bullish continuation.
Watch for confirmation before entry.
DYRO, NFA

Ethereum’s 19-Day ETF Inflow Streak: What Really HappenedEthereum’s 19-Day ETF Inflow Streak: What Really Happened to Price, Structure, and Sentiment
Table of Contents
1. Executive Summary
2. ETF Backdrop: How the 19-Day Inflow Wave Took Shape
3. Chronology of Price: Day-by-Day Performance
4. Weekly Chart Anatomy: The “Pre-Tower Top” Signal Explained
5. Intraday Technicals: From $2,450 Low to the $2,620 Hurdle
6. On-Chain & Derivatives Lens: Funding, OI, CEX Balances
7. Fundamental Undercurrents: Dencun Afterglow, L2 Fees, Staking Yields
8. Risks & Catalysts: ETH vs. Macro, vs. BTC Dominance, vs. SEC Noise
9. Playbooks for Traders and Long-Term Allocators
10. Conclusion: A Pause, Not a Peak—If Key Levels Hold
________________________________________
1. Executive Summary
• Ethereum received 19 consecutive days of net inflows into spot-linked exchange-traded products (ETPs) totaling $1.37 billion, the longest positive streak since the 2021 bull-run.
• Over the same period ETH/USD rose 18.4 %, printing a local high at $2,750, but has since pulled back to $2,575 amid broad crypto risk-off and Middle-East tensions.
• The latest weekly candle morphs into a “pre-tower top” pattern—two tall green candles followed by a small-bodied doji—often a harbinger of heavy distribution if confirmed by another red week.
• Short-term structure improved Monday: price pierced a contracting-triangle ceiling at $2,550, reclaimed the 100-hour SMA, and now eyes $2,620 as the gatekeeper to renewed upside.
• Funding rates flipped neutral, exchange reserves hit a 7-year low, and staking deposits outpace withdrawals 1.7 : 1—on-chain signs that the sell-off is more leverage shakeout than top formation.
________________________________________
2. ETF Backdrop: How the 19-Day Inflow Wave Took Shape
2.1. The Players
Unlike Bitcoin’s mammoth U.S. spot ETFs, Ethereum’s inflow streak drew from Europe and Canada, where physically backed ETPs have traded since 2021. The three biggest contributors:
Product Country 19-Day Net Flow AUM Growth
21Shares Ethereum ETP (AETH) Switzerland +$502 m +38 %
CI Galaxy Ethereum ETF (ETHX) Canada +$458 m +29 %
WisdomTree Physical Ethereum EU +$227 m +24 %
Rumors of an SEC approval window “after the U.S. election” sparked pre-positioning; asset managers figured it was cheaper to accumulate now than chase later once liquidity explodes on Wall Street.
2.2. Flow Mechanics
When an ETP issues new shares, it must buy spot ETH or tap an AP that can supply coins—direct demand unmatched by equivalent selling pressure. Over the 19-day window, the net 396 k ETH of creation equaled 57 % of all new issuance from block rewards post-Dencun, creating a measurable supply squeeze.
2.3. Historical Context
The only longer stretch was January–February 2021 (27 days), which culminated in ETH exploding from $1,400 to $2,000. The key difference today: market cap is six times larger, so identical inflows exert a milder percentage impact, explaining why price “only” added ~18 %.
________________________________________
3. Chronology of Price: Day-by-Day Performance
Day Date ETF Net Flow Price Close % Δ vs. Prior Day
1 Mar 18 +$58 m $2,110 —
5 Mar 22 +$73 m $2,265 +7.3 %
10 Mar 27 +$94 m $2,430 +2.4 %
15 Apr 1 +$125 m $2,690 +3.8 %
19 Apr 5 +$81 m $2,750 +0.9 %
Across the stretch, realized volatility rose from 32 % to 46 %, but skew stayed positive, showing call demand outpaced puts until the very end, when geopolitical headlines flipped sentiment.
________________________________________
4. Weekly Chart Anatomy: The “Pre-Tower Top” Signal Explained
4.1. What Is a Tower Top?
In candlestick lore, a tower top comprises:
1. A tall green candle (strong breakout)
2. Another tall green candle (exhaustion)
3. A narrow doji or spinning top (equilibrium)
4. A large red candle (breakdown confirmation)
We currently have the first three pieces: the last two weeks of March delivered back-to-back 10 % advances; the first week of April closed as a +0.6 % doji. The pattern is not confirmed until a decisive red week engulfs the doji body (< $2,540).
4.2. Indicators
• RSI (weekly): 59 → ticking down from 68 high; still shy of overbought.
• MACD histogram: Positive but flattening.
• Bollinger bands: Price mid-point of upper band, room for one more expansion.
Conclusion: the candle warns of fatigue, but momentum hasn’t rolled over—yet.
________________________________________
5. Intraday Technicals: From $2,450 Low to the $2,620 Hurdle
5.1. Hourly Chart (Kraken Feed)
• Triangle Breakout: Price sliced through descending trend-line at $2,550, tagging $2,590.
• Moving Averages: ETH trades marginally above the 100-hour SMA ($2,575) but below the 200-hour ($2,610).
• Fibonacci Zones: $2,620 aligns with 0.5 retrace of the $2,750→$2,450 fall—classic reversal pivot.
A clean hourly close >$2,620 opens the door to $2,680 (0.618 Fib) and psychological $2,700. Failure rejects to $2,520 support cluster.
5.2. Order-Book Heat Map
Coinbase Pro data shows 1,300 ETH ask wall at $2,620 and a thinner 890 ETH bid at $2,520. Liquidity skew favors dip-buying, but bulls need market orders >1 k ETH to smash the ask block.
________________________________________
6. On-Chain & Derivatives Lens
6.1. Exchange Reserves
Centralized exchanges now hold 12.9 million ETH, lowest since July 2017. The 19-day ETF harvest accelerated an already extant down-trend of roughly 60 k ETH/week outflows, mostly into staking contracts and L2 bridges.
6.2. Staking Flows
• Beacon deposit contract: +188 k in April’s first week.
• Withdrawal queue: 11 k ETH—tiny relative to deposits.
• Effective deposit APR after Dencun: 3.2 %, still beating U.S. 2-year T-notes post-tax for many investors.
6.3. Perpetual Funding & OI
• Funding normalized to 0.007 %/8 h (≈ 3.2 % APR), down from 9 % at March highs—spec longs flushed.
• Open Interest shed $420 m in the two-day dip—liquidations, not fresh shorts, drove the wash-out.
6.4. Options Skew
• 25-delta risk reversal (1-month): flipped to –4 % (puts pricier than calls) for first time since January—hedging demand but nowhere near panic-level (–12 % in 2022 bear).
________________________________________
7. Fundamental Undercurrents
7.1. Dencun Afterglow & L2 Fees
Proto-danksharding (EIP-4844) slashed L2 data costs by 85 %, pushing average Arbitrum and Optimism transaction fees under $0.02. Cheaper blockspace fuels on-chain activity:
Metric Pre-Dencun Post-Dencun Δ
Daily L2 Txns 2.4 m 4.1 m +71 %
Bridged ETH to L2s 6.8 m 7.9 m +16 %
More usage → more gas burned → structural tailwind to ETH as a fee-burn asset.
7.2. DeFi TVL
Total value locked rebounded to $61 billion, led by EigenLayer and restaking hype. ETH comprises 68 % of TVL collateral—every lending loop pins additional demand.
7.3. Competing Narratives
• Solana season siphoned retail mind-share; SOL/ETH ratio popped 42 % YTD.
• Bitcoin L2s (Stacks, Rootstock) attempt to mirror Ethereum’s smart-contract moat, but dev tooling remains nascent.
•
Net: Ethereum retains developer supremacy (70 % of new GitHub commits among smart-contract chains) and therefore garners institutional comfort.
________________________________________
8. Risks & Catalysts
Factor Bearish Angle Bullish Rebuttal
Macro Sticky U.S. CPI halts Fed cuts → higher real yields weigh on non-yielders ETH staking yield + MEV is real cash-flow; Dencun lowers L2 costs → adoption offset
SEC Spot ETF Delay past Jan 2026 or outright denial kills U.S. inflow dream 19-day streak proves ex-U.S. capital is hungry; approval >0 is all it takes for supply shock
BTC Dominance Halving FOMO may keep Bitcoin’s share >55 %, starve ETH rotation Historical pattern: ETH rips 6-10 weeks post-halving as beta plays catch-up
Tower-Top Pattern Weekly confirmation could spark drop to $2,200 support Pattern fails if bulls recapture $2,750 quickly, turning doji into bullish flag
________________________________________
9. Playbooks for Traders and Long-Term Allocators
9.1. Short-Term Momentum (0–7 days)
• Bias: Range-trade $2,520–$2,620 until breakout.
• Instruments: ETH-perp on Bybit/Deribit, 3× leveraged tokens for reduced funding bleed.
• Trigger: 15-minute candle above $2,620 with ≥ $50 m aggregated CVD buys.
• Stop: $2,560 (triangle retest).
• Target: $2,680 then $2,700.
9.2. Swing (1–8 weeks)
• Bias: Accumulate dips as long as weekly stays >$2,350 (0.382 Fib of Oct→Mar leg).
• Tools: 1-month $2,500-$2,800 call spreads; spot with 25 % collar protection.
• Catalysts: SEC commentary May 23, FOMC June 18.
9.3. Position (6–18 months)
• Bias: Dollar-cost average into staking nodes; carry 4 % ETH on portfolio NAV.
• Thesis: EIP-4844 usage boom + probable U.S. ETF = $4–5 k fair value by 2026.
• Risk Control: Hedge 25 % notional via BTC-perp short if BTC.D >58 %.
________________________________________
10. Conclusion: A Pause, Not a Peak—If Key Levels Hold
The 19-day ETF inflow streak proves that institutional demand for Ethereum exists even without a U.S. spot vehicle. Price responded vigorously but not parabolically, reflecting the asset’s growing market-cap gravity. The nascent “pre-tower-top” weekly candle warns of exhaustion; confirmation, however, requires another bearish week that cracks $2,540 support.
Short-term order-flow shows willing dip buyers, staking metrics scream supply sink, and the macro backdrop—while shaky—fails to dent ETH’s relative value proposition versus fiat yields. Translation: Ethereum is vulnerable to headline-driven squalls but structurally sound.
If bulls recapture $2,620, the path to retest $2,750 and ultimately $3,000 reopens. Lose $2,450 and the tower top will complete, sending ETH toward $2,200 where ETF inflow buyers likely reload. For now, the balance of evidence favors consolidation with an upward skew—tower construction, perhaps, but no wrecking ball yet.

ETH/USDTWe have talked about Ethereum many times and said that the main goal of Ethereum is 3000. Ethereum has had an upward movement and is now in a channel. The last movement it had led to a failure and it went back inside. I think Ethereum is bullish. Comment your opinion.

Ethereum LP Range TighterVolatility has continued to decline, enabling us to tighten the liquidity provision range on Ethereum within the Base network, as indicated by the horizontal red lines. However, trading volume in ETH remains relatively low, which is resulting in minimal fee generation from the pool, we expect that to change: app.uniswap.org
Ethereum Liquidity Pool RangeOn the ETH/USDC liquidity pool on the Base network, Ethereum’s volatility is beginning to stabilize, creating a favorable range for liquidity provision, as indicated by the horizontal red lines. There may be an opportunity to tighten this range further in the coming hours, but additional data is needed to confirm. For now, the concentrated range is being set slightly wider, given that we’re still relatively close to the significant volatility spike from earlier in the week.
$Ginnan chart There’s a pretty simple chart. You can see what it is for yourself. See how this plays out.
