ETH 4H Setup – Double Tap Reversal + Fib TargetsEthereum has printed a double bottom wick rejection just above the 2,468 level and is now attempting a breakout above the local range high. Price has reclaimed structure, indicating potential momentum toward key fib resistances.
Key Technical Zones:
Support Zone: 2,468 – local double bottom (0% fib)
Breakout Level: 2,544 (0.236 fib)
Targets:
TP1: 2,590
TP2: 2,628
TP3: 2,666 (0.618 fib / likely exhaustion zone)
Scenario Outlook:
🟩 Bullish Path:
Strong rejection from 2,468 confirms demand
Push through 2,544 unlocks path to mid 2,600s
Trend continues if macro holds above 2,500
🟥 Bearish Reversal:
Rejection near 2,590–2,666
Bearish engulfing back below 2,507 invalidates this long setup
Could revisit 2,468 and break to 2,440s
Play Idea:
Entry: Reclaim 2,544 with confirmation
SL: Below 2,496
TP1: 2,590
TP2: 2,628
TP3: 2,666
📌 “ETH bulls defend the low — the battle now shifts to mid-range fib control.”
Ethlong

The wick was the test.Ethereum just kissed the 1.0 fib at $2475.33, tapping into a local demand pocket. That sweep cleared weak longs and set up a cleaner drive back into inefficiency.
What’s happening?
→ ETH is targeting the 1H Fair Value Gap (FVG) around $2512–$2522.
→ $2500 zone = critical reaction level.
→ Volume profile confirms buyer interest above $2480.
Entry Zone: $2480–$2490
SL: Below $2475 swing low
TP1: $2512.75
TP2: $2550.14 (liquidity sweep)
Bias: Bullish while above $2475
Why it matters:
ETH rejected the lows and reversed with structure + timing.
If it reclaims the FVG → it reclaims the narrative.

Ethereum D1 Chart Update Hello Traders,
As you can see that there SBR Zone maintained with RSI DIV as long SBR zone maintained market remains Bearish for shorter Term
once market will break SBR and turned SBR to RBS the it will move towards 3500 or even 3900
Disclaimer: Forex is Risky

ETH is compressing for one reason — delivery.This isn’t just sideways chop. This is coiled intent.
ETH is sitting on top of the 0.618 fib at 2,496.25, after a controlled retracement from 2,546.84. We’ve printed a minor sweep below local lows into a high-volume shelf — exactly where Smart Money wants to reaccumulate.
A 1H Fair Value Gap is forming between 2,505–2,515. That’s the inefficiency that price is magnetized to. It will either reject there (distribution) or displace above it and flip the narrative bullish.
The decision is not in guessing direction — it’s in watching how price interacts at the FVG.
If we break and hold above 2,527.52 (0.236), the draw becomes clear: 2,549.69 and beyond.
Execution focus:
🔄 Current range: 2,496–2,505 (PD array and FVG base)
🔺 Bullish trigger: reclaim 2,515.57 and hold
🎯 Target: 2,549.69
🔻 Bearish scenario: rejection at FVG → continuation to 2,464.97 (final sweep zone)
Let others predict.
I just read the imbalance — and position accordingly.

$ETH Analysis — Correction Incoming?Summary:
After a strong ~100% rally in ETH, price hit a major resistance zone near $2734.78, triggering a significant sell-off, likely driven by algorithmic profit-taking. Now, the market is poised for a healthy correction before another potential leg up.
📉 What's Next for Ethereum?
🔍 Expecting a Correction of 7% to 25%
Based on technical structure and indicator behavior, ETH is likely to retrace to one of the two key zones:
✅ Primary Buy Zone ("Most Likely"): $2297.20
This zone aligns with previous structure support.
It’s where the price may form a higher low and resume its upward trend.
Ideal for opening a swing long with a tight risk-reward ratio.
🔥 Deeper Correction Opportunity: $1779.58
While less likely, a drop to this level would be a major long opportunity.
Aligns with historical demand and long-term support levels.
Also intersects with the yellow trendlines suggesting trend-based support zones.
📊 Why This Correction Makes Sense:
Weekly Money Flow Index (MFI) is Dropping:
MFI divergence suggests money is flowing out, weakening bullish momentum.
A trigger wave is forming, often preceding price corrections.
Algo Profit-Taking is Done:
Smart money likely exited around $2734.78 (highlighted in chart).
They’ll need to accumulate again at lower levels before the next rally.
📈 Potential Upside Targets:
If ETH respects the structure and finds support around $2297 or deeper, we could see a rally toward $3296.85 — a key Fibonacci extension and psychological level.
🧘♂️ Reminder:
No emotional entries. Let the price come to you. Trust the setup and stick to your plan.
📌 Disclaimer: This is not financial advice. Just a breakdown of my trading thesis. Always manage your risk.

ETHUSDT Breakout Watch: Bullish Momentum Brewing🧠 Chart Analysis Summary:
This chart suggests a bullish continuation is likely for ETHUSDT based on the current market structure and visual cues:
🔍 Key Observations:
Current Price Zone:
Trading around $2,574, inside a consolidation range (highlighted blue box).
Strong Supply Area Identified:
Around $2,335.93 (marked in purple) – acted as a solid demand/support zone fueling the current move.
Breakout Box:
The price is forming a rectangle pattern, indicating accumulation or consolidation before a breakout.
Bullish Projection Arrows:
Two projected paths show:
Minor dip toward the supply area followed by a bullish breakout 🚀.
Immediate breakout from the box towards resistance levels.
🎯 Target Levels:
First Target: 🟣 $2,918.70 – “possible next move”
Second Target: 🎯 $3,006.40 – strong resistance zone
🧩 Conclusion:
This setup suggests ETH may be preparing for a breakout from the consolidation zone. If bulls maintain control, we could see a rally towards $2,918 - $3,006 in the coming weeks.
Risk Tip: Watch for a fakeout if price dips below the consolidation range — especially near the $2,335 area.
🧠 Trading Tip:
Use volume confirmation and candle closes above the box to validate the breakout! 📊

PIXELUSDTThe outcome of this analysis is that based on the structure of a zero - D wave, which may be a pig or triangle, or even a pig, we should look for the optimal areas to buy Spot …
In the event that this analysis is correct, it may be ideal to purchase Spot in the vicinity of Beijing to the tribes.
A cautious target for the Chinese outbreak and a more risky target could be a dollar casualty.
In time terms too, mid - June and more accurately the beginning of the third week of June would be the ideal approximate time for the start of the DC wave …
As indicated in the chart late July and early September are important times in the chart that will probably work depending on the structure and my guess is that the mentioned times are the ideal time for the end of the larger D - wave …

ETH >>> Inverse Head & Shoulders Breakout Sets Stage for RallyHello guys!
Ethereum has formed a textbook inverse head and shoulders pattern on the 15-minute timeframe and just confirmed a breakout above the neckline. This bullish reversal formation comes after a sharp downtrend, signaling a potential shift in short-term momentum.
📌 Breakout Level: ~$2,645
🎯 Potential Target: ~$2,730–$2,750 based on the pattern height
🟦 Retest Zone: ~$2,620–$2,640
We’re currently seeing a healthy breakout followed by a possible retest of the neckline, which could offer a solid entry for continuation toward the upper boundary of the channel.
If bulls hold this structure, ETH could accelerate higher in the coming sessions.

ETH isn’t done. It’s just hunting stops.This isn’t a dump. This is preparation.
ETH swept the low into the 0.786 retracement — right where liquidity was resting. The 1H chart shows an engineered drive down into 2,490.26, just above the final inefficiency at 2,474.00. That’s the last fill zone before repricing.
Look left — we’re now sitting at the tail end of a low-volume node. Price doesn’t stick here. It reacts.
I’m watching for a shift back into the 2,503–2,512 zone, where the 0.5 retracement overlaps the 1H OB. That’s the first stop. Beyond that, 2,520.97 marks the high-volume shelf and the 0.382 retrace — the true magnet.
If ETH reclaims that zone with strength, I expect delivery back to 2,550. If not, expect one more purge below 2,474 — and then the real reversal begins.
Execution logic:
🎯 Long trigger: 2,490.26–2,474.00 sweep
🧠 TP 1: 2,512 (OB/50% retrace)
🧠 TP 2: 2,520.97–2,532 (HVA zone)
❌ Invalidation: clean 1H close below 2,474 = new range forming
This is where most traders hesitate.
I don’t guess the bottom. I wait for Smart Money to make it.

They thought ETH was breaking down. I saw the setup buildingThis ETH move has nothing to do with fear. It's engineered delivery.
We swept the local range low, tapping directly into the 1.0 extension around 2,463 — right at the edge of a thin volume node. That’s where Smart Money accumulates, not where it panics.
I’ve seen this structure play out too many times:
Consolidation under an old high
Expansion that traps late buyers
Retracement right back into a 4H OB + 0.786 level (2,533 zone)
Then, manipulation meets inefficiency — and price delivers
From here, I’m expecting a move toward the first objective: 2,677. That’s the .382 retrace sitting just above a HVN and right under the 4H OB. A perfect draw. Not random — designed.
Above that, the volume imbalance between 2,677 and 2,713 becomes the magnet. Price will fill it or reject it clean — but either way, that’s where liquidity sits.
Key levels I’m watching:
🚀 Entry from OB rejection around 2,463–2,533
🎯 First TP: 2,677 / Next zone: 2,713
❌ Invalidation: 4H close through 2,463 with velocity
This isn’t reactionary trading.
This is watching price deliver exactly where it should.
Structure speaks louder than any signal group.

ETH Holding Long-Term Support – Road to $4K Open?CRYPTOCAP:ETH has successfully bounced from a long-term rising trendline that has acted as strong support since 2020. This trendline has historically triggered major bullish moves, and it’s doing its job once again.
Notably, ETH has also reclaimed the mid support/resistance level, which had previously acted as a key flip zone in past market cycles.
With both the trendline and horizontal support holding, the structure looks bullish. If momentum continues, ETH could head toward the upper resistance line, potentially targeting $4,000+ in the coming months.
The trend remains intact — this bounce could mark the start of a major leg up.


ETH Investors Are Confused, But the Algorithm Says $40K's Coming🚨 Ethereum: Confusion or Opportunity?
Many investors are currently confused — wondering whether Ethereum (ETH) is due for a deeper retracement… or if it’s about to skyrocket. So, what’s really going on?
According to our algorithmic model, ETH confirmed a long-term price target of $40,000 the moment it broke above $3,594 on March 11, 2024.
The pullback that followed?
It’s not a sign of weakness — it’s a golden entry opportunity for the next leg up with a garenteed x15 ROI from actual prices.
📉 The $883 low is considered a protected low, and according to our structure, it will likely remain untouched until ETH reaches $40,000.
💰 Why We’re Heavily Exposed to ETH
Given the current market conditions, we’ve allocated the majority of our capital to Ethereum, as it currently represents one of the most secure and promising assets in the crypto space for mid- to long-term positioning.
This isn’t just a trade — it’s a strategic investment.
🚀 Happy Trading,

Is Ethereum set to fire up ?Ethereum has been consolidating for the past 2 weeks between 2300 and 2700.
Upside resistance at 2700-2750 levels puts pressure on short-term prices.
A convincing close above the 2750 level triggers fresh upside in the short term, leading to a retesting of 3300 as an Initial target. Risk is defined at 2300. A close below this level will negate the bullish view.

ETHEREUM AT A CRUCIAL INFLECTION POINT:CRYPTOCAP:ETH has been grinding just below a major resistance zone (~$2,850) after breaking out of a long-term descending channel.
This is the final barrier before a potential rally towards $4,000.
What to Watch:
Resistance: ~$2,850
Break above = momentum likely to accelerate
Rejection = possible pullback to retest breakout zone (~$2,400–$2,200)
Structure is strong, but confirmation is key. Bulls must clear this ceiling with volume.
Patience. React to a breakout or rejection — don’t front-run.

#ETH/USDT#ETH
The price is moving within a descending channel on the 1-hour frame, adhering well to it, and is heading for a strong breakout and retest.
We are seeing a bounce from the lower boundary of the descending channel, which is support at 2465.
We have a downtrend on the RSI indicator that is about to break and retest, supporting the upward trend.
We are looking for stability above the 100 moving average.
Entry price: 2558
First target: 2640
Second target: 2702
Third target: 2768

ETH/USDT Trade Setup: Bullish Trend, Entry Zone & More🚀 ETH/USDT Trade Setup 💸📊
Keeping a close eye on Ethereum paired with USDT right now. 🔍📈
ETH has been holding a solid bullish trend, with healthy pullbacks into value zones that have repeatedly offered discounted long entries. 🛒⚡
I’m bullish overall, looking to trade with the trend. Looking for ETH to dip into my preferred entry zone. 🎯
🛡️ Stop-loss to go just beneath the most recent swing low to keep risk tight and controlled.
In this video, I cover:
🔹 How I apply Fibonacci tools to dial in my entry points and targets
🔹 My full ETH game plan, including the zones I'm watching and how I’m managing this setup
⚠️ Not financial advice. Always do your own due diligence and risk management.
💬 Are you trading ETH right now? What are your thoughts? Let me know in the comments below! 👇🔥

ETH/USDT 4HOUR CHART UPDATE !! ETH/USDT Chart Analysis
Ascending channel: Price is moving within a rising channel, with higher highs and higher lows, indicating bullish momentum.
Strong support area (~$2,600): Price repeatedly bounced off this level, reinforcing it as a key support zone.
Immediate resistance: Price is testing the upper boundary of the channel around $2,800–$2,850.
The 50-day MA (red) and 200-day MA (green) are trending upward, supporting the bullish structure.
A breakout above the channel’s resistance (above $2,800) could trigger a move toward $3,000–$3,200.
Failure at resistance might lead to a retest of support around $2,600, and a break below that could send the price back to the yellow zone (~$2,200).
Conclusion:
Bullish above $2,600, especially if $2,800–$2,850 is cleared with volume.
Bearish risk if price breaks below the channel, especially under $2,600.
Thanks for your support!
DYOR. NFA

eth/usdtHello, this is my daily analysis for Ethereum and I think we are in the best place on the chart and we can have an upward trend. What do you think, friend?

ETH/USDT At A Premium — What’s Next? Smart Entry Strategy!I'm currently analyzing ETH/USDT 🧠💹 — Ethereum has been in a strong bullish trend, recently pushing into all-time highs 🚀🔝. While the momentum remains intact, price is now trading at a premium 🏷️, and I’m cautious about entering long at these elevated levels ⚠️.
In the video, we break down the trend, market structure, and price action with precision 📊🧱. I also explore potential entry scenarios that align with low-risk, high-probability setups 🎯🔍 — ideal for those waiting for the right moment to engage without chasing the move.
You'll also get a deep dive into my Trend Continuation Strategy 🔄📈 — a powerful framework for identifying smart entries in trending markets.
🛑 This is not financial advice

ETHBTC | Blue Boxes Holding, Market Shift BrewingETHBTC is quietly building strength. The blue boxes below have held well as demand zones, and recent reactions hint that buyers are stepping back in.
CDV is starting to shift, and we’re seeing early signs of accumulation. No breakout yet, but the structure suggests the market may be preparing for one.
A clean push above local range highs with volume would confirm the shift. Until then, patience pays.
📌I keep my charts clean and simple because I believe clarity leads to better decisions.
📌My approach is built on years of experience and a solid track record. I don’t claim to know it all but I’m confident in my ability to spot high-probability setups.
📌If you would like to learn how to use the heatmap, cumulative volume delta and volume footprint techniques that I use below to determine very accurate demand regions, you can send me a private message. I help anyone who wants it completely free of charge.
🔑I have a long list of my proven technique below:
🎯 ZENUSDT.P: Patience & Profitability | %230 Reaction from the Sniper Entry
🐶 DOGEUSDT.P: Next Move
🎨 RENDERUSDT.P: Opportunity of the Month
💎 ETHUSDT.P: Where to Retrace
🟢 BNBUSDT.P: Potential Surge
📊 BTC Dominance: Reaction Zone
🌊 WAVESUSDT.P: Demand Zone Potential
🟣 UNIUSDT.P: Long-Term Trade
🔵 XRPUSDT.P: Entry Zones
🔗 LINKUSDT.P: Follow The River
📈 BTCUSDT.P: Two Key Demand Zones
🟩 POLUSDT: Bullish Momentum
🌟 PENDLEUSDT.P: Where Opportunity Meets Precision
🔥 BTCUSDT.P: Liquidation of Highly Leveraged Longs
🌊 SOLUSDT.P: SOL's Dip - Your Opportunity
🐸 1000PEPEUSDT.P: Prime Bounce Zone Unlocked
🚀 ETHUSDT.P: Set to Explode - Don't Miss This Game Changer
🤖 IQUSDT: Smart Plan
⚡️ PONDUSDT: A Trade Not Taken Is Better Than a Losing One
💼 STMXUSDT: 2 Buying Areas
🐢 TURBOUSDT: Buy Zones and Buyer Presence
🌍 ICPUSDT.P: Massive Upside Potential | Check the Trade Update For Seeing Results
🟠 IDEXUSDT: Spot Buy Area | %26 Profit if You Trade with MSB
📌 USUALUSDT: Buyers Are Active + %70 Profit in Total
🌟 FORTHUSDT: Sniper Entry +%26 Reaction
🐳 QKCUSDT: Sniper Entry +%57 Reaction
📊 BTC.D: Retest of Key Area Highly Likely
📊 XNOUSDT %80 Reaction with a Simple Blue Box!
📊 BELUSDT Amazing %120 Reaction!
📊 Simple Red Box, Extraordinary Results
📊 TIAUSDT | Still No Buyers—Maintaining a Bearish Outlook
📊 OGNUSDT | One of Today’s Highest Volume Gainers – +32.44%
I stopped adding to the list because it's kinda tiring to add 5-10 charts in every move but you can check my profile and see that it goes on..

ETH(based on NEowave)I changed my analysis and I think Its better to consider eth in the middle of the running diamond diametrical.
stop loss of this analysis is 2400$.

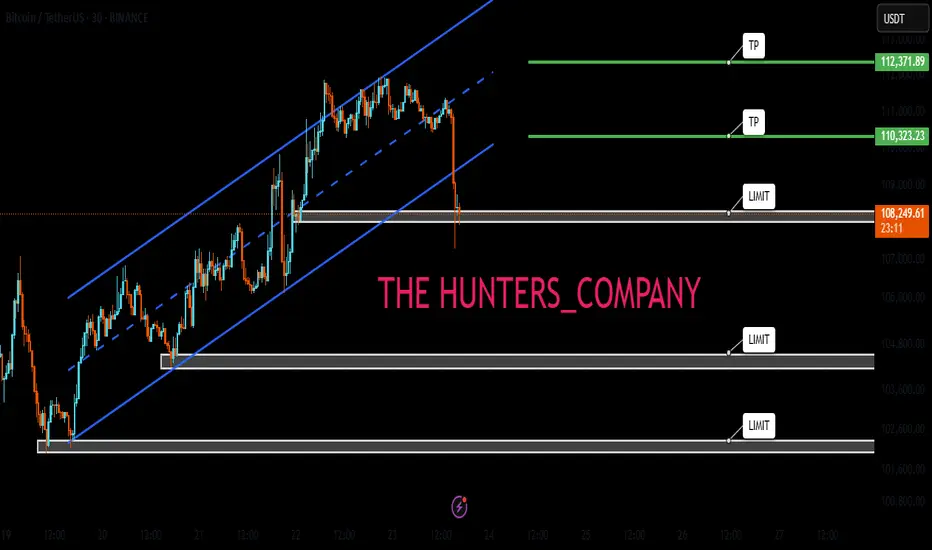
BITCOIN SIGNALS (DON'T MISS)Hello friends
Given the good price growth we had, you can see that the price has entered a correction and has provided us with a good opportunity to buy in steps in the specified support areas (of course with capital management)
The targets have also been specified...
*Trade safely with us*