BUY MORE ETH AT THIS ZONE AND HOLD!!!!BUY MORE ETH AT THIS ZONE AND HOLD!!!!
I will drop a lot of pictures on this to make it easily understandable
Firstly on the 3Months time frame we have an all-time high and a drop to 78.2% on Fibo which is 1054.33
then we started reversing slowly, I didn’t see it at first but then I saw it on the drop to 1364.5.
A series of HH and HL has been created; the latest one was in 1597. which is at 61.8% Fibonacci from the previous High indicating a reversal that we are seeing
So I expect that low to take out the previous high at 2145 and then find a new higher high which will be at 2449 or high to 3028 there we will see what the market will do and then see.
Check out my trade on Eth with the link
Ethlongsetup

#ETH - thoughts out loud №3Good evening from Ukraine!
Dear colleagues, I am glad to welcome you!
I expect the price to rise to 2000, and then we'll see.
Thank you all for your attention, I wish you success.
Sometimes you win/sometimes you learn.
- thoughts out loud
- thoughts out loud
- thoughts out loud

ETH Correction Phase after Bear Rally: Is it Sustainable? I want to discuss Ethereum (ETH) and the possibility of a correction phase following its recent bear rally, with a new target of $2000. However, it is crucial to approach this potential development cautiously and consider the sustainability of any price changes.
As many of you know, ETH has experienced a remarkable surge in value over the past few months, reaching unprecedented heights. This impressive rally has undoubtedly captured traders' attention seeking lucrative opportunities within the cryptocurrency space. However, it is essential to remember that markets are inherently volatile, and what goes up must eventually come down.
While a correction phase may be imminent for ETH, assessing the sustainability of any potential price changes is essential. Market dynamics, investor sentiment, and external factors can all influence the direction of cryptocurrencies, making it difficult to predict their long-term behavior accurately. Therefore, it is crucial to exercise caution and approach the situation with a measured perspective.
Considering the potential for a correction phase, evaluating your current positions in ETH may be prudent. Diversification is vital in any investment strategy, and adding a few positions in ETH could be careful. However, it is equally important to carefully manage risk and only allocate what you are comfortable with, as the market's unpredictability remains a significant factor.
As always, I encourage you to conduct thorough research, stay updated with market news, and consult with trusted advisors before making any investment decisions. The cryptocurrency market is known for its volatility, and it is essential to remain vigilant and informed.
In summary, while the possibility of a correction phase looms over ETH after its recent bear rally, it is crucial to approach the situation with caution. The sustainability of any price changes is uncertain, and it is essential to evaluate your current positions and consider diversification. Remember to manage risk prudently and make informed decisions based on reliable information.

ETH - Confluence of Key Levels Before the Big LeapI believe that Ethereum is on the verge of a significant shift, as it has recently exhibited some encouraging trends. Before we embark on the voyage to over $2000, I anticipate ETH to retest a key area where several significant levels converge.
OTE (Optimal Trade Entry): This is a vital area where we may observe intense purchasing pressure, a retest here would afford those who missed the initial move an excellent opportunity.
FVG (Fair Value Gap): After a breakout, ETH tends to retest this region. A retest of the FVG would corroborate the breakout's strength and provide further confirmation for the impending move.
SR (Support/Resistance): Finally, I anticipate a retest of the significant SR area, this is a common occurrence in the market and serves as the ultimate affirmation prior to a significant price movement.
Interestingly, the OTE, FVG, and SR all converge in the same region, this convergence of important levels bolsters its significance and makes it a prime location for potential entry.
In conclusion, despite the fact that I am bullish on ETH and see a potential move to $2000 or more, I believe a retest of this confluence area will provide excellent entry points and add further confirmation to the bullish outlook, always practice risk management and successful trading!
Please note that this is not financial advice, prior to making any investment decisions, you should always conduct your own investigation.

Buckle Up for ETHUSD Significant Upside PotentialETHUSD is poised to emulate the trajectory of other major currencies. While BCH led the way and LTC is currently undergoing a similar process, I believe that ETH's upcoming movement will catch everyone off guard. The symmetrical triangle has been decisively broken, with confirmation already on the weekly chart and the price now positioned for takeoff.
Furthermore, it is comfortably ahead of both the 50-day and 200-day moving averages on the weekly chart. Notably, the 50-day moving average has evidently crossed above the 200-day moving average, which bodes well for its prospects. Barring any negative developments in terms of fundamentals, ETH is primed to surge ahead, capturing attention and generating significant interest. The implications for altcoins remain uncertain, although ETH's performance may have a positive influence on them.
So, buckle up and enjoy the exciting journey!

ETH Hidden Buyers , Short Squeeze Potential Targeting $2k -$2400Analysis Note: This analysis will be continuously updated until the target or failure occurs, so please check back regularly for trade updates. At the end of the analysis, there will be a free trade signal to follow. If you found this post helpful, don't forget to hit the boost and follow buttons.
ETH Chart Analysis: According to MT Pandora's Box, ETH is expected to reach the range of 1850 to 1864 from its current range of 1724. The reason behind this projection is that the price is still trapped within a larger range on a higher timeframe. It's important to understand that most breakouts, like attempts to end a trading range and establish a new trend, tend to fail. MT Pandora's Box indicates that buyers are currently accumulating and planning for another upward movement, which could lead to a short squeeze and potentially push the price to the range of 2200 to 2400.
Although our initial prediction for a significant drop in ETH was $800, *click to read*
we realized after our short from 2k that there is a possibility of a bounce at the current support level, with a chance of up to 65%. Market makers who plan to short will likely first buy at this level and then drive the price slightly above the previous high. The duration of this situation and capital accumulation will determine whether this lasts until November or December 2023. However, we believe the best opportunity to short Big on ETH to below 1k will be by then, In the short term, we anticipate a bounce at the current support level, but we remain bearish overall. I am personally buying some ETH here to take advantage of the unseen hidden buyers' pull-ups, and then I plan to switch to a short position at 2400. It's important to remember that price is still range-bound, so rejections and failures are common in such situations. Here are some key resistance levels to consider, as they could lead to significant reactions from sellers:
Resistance Area 1 (Bear Barrack): 1850 to 1865
Resistance Area 2 (Bear Barrack): 1930 to 1950
Resistance Area 3 (Bear Barrack): 2000 to 2140 (most stubborn)
Since failures are likely when the price is stuck in a range, we will regularly update this post to keep you informed about the next actions as the price unfolds and the buyers' reaction to these resistance areas, whether the upward movement will continue or fail. Market makers move in mysterious ways, so it's important to note that the chances of ETH dropping instead to a much stronger support at 1620 is still not completely gone and still stand at 35% and should not be totally ignored as this will be a simple Bull hunt to gather liquidity to hunt Bears this is why we recommend buying in pieces
CRYPTOCAP:ETH Bulls Vs. Bears Battle Signal Updates:
#ETH LONG FREE TRADE SIGNAL
ASSET: $ETH/USDT
ACTION: LONG
1st ENTRY PRICE: $1730, $1738, $1744
STOP LOSS: 1610(much risky but tighter stop loss but can easily get hunted is 1710)
1st TAKE PROFIT: $1850, 1865, 1945 (Extended TP: 2k, 2200-2400)
Disclaimer: This signal is provided for informational purposes only and does not constitute financial advice. Cryptocurrency trading carries risks, and past performance is not indicative of future results. The user assumes full responsibility for any profits or losses incurred, and the signal provider is not liable for any investment decisions made based on this signal.

50d 200d moving cross for ETH as new support level I wanted to share some exciting news: ETHER has just had a popular 50d 200d moving average cross, establishing a new support level. This is great news for us as traders, as it clearly indicates a bullish trend.
What's more, the RSI (Relative Strength Index) is currently at an optimal time for entry. This means that now is the perfect time to consider opening a position in ETHER.
I know some of you may be hesitant to jump in, but I encourage you to consider taking a position in ETHER. With the recent upward trend and establishing a new support level, there's never been a better time to invest.
So, what are you waiting for? Don't miss out on this opportunity to profit from the current market conditions. Take a look at ETHER and consider opening a position today.

Will ETHUSD continue to drive up after RSI moves upGreetings fellow Ether traders! I have some exciting news to share with you all today! The ETHUSD RSI is currently at 53 and on Friday, we saw a low of $1,650. But, hold on to your hats, because earlier today, ETH/USD soared to an intraday peak of $1,752! This is fantastic news for all of us who have invested in Ether and I can't wait to share more details with you all. So, let's dive in and explore the latest developments in the world of Ether trading!

ETH has reached a suitable support intersection !!If ETH can maintain this support (uptrend line and demand zone) and show a good reaction, we can expect to reach ETH 2400 during the three phases.

💥 ETHUSD 1D-TIMEFRAME ANALYSIS💥 ETHUSD 1D-TIMEFRAME ANALYSIS
💗Hello ladies and gentlemen
This is my new idea for 💥 Ethereum
12345
I hope my idea is clear
Support me by like and share thank you
Stay Safe💯💲💲💲
Good luck💰😍

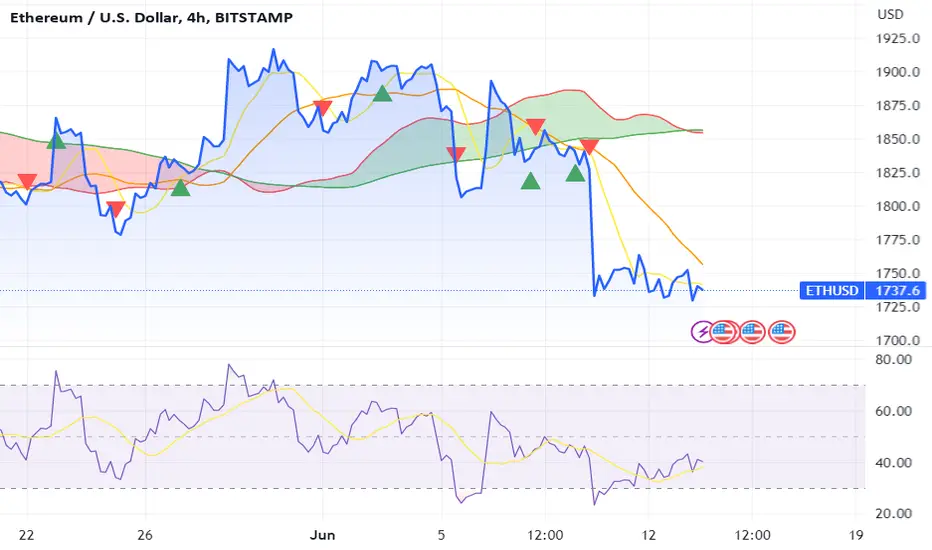
Ether RSI shows short term pop up I wanted to update you on the recent price movements of ETH/USD. Yesterday, the cryptocurrency reached a high of $1,761.96, but today it slipped to an intraday low of $1,727.75. Currently, it moved below a floor at $1,730.
However, bulls have stabilized this support zone, with the RSI finding its floor at 38.00. Currently, the price strength is at 38.81, which is within the oversold region. This could potentially be a positive sign for those looking to buy low.
Please let me know if you have any further questions in the comments.

Will ETH push to $1800 with the current level of RSI?I wanted to share some Ethereum (ETH) trading updates with you. While ETH moved slightly higher, it is still trading below $1,800. In today's session, the price of ETH/USD reached a high of $1,757.89, an improvement from yesterday's low of $1,723.09. The recent surge in price was due to bullish activity at a floor of $1,730, with the RSI bouncing from a floor of its own at 38.00.
Per the daily chart, the current price strength is tracking at 39.33, with the next visible point of resistance being 43.00. If the index moves beyond this ceiling, there is a strong possibility that ETH will climb to $1,800.
I hope this information is helpful to you. If you have any questions or concerns, please do not hesitate to comment in this idea.
Ethereum to see limited losses?Ethereum - 24h expiry - We look to Buy at 1722 (stop at 1672)
We are trading at oversold extremes.
Support is located at 1720 and should stem dips to this area.
Bullish divergence is expected to support prices.
Expect trading to remain mixed and volatile.
The move lower is mixed and volatile, common in corrective sequences.
Our profit targets will be 1842 and 1862
Resistance: 1755 / 1775 / 1800
Support: 1730 / 1715 / 1700
Please be advised that the information presented on TradingView is provided to Vantage (‘Vantage Global Limited’, ‘we’) by a third-party provider (‘Signal Centre’). Please be reminded that you are solely responsible for the trading decisions on your account. There is a very high degree of risk involved in trading. Any information and/or content is intended entirely for research, educational and informational purposes only and does not constitute investment or consultation advice or investment strategy. The information is not tailored to the investment needs of any specific person and therefore does not involve a consideration of any of the investment objectives, financial situation or needs of any viewer that may receive it. Kindly also note that past performance is not a reliable indicator of future results. Actual results may differ materially from those anticipated in forward-looking or past performance statements. We assume no liability as to the accuracy or completeness of any of the information and/or content provided herein and the Company cannot be held responsible for any omission, mistake nor for any loss or damage including without limitation to any loss of profit which may arise from reliance on any information supplied by Signal Centre.

ETH may dump before the pumpETHUSDT speculative long setup:
Crypto market seems to be struggling to break higher. If we see more downside on crypto, we expect ETH to drop to 1500 $ which would be another higher low in the current uptrend.
Entry for a swing long: 1550$
Target: 2500$
Good luck

ETH could reach 10x by 2030 Are you ready for some exciting news? VanEck, a leading investment management firm, has just predicted a 10X surge in Ethereum's price by 2030! That's right, you heard it correctly - Ethereum could be worth 10 times its current value in just a decade.

Will you believe the upcoming short term strength of ETHGreetings fellow crypto traders! Are you ready for some good news? Well, hold on to your hats because we've got some exciting developments in the world of Ethereum's technical analysis outlook! After months of uncertainty, Ethereum's price is finally showing signs of a bullish trend. So, if you're looking to invest in a promising cryptocurrency, look no further than Ethereum.

Here's How ETH goes to $3K: Elliot WaveHi Traders, Investors and Speculators of Charts📈📉
Ethereum has recently started a new bullish cycle along with the rest of the markets, predominantly led by BTC as always.
When we take a look at ETH from an Elliot Wave Theory analysis, we see the start of a new 12345 Wave cycle. ETHUSDT is currently trading in Wave 2-3, generally know as the longest/biggest wave of all the waves during the upward price action phase.
There are a couple of theoretical points to consider when using the Elliot Wave theory and we take a deep dive into the theory and conclude the possible end point of Wave 2-3 at $3k.
From a Technical Indicator analysis, we see a BUY signal flash on the weekly timeframe with CryptoCheck START V3.5:
The weekly TF together with this indicator is usually a great way to confirm the bias f bullish price action.
_______________________
📢Follow us here on TradingView for daily updates and trade ideas on crypto , stocks and commodities 💎Hit like & Follow 👍
We thank you for your support !
CryptoCheck

ETH Continues to Soar so It is Time to Trade Short Term!
I hope you have been enjoying the positive momentum ETH has been experiencing lately. It's been an exciting time for all of us, and I'm thrilled to see our favorite cryptocurrency continuing to soar!
As you all know, ETH has steadily risen, breaking new records and reaching new heights. It indicates that the market is bullish on ETH, and we expect to see more growth in the coming days.
So, what does this mean for us traders? First, it means that there's a fantastic opportunity to capitalize on the current trend and make some profits in the short term. The market is showing strong support for ETH, and this is the perfect time to enter a short-term trade.
I encourage you to take advantage of this opportunity and start trading ETH in the short term. With the positive momentum, we can expect to see some quick gains, and it's an excellent chance to maximize our returns.
Let's not miss out on this chance to make some profits and continue to ride the wave of success with ETH. So, prepare to trade and make the most of this bullish market.
Thank you for being a part of this community, and I wish you all happy trading!

My vision of the scenario on the $ETHArguments for this development of events:
1) A wedge was drawn in the ETH/BTC pair, which will most likely go up (it means that a final impulse is possible, it should be sold
2) Everything above $1,800+ was distributed to weak hands
3) As for this instrument, the mood in the crowd is mostly long (positive for the future fall)
4) Waiting for regulation of the crypto market (this will lead to the final wave of decline)


Why ETH offer double return over BTC in the last year? I hope you're doing great! I wanted to share some exciting news with you about the performance of Ethereum (ETH) over the last year.
As you may know, Bitcoin (BTC) has been the talk of the town for quite some time now. However, ETH has been silently outperforming BTC over the last year. ETH has grown over 5.7% in value in the previous 12 months, while BTC has last only 6.06%. That's right, and ETH has nearly doubled the growth of BTC!
This clearly indicates that ETH is becoming a more valuable and reliable investment option. And with the recent upgrades to the Ethereum network and the growing popularity of decentralized finance (DeFi), the future looks even brighter for ETH.
So, if you're looking to invest in a cryptocurrency with a higher potential for growth and stability, I highly recommend investing more in ETH over BTC. Don't miss out on this opportunity to join the ETH revolution!
Thank you for your time and consideration. Happy trading!

ETH DAILY TFhello folks
today i am waiting for eth price moved upto 1980 usd then fall down to 1520$
my pattren ananlysis chart pattren and smc
eth take buy side liqudity then goto the next ob zone 1520
wait for confomation within 2 or 3 days at to coming
please leave your comment below

Can ETH skyrocket by breaching this level for an astounding 50% Guys, we're looking at a big move up ahead. Here's why it's likely to break this level:
>Notice the Green boxed candle. It often signals a change of character (here in the upward trend), suggesting this level will be surpassed soon.
>When a 10-day green candle closes above the level (R1), expect a 50% price increase. Set your stop loss at the light blue box.
>Even if the price temporarily drops, lower time frames confirm a potential move to the DARK blue level. Keep a tight stop loss (above the R1) and aim for a 31% decline.
Remember, your input is valuable in the comments. Let's discuss and share our thoughts.
Good luck!
