SHORT PLAN for Ethereum upcoming upgradeBYBIT:ETHUSDT.P
4h time frame
-
Ethereum's Shanghai upgrade is imminent.
Also, we can notice there is a potential double top structure forming.
Try to short it if break down that uptrend line.
Ethpriceanalysis

📈ETH analysis above 1801 level📉BINANCE:ETHUSDT
COINBASE:ETHUSD
Hey everyone, first take a look at my previous analysis and positions.
For a long position, Ethereum needs to stay above 1800-01usdt.
Don't forget to risk-free your position.
Please share ideas and leave a comment,
let me know what's your idea.
CrazyS✌

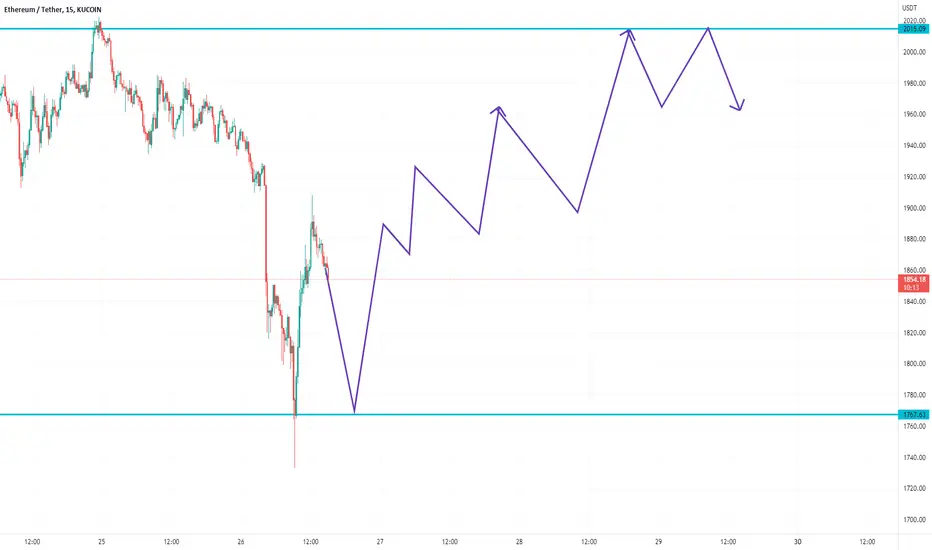
Ethereum to 2k usdEthereum finally broke its resistance of 1830 usd. This is a welcome break after a 17 days sideways period.
Right now we're at day 25 out of the on average 65 days cycle of Bitcoin. I'm using Bitcoin as a reference as Ethereum is highly correlated to that asset. Meaning we still have a max of 2-3 weeks of upside potential, as I expect us to have peak at the right side of the halfway point of the daily cycle.
I believe this move will bring Ethereum at least to 2k usd as that is where the next resistance resides.


ETHEREUM ETH price moves clearly, a good asset to tradeThe global idea for ETHUSDT that we published more than a month ago is still relevant and is being developed well.
The ETHUSD price has entered the $1750-2000 liquidity zone and the process of "braking" growth has begun. It seems that it is still not strong enough to break above $2000, and a correction is needed.
If during the correction, ETH buyers manage to keep the price above $1600, it will mean that they have the strength, motivation, and goal to drive the price much higher.
We also expect a correction on the BTCUSDT chart. The idea that we published at the beginning of the week is relevant, we just have to wait a little bit)
Have a great weekend
____________________
Did you like our analysis? Leave a comment, like, and follow to get more

Eth(based on NEo wave)Hi. Last time I published daily TF and this is the mono wave of that wave.with breaking the down trend you can open short position,I hope you enjoy.

ETH SECURITY ISSUE ETH IN DANGER;!Eth is considered to be a strong project after Bitcoin recently Eth has been upgraded it was previously on Proof of Work now it has been upgraded to Proof of Stake. New York Attorney General Letitia accused Eth of having security issues, so the case will continue for now. The Shanghai update is going to happen in the month of March and people will have ETH stacks that have been stacked for years and there will be a selling pressure due to which Eth is expected to crash by 10-15%.

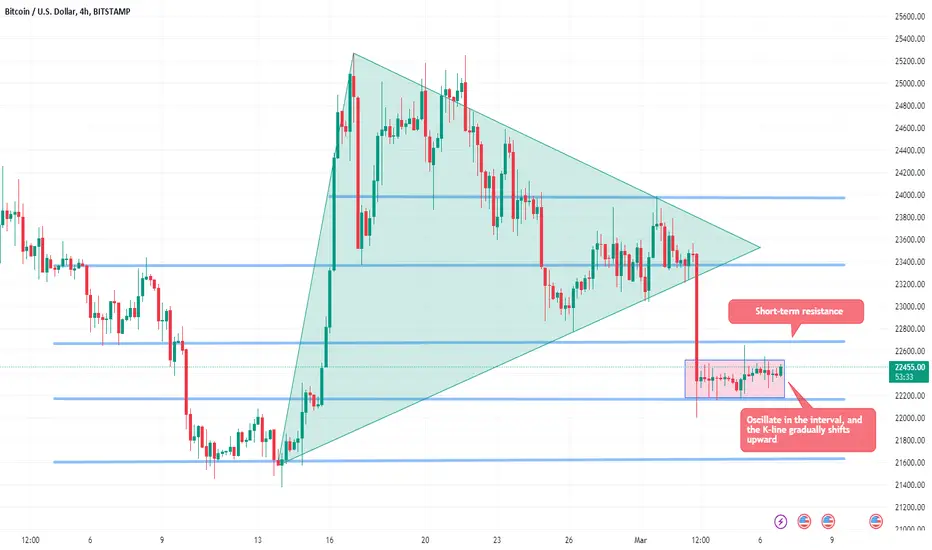
Bitcoin is facing a key decisive battle, will the bulls rise?
As of the update, the current price of BTC/USDT is US222,438, and the daily performance still shows a short trend, but the current price has been maintained at a small fluctuation, not quantified, this situation is much like just after an unusually intense exercise, you need to calm down.The current position of the daily line near 22500 is the key. If it can stabilize at this position, then the price environment of BTC/USDT will be greatly improved; there is even an opportunity to rebound to the 23700 mark; and once the 22500 position cannot be held, then BTC may fall to the level of 22000 or even 21500.
Judging from the 4-hour chart, the price of BTC is gradually shifting upward, and the MACD technical indicators are gradually rising. However, in terms of strength, the short-term will not rise too high. It is estimated that there will be no major fluctuations in the first few days of this week, and it will run in the range of 22200-22700.
In order to facilitate you to continue to follow up on my analysis and sharing, you can like and follow me. In addition, you can enter my channel for free in the following ways to follow real-time views and operational strategies.
ETH at Symmetrical Expansion Pattern#Ethereum 4hr #TA at #Binance
As per weekly chart, ETH still under #Bearish #Descending Triangle Pattern but as per 4hr cycle, it is moves as per Symmetrical #ExpansionTriangle from last 25 days and chances to Break lower cut-off $1450 upto 9-10 March.

ETH/USD Critical Breakout Level of 3 Year Structure!Hello Traders,
Haven't made a post in a year since I called the top of the last bull-run (you can see it in the linked ideas).
This post is an alert to anyone watching the macro of crypto. A confluence area of .786 Fibonacci retrace, 2018/2019 all-time high, a year old supply line breakout, and 3 year old support line is where the asset is currently priced.
As of yesterday, we have broken the supply line to the upside.
Now, to me, this does not mean buy immediately, but it does mean we need to monitor the price action for the next month or so. Any confirmation of a breakout whether that be a backtest or a pump may indicate that the bottom is in.
Price target for next ETH bull-run is $7,000 - $12,000+.
Don't believe me? That's okay, who buys crypto going into a telegraphed recession anyways?
This post is for clout so I can flex on my friends two years down the line at the top of the bull cycle 😁
All the best,
dysonring2050

Eth biasEth broke structure upward and tested the fvg below and I confirm the buy with a sweep and bms on the 4 hours so am actually waiting for a deep retracement to that my level then it's a Christmas pump

ETH/USD LONGHi everyone!
Hope you all are having a great trading week. Posting a trade from 2 days ago for ETH.
We were reaching a supply level of $1360 by the end of NY session and considered LONGS for beginning of Asian session and further.
ETH first grabbed liquidity below $1360 levels and then created a Break of Structure pattern by tapping $1400 level, retracing after to our point of interest at $1370.
Trade entered at $1372 with a RR of 8.5 to 1. Stops were placed safely below last point of demand and our target was highs of previous NY session at $1530.
Total time in a trade 21 hrs, TP triggered at $1530.
Please follow to stay up to date with our trade ideas!
Cheers,
Cryptonyx Capital

Ethereum roadmap was staring at us all this timeWhat is it we value? Innovation. Originality. Novelty. But most importantly timeliness. I fear you may be too late, my confused, unfortunate friend.

ETHERIUM 4HOURLY NEAR FUTURE ANALYSISTechnical Analysis Summary
ETH/USDT
TREND ANALYSIS
We have 2 Downtrend in red color (Internal and Long Term).
We have 1 Uptrend in green color (Internal Trend)
Be careful trends need to be modified when broken to the new peaks(Downtrend) and lows (Uptrend).
FUTURE PREDICTIONS
We have many resistance and support levels that I have mentioned above.
I use thickness as an indicator of strength of levels (ONLY FOR VISUALS).
White levels Levels are levels from my past ideas published or levels that were respected from the past.
Good luck everyone, stay safe!
If you need help don't hesitate to send me a message or comment
If you find this content beneficial please don't forget to LIKE and FOLLOW
Trading Involves High Risk
Not Financial Advice
Exercise Proper Risk Management

ETH to $70,000 (£56,834) by 2030- ETH isn't going anywhere, QNT, XDC and many other amazing projects are built on the ETH network.
- ETH is massively involved with this new world agenda along with BTC.
- I personally own 0 ETH because I hold QNT which will do much better than ETH long term, but they are both winners.
- In the 2017/2018 BULLRUN ETH hit the 89 FIB extension, so the 55 FIB extension will be easily achievable, also remember we will have utility bull-runs now as big banks and institutions are ready pump up crypto, however we need regulations first and all the shit coins need to go.
- NOT FINANCIAL ADVICE.

ETH PRICE POJECTION TILL SUNDAYHere's my price projection till Sunday 29 of may.
Don't hesitate to subscribe to follow my next projections.
-Frank
Ethereum in Range, ETH Bulls Stand a Chance above $2.7kPast Performance of #Ethereum
Ethereum is comparatively resilient against bears, soaking the selling pressure as per the developments in the daily chart. ETH prices are steadying above primary support, flashing with last week's lows at about $2.7k. Even so, sellers are in control from a top-down approach. ETHUSDT remains within a bear breakout formation, struggling to stay afloat and snap back to the primary trend established in March 2022.
#Ethereum Technical Analysis
ETH prices are under significant selling pressure. Overall, sellers are in control, unwinding gains posted in March. Buyers haven't reversed the steep losses of April at spot rates. Notably, ETHUSDT is within last week's trade range, with conspicuous bear bars of April 26 and 30 setting the trend. As ETH prices move horizontally, traders can trade with the primary trend, unloading every pullback provided prices are below $3k. A break below $2.7k and last week's lows may force another wave of dumping towards March 2022 lows of $2.3k. On the flip side, if ETH bulls break away from the current sideways movement above $3k, prices could soar to $3.5k—or better. This breakout would endorse the bulls of March, providing timely entries for aggressive traders to ride the wave.
What to Expect from #ETH?
Prices have support from around the 78.6 percent Fibonacci retracement level of the March 2022 trade range. A breakout above $3k would relieve optimistic buyers angling for resumption and a lift-off towards $3.5k.
Resistance level to watch out for: $3k
Support level to watch out for: $2.7k
Disclaimer: Opinions expressed are not investment advice. Do your research.

ETH will explode soonDon't be fooled by the fake breakdown, there is a huge move in the works and we should see Eth make a huge move towards the upside very soon

Ethereum i'll buy if price breaks range and retest weekly vwapEthereum I'll buy if the price breaks range and retest weekly vwap
Friends, It's so important for the price to break the range up and close the 4-hour candle above range. That will confirm the swing rise. ON a pullback we'll take a trade.

ETH is about to have a nice jumpEth is about to make a nice run towards the upside, our first price target is around $3323. I am also confident that this is going to start he next bull run as well. watch this space

ETHUSDT ANALYSISEth price is currently trading in a chanel in D1 time frame but if you zoom in to H4 time frame you will see that a bearish flag inside the channel with a technical price target of 2845 and the support line for the channel come between 2750 depending on how long we take to approach the channel as price increases across the channel.

ETH - CYPHER HARMONIC PATTERN?Hey guys, hope everyone is good. I have something new here, a HARMONIC PATTERN
Harmonic patterns involve more than just geometric shapes. They also follow strict "rules" measured by FIBONACCI LEVELS
There are several types of harmonic patterns including Gartley, Butterfly, Bat, Cypher, 3 Drives, Crab, and more.
This particular pattern is called the CYPHER PATTERN It is a REVERSAL PATTERN and usually occurs near strong trend reversals.
It's said that CYPHER PATTERNS have a higher success rate than any other HARMONIC PATTERNS but are rarely found on the charts.
The CYPHER PATTERN can be bullish, or bearish. The pattern in this chart is considered a bullish pattern. The buy order should be at point "D" with a stop loss below point "X"
As I mentioned above, There are "rules" (requirements) that need to be met in order for the CYPHER PATTERN to be considered VALID .
X-A > Line X-A is an IMPULSE LEG
A-B > Line A-B is a RETRACEMENT of line X-A. It MUST retrace to 0.382-0.618 (candle close)
B-C > Line B-C is another leg up. "C" MUST end up between the 1.272-1.414 FIBONACCI EXTENSION LEVEL of impulse leg (LINE X-A)
C-D > Line C-D is a RETRACEMENT of X to C. Line C-D MUST touch the 0.786 RETRACEMENT LEVEL
The chart shows a possible CYPHER PATTERN trade setup. Lines X-A, A-B, and B-C are all VALID, therefore IF line C-D touches the 0.786 RETRACEMENT OF X to C, we should have a high risk/reward trade setup.
For this to be considered a VALID HARMONIC PATTERN, all of the "rules" above MUST be met.
So far, the first 3 rules have been met. The only thing that is required now is for ETH to retrace to the 0.786 of X-C which is between $2200 - $2300
If the pattern CONFIRMS to be VALID, the TARGET is set at the 0.382 RETRACEMENT of X to C which is approximately $3700 (A potential gain of around $1500) Stop loss order just below "X" ($1690)
If ETH does NOT retrace to the 0.786 of X to C, The pattern is INVALID .
Because of the strict requirements for the CYPHER PATTERN and other HARMONIC PATTERNS, they do not occur as often as other chart patterns.
TO BE CLEAR, THIS IS A POSITION "NEUTRAL" CHART. IT IS AN ANALYSIS & TUTORIAL. ETHERIUM WOULD HAVE TO DROP TO $2230 FOR THIS IDEA TO BECOME VALID.
Just sharing some interesting things I've learned and can make use of. Hope you guys like this and find it interesting. If so check out my other Ideas. I'll leave my most recent BTCUSD chart link below.
Please LIKE, FOLLOW, SHARE, and COMMENT if you wish. Sometimes I'm busy but I do respond mostly.
*** THIS IS NOT INVESTMENT ADVICE This is just an idea and based off of my research and experience learning and trading cryptocurrencies. Always do your own research before trading or investing***

Ethereum is about to make a huge move to the upsideIn this trend analysis, I show that Ether is close to having a huge breakout with a price target of around $3783. I am expecting us to reach this target by the 3 of April
