ETHEREUM is stacking up to fly! BINANCE:ETHUSDT ETHEREUM got a lot going for it right now. It's the backbone of a huge chunk of the crypto world, especially with all the DeFi and NFT stuff happening. Plus, there's always talk about big upgrades that could make it even better.
Right now, Ethereum's trading around $2,500, but some experts expect that it could climb way higher, maybe even past $8,000, if everything goes right.
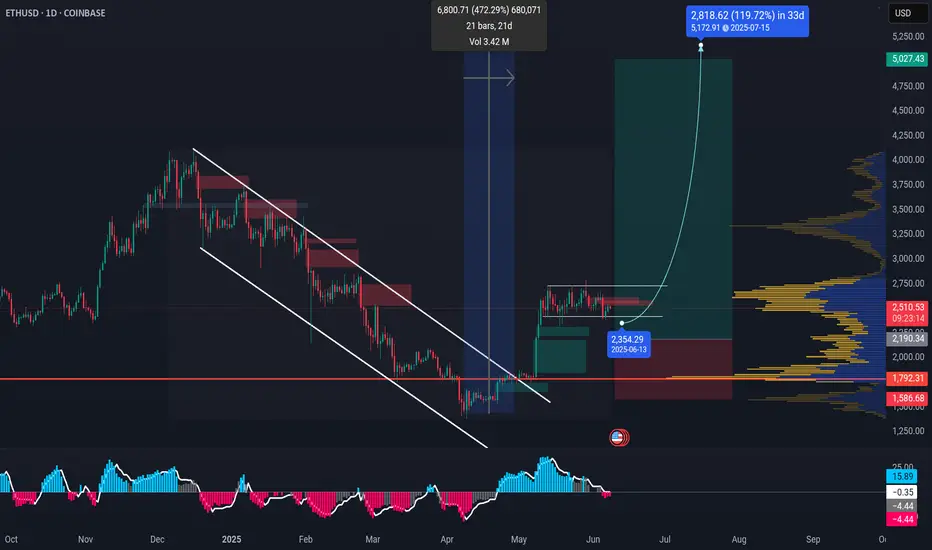
That aside, I personally think $5,000 is achievable and to happen soon. It clearly broke out of the months long downtrend channel and with momentum. There's a lot of hate for ETH just for being expensive. But, let's be real, is not the 2nd biggest player in the market for nothing.
Let me know what you think? Open to counter ideas!
BINANCE:ETHUSDT
Ethreum
Technical analysis of ETH contracts (outlook for next week)Technical analysis of ETH contract on June 7 (next week outlook):
After the price rose last year and hit the high point of 4170, the weekly level has been fluctuating downward for four consecutive months this year. After the price rose sharply in May, it has maintained a high-level oscillation trend. The K-line pattern is single Yin and single Yang, and there is no signal of breaking; the daily level is still oscillating in the box, with a high point of 2780 and a low point of 2300; although the price is below the moving average, the attached indicator is dead cross, but the strength and continuation are the current problems; then the advantage of price decline in a short time is relatively large, the current high pressure of the four-hour chart and the hourly chart is near the 2533 area, and the low is near the 2450 area; in general, next week, before the price has no obvious break and trend signal, it is still necessary to follow the trend and still treat it as a range of fluctuations;

Is Ethereum Back In Business? A Confluence of Bullish Patterns Is Ethereum Back In Business? A Confluence of Bullish Patterns, Brutal Liquidations, and Fundamental Strength
The cryptocurrency market is a theater of perpetual drama, a relentless cycle of fear and greed, innovation and volatility. In this unforgiving arena, Ethereum, the world’s second-largest digital asset, has once again captured the spotlight. After a period of underperformance that left investors questioning its momentum, a confluence of technical signals, market-shaking liquidations, and strengthening fundamentals has ignited a fierce debate: Is Ethereum truly back in business? The answer is not a simple yes or no but a complex narrative woven from bullish chart patterns, the chaotic fallout of political spats, and the quiet, inexorable growth of its underlying network.
At the heart of the bullish thesis lies a classic technical analysis signal: the Morningstar candlestick pattern. For traders and analysts who scour charts for clues about future price movements, the appearance of a Morningstar on Ethereum's monthly chart is a development of profound significance. Simultaneously, the market has been violently shaken by an $800 million liquidation event, a brutal culling of leveraged positions in both Bitcoin and Ether, reportedly triggered by a public feud between political and tech titans Donald Trump and Elon Musk. This event serves as a stark reminder of the market's fragility and its susceptibility to external shocks.
Yet, beneath this surface-level chaos, a different story is unfolding. On-chain metrics point to a network that is not just surviving but thriving. Institutional interest is surging, evidenced by substantial inflows into newly approved spot Ethereum Exchange Traded Funds (ETFs). Whales, the market's largest players, are sending mixed but largely accumulative signals. And technological upgrades continue to enhance the network's scalability and utility. This article will delve into these competing narratives—the hopeful story told by the Morningstar pattern, the cautionary tale of massive liquidations, and the quietly confident hum of Ethereum's fundamental growth—to paint a comprehensive picture of where the pioneering smart contract platform stands today.
The Morningstar's Dawn: A Technical Harbinger of a Bullish Reversal
In the lexicon of technical analysis, candlestick patterns provide a visual language for market sentiment. The Morningstar is one of the most revered bullish reversal patterns, a three-candle formation that often signals the end of a downtrend and the beginning of a new upward climb. Its appearance on a high-timeframe chart, such as the monthly chart for Ethereum, carries significant weight, suggesting a major shift in market psychology from bearish despair to bullish optimism.
To understand its power, one must first understand its structure. The pattern consists of three distinct candles appearing after a prolonged price decline. The first is a long bearish candle (typically colored red or black), which confirms the continuation of the downtrend and reflects the sellers' firm control. The second candle is the "star" of the pattern—a small-bodied candle that can be either bullish or bearish. This candle often gaps down from the previous one, indicating a moment of acute indecision in the market. The selling pressure that characterized the first candle has waned, but buyers have not yet seized full control. It represents a point of equilibrium, a pause where the prevailing trend loses its momentum. The third and final candle is a long bullish candle (typically green or white) that closes well into the body of the first bearish candle. This final candle is the confirmation; it signifies that buyers have decisively taken over, overwhelming the sellers and initiating a reversal.
The psychology behind the Morningstar pattern is a story of a power shift. The long bearish candle shows sellers are confident. The small middle candle reveals that confidence is cracking; a battle for control is underway. The final strong bullish candle declares the buyers as the victors, signaling that the path of least resistance is now upwards.
Recently, several crypto analysts have highlighted the formation of this very pattern on Ethereum’s monthly chart. After a period of consolidation and price decline, the emergence of a Morningstar suggests that the bottom of the recent downtrend may be in. Analysts see this as a macro reversal signal, a technical foundation for a potential rally. Some have set initial price targets around $3,300, viewing the current resistance levels as temporary hurdles that will likely be broken in the face of this powerful bullish formation. When combined with other indicators, such as trading volume, which ideally should increase during the formation of the third candle, the Morningstar provides a compelling technical argument that Ethereum is gearing up for a significant move higher. While no technical pattern is infallible, its appearance on a macro scale has undeniably injected a strong dose of optimism into the market, suggesting that Ethereum’s period of slumber may be coming to an end.
The $800 Million Purge: A Tale of Liquidations and Political Tremors
Just as technical analysts were celebrating the bullish omens on the charts, the market delivered a brutal reminder of its inherent volatility. A massive liquidation event, totaling over $800 million and by some estimates approaching $1 billion, swept through the cryptocurrency markets, disproportionately affecting leveraged traders in Bitcoin and Ethereum. In a span of just 24 hours, hundreds of thousands of traders saw their positions forcibly closed, a cascade of selling that sent prices tumbling.
Liquidations are the boogeyman of leveraged trading. When a trader uses borrowed funds (leverage) to amplify their position, they must maintain a certain amount of collateral. If the market moves against their position and their collateral falls below a required threshold, the exchange automatically closes the position to prevent further losses. This forced selling creates a domino effect. As prices fall, more long positions hit their liquidation points, triggering more selling, which in turn drives prices down further, liquidating even more positions. This is a liquidation cascade, and it can lead to rapid and violent price drops.
Recent data showed that long positions accounted for the overwhelming majority of these liquidations, indicating that the market was caught off guard by the sudden downturn. Exchanges like Bybit and Binance were at the epicenter of this financial storm, with Bybit alone reportedly accounting for nearly $354 million in liquidations. The largest single liquidation order was a multi-million dollar position, underscoring the high stakes involved.
What triggered this sudden market panic? Many analysts pointed to an unlikely source: a public and increasingly acrimonious feud between former U.S. President Donald Trump and Tesla CEO Elon Musk. The dispute, reportedly stemming from disagreements over a major tax and spending bill, spilled out onto social media, creating a storm of uncertainty that rattled investors. In today's interconnected world, high-profile clashes between powerful figures can have an immediate and tangible impact on financial markets, particularly on assets perceived as "risk-on," such as cryptocurrencies.
The public fallout was seen as a destabilizing event, injecting political uncertainty into an already fragile market. The fear was that the conflict could have broader economic implications or affect the regulatory landscape for technology and digital assets. This sentiment sparked a broad-based sell-off, not just in crypto but across traditional equities as well. For a market driven heavily by narrative and sentiment, the Trump-Musk tussle provided a powerful bearish catalyst, spooking investors and triggering the cascade of liquidations that sent Bitcoin and Ethereum prices sharply lower. The event serves as a crucial counterpoint to the bullish technical picture, highlighting how susceptible the crypto market remains to macroeconomic and political shocks, regardless of its own internal fundamentals.
The Bullish Undercurrent: On-Chain Metrics and Institutional Adoption
While the liquidation event painted a picture of chaos and fear, a deeper dive into Ethereum's on-chain data and ecosystem developments reveals a much more optimistic and resilient narrative. These fundamental metrics, which track the health and growth of the network itself, often provide a clearer long-term signal than the noise of short-term price fluctuations.
A Thriving and Growing Network
One of the most reliable indicators of a blockchain's long-term value is its network activity. On this front, Ethereum is showing undeniable strength. The number of unique active addresses interacting with the blockchain has been on a steady rise. Recent data shows a significant surge, with weekly active addresses surpassing 17 million, a testament to growing engagement and adoption. This isn't just speculative trading; it reflects genuine usage across Ethereum's vast ecosystem, including decentralized finance (DeFi), non-fungible tokens (NFTs), and Layer 2 scaling solutions.
Furthermore, the growth in new users joining the network is a powerful leading indicator of future demand. The rate of new address creation has been on an upward trajectory, signaling that Ethereum's value proposition continues to attract a broader audience. This organic growth is the lifeblood of any network, creating a flywheel effect: more users attract more developers, who build more valuable applications, which in turn attract even more users.
The Rise of Layer 2 and Technological Upgrades
A key driver of this network growth has been the maturation of Layer 2 scaling solutions like Arbitrum, Optimism, and Base. These networks handle transactions off the main Ethereum chain, allowing for faster speeds and dramatically lower fees while still inheriting Ethereum's security. The explosion of activity on these Layer 2s has been a game-changer, alleviating congestion on the main network and making Ethereum accessible to a wider range of users and applications.
Simultaneously, core protocol upgrades continue to enhance Ethereum's capabilities. The recent Pectra upgrade, for example, has improved scalability and further refined the network's deflationary mechanics. Since the implementation of EIP-1559, a portion of every transaction fee is "burned," or permanently removed from circulation. This, combined with the vast amount of ETH locked in staking contracts, creates a dynamic where the supply of available ETH is constantly shrinking. This principle of decreasing supply coupled with increasing demand is a fundamental recipe for long-term price appreciation.
The Arrival of Institutional Capital
Perhaps the most significant bullish development for Ethereum in recent times has been the approval and successful launch of spot Ethereum ETFs in the United States. This provides a regulated and accessible on-ramp for institutional investors to gain exposure to ETH, unlocking a potential wave of new capital. The early data is promising. In May 2025 alone, spot Ethereum ETFs recorded net inflows of over half a billion dollars, a sharp increase from the previous month.
This institutional validation is a powerful signal. It signifies that some of the world's largest financial players view Ethereum not just as a speculative asset, but as a foundational technology with long-term strategic value. This flow of "sticky" institutional money is expected to provide a strong support floor for the price and reduce volatility over the long run.
The Whale Watch: Accumulation and Confidence
The behavior of "whales"—large holders of Ethereum—provides another crucial, albeit sometimes conflicting, layer of insight. On one hand, there have been reports of significant accumulation by these large players. Data shows massive transfers of ETH from exchanges to private wallets, a classic sign of long-term holding, as it reduces the immediately available supply for selling. One notable transaction involved Galaxy Digital moving hundreds of millions of dollars worth of ETH into a private wallet, suggesting strong institutional confidence. Over the past month, data from on-chain analytics firms has shown that whale wallets have increased their holdings, while retail holdings have slightly decreased, a pattern often seen before a bullish market run.
However, the picture is not entirely one-sided. There have also been instances of long-term whales selling off portions of their holdings, contributing to short-term price drops. This reflects the diverse strategies among large holders. Some may be taking profits, while others are positioning for a long-term hold. Despite the mixed short-term signals, the broader trend appears to be one of accumulation and a net outflow of ETH from exchanges, which is a fundamentally bullish indicator. With exchange balances hitting seven-year lows, the potential for a supply squeeze is becoming increasingly real.
Conclusion: Navigating the Storm Towards a Bullish Horizon
So, is Ethereum back in business? The evidence suggests a resounding, if complex, "yes." The current market environment is a fascinating juxtaposition of short-term turmoil and long-term strength. The public spat between Trump and Musk, and the subsequent $800 million liquidation event, underscore the market's vulnerability to sudden shocks and the perils of leveraged trading. These events serve as a healthy dose of caution, reminding investors that the path forward will undoubtedly be volatile.
However, when we look past the immediate noise, the underlying picture is one of robust and accelerating health. The Morningstar pattern on the monthly chart provides a powerful technical signal that a macro trend reversal is underway, suggesting that the recent period of bearish sentiment has exhausted itself. This technical optimism is strongly supported by fundamentals. Ethereum's network is growing at a remarkable pace, fueled by the success of Layer 2 solutions and continuous protocol improvements that enhance its scalability and economic model.
The most compelling evidence, however, comes from the demand side. The launch of spot Ethereum ETFs has opened the floodgates for institutional capital, a structural shift that will likely define Ethereum's market for years to come. This, combined with the steady accumulation by whales and a shrinking available supply due to burning and staking, creates a powerful bullish cocktail.
Ethereum is navigating a perfect storm of conflicting signals. The violent waves of short-term liquidations and political drama can be disorienting. But beneath the surface, the deep currents of network growth, technological innovation, and institutional adoption are flowing strongly in one direction. For investors who can look beyond the immediate horizon, the story told by Ethereum's fundamentals, supported by classic bullish chart patterns, is not just one of being "back in business"—it's a story of a platform solidifying its position as a cornerstone of the decentralized future.

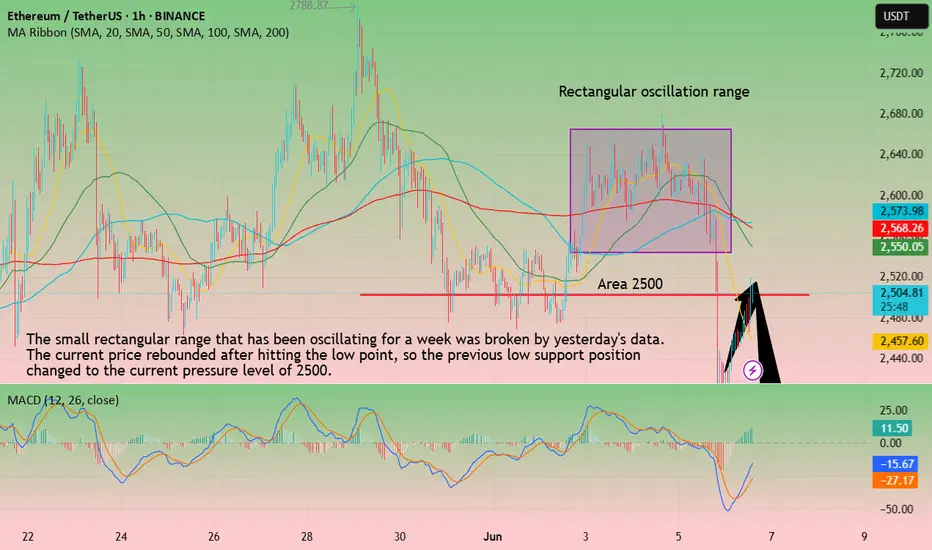
ETH-----Sell around 2500, target 2400 areaTechnical analysis of ETH contract on June 6:
Today, the large-cycle daily level closed with a large negative line yesterday, and the K-line pattern was still a single negative and single positive. The price was below the moving average. The attached indicator was dead cross. The bottom support position of the rectangle below was in the 2300 area. This is what we should focus on next week. Only when this position is broken, the overall downward trend will be formed and move downward; the short-cycle hourly chart maintained a range oscillation trend for a week. Under the stimulation of yesterday's data, it continued to break downward. It is necessary to pay attention to a top-bottom conversion pattern. The previous low support of 2500 has turned into the current pressure level.
ETH short-term contract trading strategy:
Short in the 2500 area, stop loss in the 2550 area, and the target is the 2400 area
ETH-----Buy around 2620, target 2675 areaTechnical analysis of ETH contract on June 5:
Today, the large-cycle daily level closed with a small positive line yesterday, the K-line pattern continued to rise, the price was above the moving average, the attached chart indicator dead cross shrank, and the overall trend fell into a small range of shocks, but it should be noted that the price continued to consolidate at a high level, and the retracement had no strength and continuation. After each retracement, it was accompanied by a rapid rise or even a break, so there is a high probability that it will rise after consolidation; in terms of the short-cycle hourly chart trend, the price continued to break the high, although the time point is wrong, but it can be seen that the low support of the retracement is moving up, the current K-line pattern is continuous, the attached chart indicator dead cross shrank, so there is still a demand for rising within the day.
ETH short-term contract trading strategy:
Buy at the current price of 2620 area, stop loss at 2590 area, and target at 2675 area;

No impulse here is random. Each wick is a message.ETH has been rotating around inefficiency — not in confusion, but in setup.
This isn’t sideways. It’s structured accumulation just beneath premium OB.
Here’s the narrative:
Price swept the local low, then tapped the 2,619.06 level — a key reaction zone
Above us: a 15M OB at 2,639.07 — this is where early longs will either get paid or punished
Below: 2,592.78, the real demand block — if we break down, that’s the last hold before structure flips
The volume profile shows clear interest at mid-range — meaning Smart Money isn’t chasing price. It’s absorbing.
Expectations:
Hold above 2,619 → target 2,639 and reevaluate
Failure below 2,592 → rotation opens into inefficiency
Execution plan:
Clean long above 2,619, invalidation below 2,592
Short only if price flips 2,639 and fails to hold it on the retest
This is a reaction zone — I’m not chasing. I’m positioned.
Don’t confuse consolidation with indecision. Smart Money’s already placed.
More trades mapped like this — before they move — are in the profile description.

They bought the dip. I anticipated the shift.This ETH setup didn’t require hopium — just structure, volume, and timing.
The chart respected every level I mapped days ago. And now? Price is setting the table again.
We swept liquidity below 2488.11 — textbook turtle soup into a bullish STB on the 1H.
Then price ripped clean into the 4H OB and tapped 2649.12 — the fib extension target. That’s not retail momentum. That’s interbank delivery at work.
Now we’re pulling back. And here’s where it gets clear:
The 0.5–0.618 zone sits between 2586.56–2571.80
It overlaps with the 1H STB zone — a demand pocket from the origin of the expansion
If price consolidates above 2550.78 (the 0.786) and flips 2564.83 again, I expect continuation back toward 2618.32 and 2648.46
If we sweep 2524.01 without reaction — then it’s a deeper rotation
This isn’t a “buy support” setup. This is a model-driven continuation based on structure and internal range logic.
Entry bias is valid above 2580. Below 2524 — it’s invalidated.
I don’t guess entries. I forecast structure.
More models and trades? Check the profile description. Precision lives there.

Ethereum Is Not DEAD ... WHY ??? Because BlackRock Says SoMartyBoots here , I have been trading for 17 years and sharing my thoughts on ETH here.
ETH Is Not Dead — It’s Just Getting Started
Narrative of ETH being “dead” is short-sighted. Here’s why:
1. Ethereum Is Still Younger Than Bitcoin
• Ethereum launched in 2015, a full 6 years after Bitcoin.
• BTC had over a decade of network effect, price discovery, and global trust before ETH even got its first DApp.
• On the charts, ETH still has room to mature, just like Bitcoin did pre-2020.
• Fundamentally, Ethereum is still evolving — from PoW to PoS, scaling solutions (L2s), and now modular chains.
You’re not late to ETH — it’s just halfway through the marathon.
⸻
2. BlackRock’s BUIDL Fund Is a Massive Signal
• The BlackRock BUIDL fund, launched on Ethereum, already has $3B in AUM — and it’s growing.
• It shows that legacy institutions aren’t ignoring ETH — they’re building directly on it.
• This isn’t speculative hype. It’s tokenized real-world assets backed by the biggest asset manager on earth.
• Smart money is moving into ETH, not away from it.
The narrative is shifting. Institutions aren’t betting on meme coins — they’re betting on Ethereum rails.
Final Thought
ETH is not dead. It’s undergoing the same early-stage skepticism BTC did in its early years. With foundational upgrades and institutional validation, ETH might be the most undervalued top asset in the market today.
⸻
Watch the chart. Track the fundamentals. And don’t sleep on ETH.
#Ethereum #ETHUSD #Crypto #fundamentals #BUIDL #BlackRock #OnChainData #NotDead #TradingView
Watch video for more details

Price doesn’t chase liquidity. It engineers it.ETH is mid-delivery — not in trend, not in reversal — but in execution. This is where most get faked out. I’m just reading the structure.
Here’s the play:
We’ve tapped into the FVG 4H, reacting from an inefficiency left by the last aggressive selloff
Above that, the BPR 4H marks a supply zone engineered for reaction, not breakout — that’s where early longs will get tested
Fib levels are clean: price is hovering around 0.5 (2,623.76), with clear tolerance for a dip into the 0.618–0.786 (2,584–2,528)
Two paths from here:
A clean push into 2,662.89 → 2,711.32, possibly even sweeping into 2,789.59, followed by rejection from premium imbalance
A deeper pull into OB 4H at 2,457.92 before any real mark-up begins
Execution mindset:
Intraday longs are valid as long as we hold above the 4H OB
HTF liquidity targets sit above 2,660 — but the smarter entries were already taken lower
If we reject the BPR without breaking 2,662, I expect a controlled drop back into discount
This isn’t a breakout. It’s a rebalancing. You don’t follow price. You align with its logic.
For more setups with structure, not noise — check the account description.

ETH/USDT 4H Chart Analysis – Bullish Continuation with Profit You're currently in a solid long position from 2,476.60, and with the price now at 2,537, your unrealized P&L shows strong gains (+$6,322.66). The technicals support your trade with the following highlights:
📊 Key Technical Insights:
Entry Zone: 2,476 – 2,488 (ideal long from OB + 0.786 fib retrace)
OB 4H Supply Target: 2,616.99 – potential area of resistance
Current Price Reaction Zone:
2,550 tapped and acting as interim resistance
Midterm pullback expected toward 2,514–2,490 before another leg up
🎯 Targets:
TP1: 2,550 (hit)
TP2: 2,616.99 (next key resistance/OB)
TP3: Trail to 2,660+ if momentum sustains
🛑 Stop-Loss Consideration:
Below 2,474 = invalidation of structure reclaim
🔁 Possible Scenarios:
Continuation to OB 4H
✔️ Breaks and holds above 2,550
✔️ Momentum push to 2,616
Retest Before Push
🔁 Pullback to 2,514 or 2,488 zone
🔁 Reaccumulation for next move
Failure Risk
❌ Rejection from 2,550–2,560
❌ Break below 2,474 = setup invalidated
📌 “Strong move off the lows with excellent risk-reward. Watch OB 4H at 2,616 closely for next decision zone.”

Pending for a big moveEthereum (ETH) has been trading within a sideways range since May 10, fluctuating between $2,400 and $2,700.
Recently, it has established a new support level around $2,500, suggesting that higher lows are forming.
A confirmed breakout requires a daily candle close above the $2,700 resistance level (200Days MA).
DYODD

ETH/USD Bullish PlanGoing long if 2550 breaks and sustain, holding till 2630 range. Exit and re-enter after pull back .Holding till 2666 only it BTC acts well.

ETH 4H Setup – Double Tap Reversal + Fib TargetsEthereum has printed a double bottom wick rejection just above the 2,468 level and is now attempting a breakout above the local range high. Price has reclaimed structure, indicating potential momentum toward key fib resistances.
Key Technical Zones:
Support Zone: 2,468 – local double bottom (0% fib)
Breakout Level: 2,544 (0.236 fib)
Targets:
TP1: 2,590
TP2: 2,628
TP3: 2,666 (0.618 fib / likely exhaustion zone)
Scenario Outlook:
🟩 Bullish Path:
Strong rejection from 2,468 confirms demand
Push through 2,544 unlocks path to mid 2,600s
Trend continues if macro holds above 2,500
🟥 Bearish Reversal:
Rejection near 2,590–2,666
Bearish engulfing back below 2,507 invalidates this long setup
Could revisit 2,468 and break to 2,440s
Play Idea:
Entry: Reclaim 2,544 with confirmation
SL: Below 2,496
TP1: 2,590
TP2: 2,628
TP3: 2,666
📌 “ETH bulls defend the low — the battle now shifts to mid-range fib control.”

The wick was the test.Ethereum just kissed the 1.0 fib at $2475.33, tapping into a local demand pocket. That sweep cleared weak longs and set up a cleaner drive back into inefficiency.
What’s happening?
→ ETH is targeting the 1H Fair Value Gap (FVG) around $2512–$2522.
→ $2500 zone = critical reaction level.
→ Volume profile confirms buyer interest above $2480.
Entry Zone: $2480–$2490
SL: Below $2475 swing low
TP1: $2512.75
TP2: $2550.14 (liquidity sweep)
Bias: Bullish while above $2475
Why it matters:
ETH rejected the lows and reversed with structure + timing.
If it reclaims the FVG → it reclaims the narrative.

ETH is compressing for one reason — delivery.This isn’t just sideways chop. This is coiled intent.
ETH is sitting on top of the 0.618 fib at 2,496.25, after a controlled retracement from 2,546.84. We’ve printed a minor sweep below local lows into a high-volume shelf — exactly where Smart Money wants to reaccumulate.
A 1H Fair Value Gap is forming between 2,505–2,515. That’s the inefficiency that price is magnetized to. It will either reject there (distribution) or displace above it and flip the narrative bullish.
The decision is not in guessing direction — it’s in watching how price interacts at the FVG.
If we break and hold above 2,527.52 (0.236), the draw becomes clear: 2,549.69 and beyond.
Execution focus:
🔄 Current range: 2,496–2,505 (PD array and FVG base)
🔺 Bullish trigger: reclaim 2,515.57 and hold
🎯 Target: 2,549.69
🔻 Bearish scenario: rejection at FVG → continuation to 2,464.97 (final sweep zone)
Let others predict.
I just read the imbalance — and position accordingly.

$ETH Analysis — Correction Incoming?Summary:
After a strong ~100% rally in ETH, price hit a major resistance zone near $2734.78, triggering a significant sell-off, likely driven by algorithmic profit-taking. Now, the market is poised for a healthy correction before another potential leg up.
📉 What's Next for Ethereum?
🔍 Expecting a Correction of 7% to 25%
Based on technical structure and indicator behavior, ETH is likely to retrace to one of the two key zones:
✅ Primary Buy Zone ("Most Likely"): $2297.20
This zone aligns with previous structure support.
It’s where the price may form a higher low and resume its upward trend.
Ideal for opening a swing long with a tight risk-reward ratio.
🔥 Deeper Correction Opportunity: $1779.58
While less likely, a drop to this level would be a major long opportunity.
Aligns with historical demand and long-term support levels.
Also intersects with the yellow trendlines suggesting trend-based support zones.
📊 Why This Correction Makes Sense:
Weekly Money Flow Index (MFI) is Dropping:
MFI divergence suggests money is flowing out, weakening bullish momentum.
A trigger wave is forming, often preceding price corrections.
Algo Profit-Taking is Done:
Smart money likely exited around $2734.78 (highlighted in chart).
They’ll need to accumulate again at lower levels before the next rally.
📈 Potential Upside Targets:
If ETH respects the structure and finds support around $2297 or deeper, we could see a rally toward $3296.85 — a key Fibonacci extension and psychological level.
🧘♂️ Reminder:
No emotional entries. Let the price come to you. Trust the setup and stick to your plan.
📌 Disclaimer: This is not financial advice. Just a breakdown of my trading thesis. Always manage your risk.

ETHUSDT Breakout Watch: Bullish Momentum Brewing🧠 Chart Analysis Summary:
This chart suggests a bullish continuation is likely for ETHUSDT based on the current market structure and visual cues:
🔍 Key Observations:
Current Price Zone:
Trading around $2,574, inside a consolidation range (highlighted blue box).
Strong Supply Area Identified:
Around $2,335.93 (marked in purple) – acted as a solid demand/support zone fueling the current move.
Breakout Box:
The price is forming a rectangle pattern, indicating accumulation or consolidation before a breakout.
Bullish Projection Arrows:
Two projected paths show:
Minor dip toward the supply area followed by a bullish breakout 🚀.
Immediate breakout from the box towards resistance levels.
🎯 Target Levels:
First Target: 🟣 $2,918.70 – “possible next move”
Second Target: 🎯 $3,006.40 – strong resistance zone
🧩 Conclusion:
This setup suggests ETH may be preparing for a breakout from the consolidation zone. If bulls maintain control, we could see a rally towards $2,918 - $3,006 in the coming weeks.
Risk Tip: Watch for a fakeout if price dips below the consolidation range — especially near the $2,335 area.
🧠 Trading Tip:
Use volume confirmation and candle closes above the box to validate the breakout! 📊

ETH >>> Inverse Head & Shoulders Breakout Sets Stage for RallyHello guys!
Ethereum has formed a textbook inverse head and shoulders pattern on the 15-minute timeframe and just confirmed a breakout above the neckline. This bullish reversal formation comes after a sharp downtrend, signaling a potential shift in short-term momentum.
📌 Breakout Level: ~$2,645
🎯 Potential Target: ~$2,730–$2,750 based on the pattern height
🟦 Retest Zone: ~$2,620–$2,640
We’re currently seeing a healthy breakout followed by a possible retest of the neckline, which could offer a solid entry for continuation toward the upper boundary of the channel.
If bulls hold this structure, ETH could accelerate higher in the coming sessions.

ETH isn’t done. It’s just hunting stops.This isn’t a dump. This is preparation.
ETH swept the low into the 0.786 retracement — right where liquidity was resting. The 1H chart shows an engineered drive down into 2,490.26, just above the final inefficiency at 2,474.00. That’s the last fill zone before repricing.
Look left — we’re now sitting at the tail end of a low-volume node. Price doesn’t stick here. It reacts.
I’m watching for a shift back into the 2,503–2,512 zone, where the 0.5 retracement overlaps the 1H OB. That’s the first stop. Beyond that, 2,520.97 marks the high-volume shelf and the 0.382 retrace — the true magnet.
If ETH reclaims that zone with strength, I expect delivery back to 2,550. If not, expect one more purge below 2,474 — and then the real reversal begins.
Execution logic:
🎯 Long trigger: 2,490.26–2,474.00 sweep
🧠 TP 1: 2,512 (OB/50% retrace)
🧠 TP 2: 2,520.97–2,532 (HVA zone)
❌ Invalidation: clean 1H close below 2,474 = new range forming
This is where most traders hesitate.
I don’t guess the bottom. I wait for Smart Money to make it.

ETH/USD Technical Outlook – Key Patterns in PlayEthereum is showing key technical formations on the daily chart:
🔸 A Rectangle Range that held for months
🔸 A confirmed Falling Wedge breakout, signaling possible reversal
🚀 Immediate target is above the $3,000 level if momentum sustains.
📊 Watch for volume confirmation before entries.
This is not financial advice. DYOR ✅
#ETH #Ethereum #CryptoAnalysis #ChartPatterns #TechnicalAnalysis #TradingView #ETHUSD #Altcoins #CryptoTraders #BullishSetup

ETH on high time frame
"Hello traders, focusing on ETH, the price is currently at a critical level around $2,800, where it has made multiple unsuccessful attempts to break through. On the high time frames, the price has swept liquidity without showing any signs of reversal. This leads me to anticipate a higher price movement, with the next potential level being around $3,400."
If you need further assistance or have any specific questions, feel free to let me know!

Ethereum ($ETH) Poised for a Trend Reversal?When zooming out on the chart, a minor correction remains possible. However, if support at $2,400 holds, CRYPTOCAP:ETH could continue in an ascending channel. Buyer strength is currently weak, but a short-term correction could strengthen and improve the buying trend

They thought ETH was breaking down. I saw the setup buildingThis ETH move has nothing to do with fear. It's engineered delivery.
We swept the local range low, tapping directly into the 1.0 extension around 2,463 — right at the edge of a thin volume node. That’s where Smart Money accumulates, not where it panics.
I’ve seen this structure play out too many times:
Consolidation under an old high
Expansion that traps late buyers
Retracement right back into a 4H OB + 0.786 level (2,533 zone)
Then, manipulation meets inefficiency — and price delivers
From here, I’m expecting a move toward the first objective: 2,677. That’s the .382 retrace sitting just above a HVN and right under the 4H OB. A perfect draw. Not random — designed.
Above that, the volume imbalance between 2,677 and 2,713 becomes the magnet. Price will fill it or reject it clean — but either way, that’s where liquidity sits.
Key levels I’m watching:
🚀 Entry from OB rejection around 2,463–2,533
🎯 First TP: 2,677 / Next zone: 2,713
❌ Invalidation: 4H close through 2,463 with velocity
This isn’t reactionary trading.
This is watching price deliver exactly where it should.
Structure speaks louder than any signal group.
