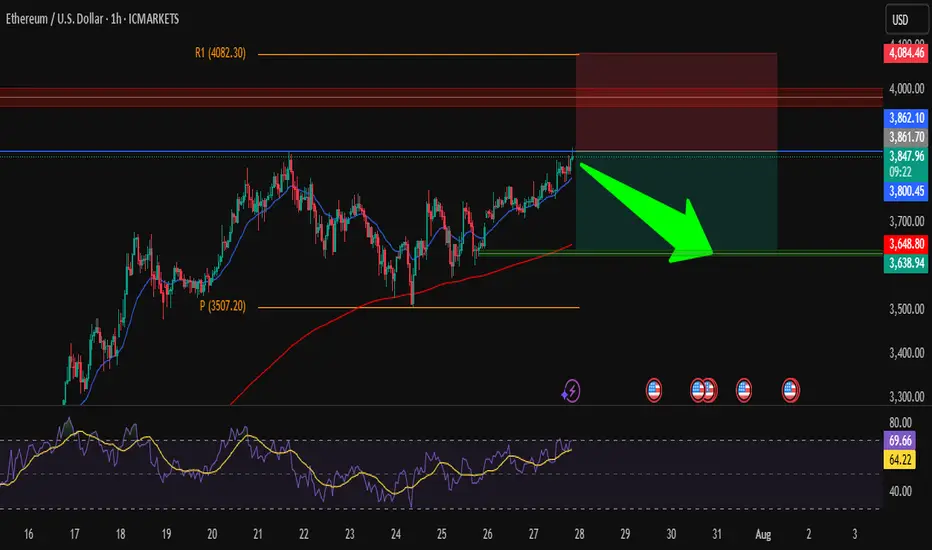
ETH/USD – Short from ResistanceHi traders ! , I opened a short position on ETH/USD as price is hitting a strong resistance zone.
Entry: 3850
SL: 4084.46
TP: 3638.94
📌 Why I took this trade:
Price is testing a strong resistance zone around 3860, RSI is overbought, and we could see a pullback toward the support area around 3640.
Nice risk/reward setup, keeping it simple.
This is just my analysis, not financial advice.
What’s your view — drop or breakout?
Ethreumidea
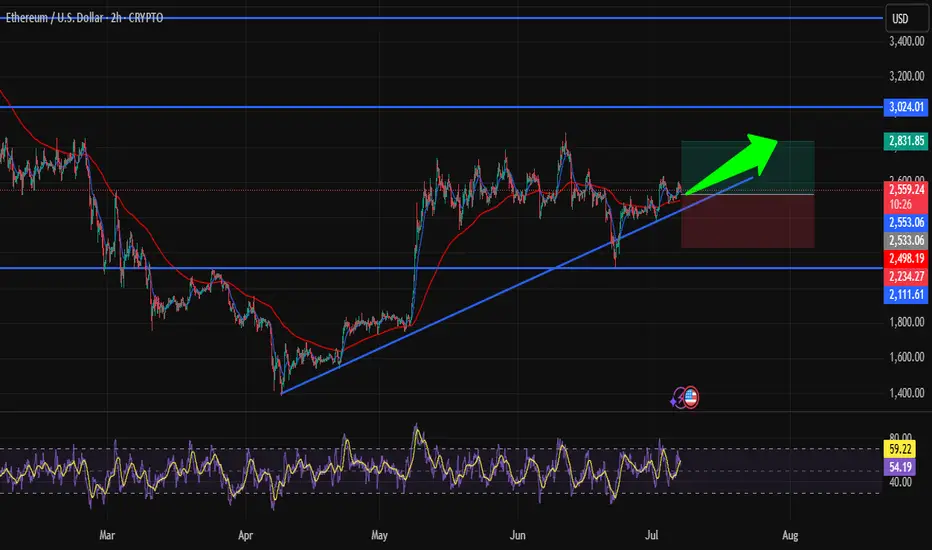
Is ETH Heading to $2800? Strategic Entry in Bullish TrendHi traders! , Analyzing ETH/USD on the 2H timeframe, price is respecting an ascending trendline and showing signs of continuation within the bullish structure:
🔹 Entry: 2555
🔹 Take Profit : 2831
🔹 Stop Loss : 2234
After consolidating above key support and retesting the ascending trendline, ETH is showing potential for a bullish continuation. The recent bounce is forming higher lows, and price remains above the 50 EMA, suggesting buyers are maintaining control.
RSI is currently turning upward from the mid-zone, signaling growing bullish momentum while still avoiding overbought conditions. The trendline has been respected several times, adding confluence to the setup.
If momentum holds, the TP around 2831 lines up with a significant resistance area from previous structure — a logical zone for price to reach in the short term.
⚠️ DISCLAIMER: This is not financial advice. Every trader is responsible for managing their own risk and strategy.
ETHEREUM READY FOR TAKEOFF?Hi traders! Analyzing Ethereum (ETH/USD) on the 1H timeframe, spotting a potential entry:
🔹 Entry: 1,840.30 USD
🔹 TP: 1,990.20 USD
🔹 SL: 1,753.70 USD
Ethereum is showing signs of a possible bullish reversal! RSI is near oversold levels, and if momentum picks up, we could see a strong move toward 1,990.20 USD. Eyes on the charts! 📈
⚠️ DISCLAIMER: This is not financial advice. Trade responsibly.

Ethereum at a Key Level! ¿Rebound or More Drop?Hi traders! 🚀 I'm entering ETH/USD at a key zone. The price is testing support at $2,098, and while the trend is still weak, the RSI at 30 suggests we're in oversold territory. 👀
Trade Details:
🔸 Entry:$2,098 ✨
🔸 SMA 200:$2,213 → strong resistance.
🔸 SMA 20:$2,167 → could act as a barrier.
🔸 TP:$2,256 🟢
🔸 SL:$1,912 🔴
Clear risk management in place—let's see if we get the bounce! What do you think? 📉📈🔥
⚠️ Disclaimer: This is not financial advice. I'm just sharing my analysis and personal experience. Every trader should do their own research and manage their risk. 📢

ETH will breakout trend line ETC/BTC LONG if you watch my ideas 2 years ago you will buy Eth for HODL.

Ethereum Bullish Flag: A High-Potential Setup! Hi, traders. I’ve just taken this trade on Ethereum as I’m spotting a clear Bullish Flag pattern on the 1-hour timeframe. After a strong drop, the price started consolidating within this channel, respecting the trendlines.
My entry is at $2,620, anticipating a breakout to the upside. My initial target is around $2,932, which aligns with a key resistance level, and my stop loss is set at $2,598, just below the support zone, where the pattern would be invalidated.
The RSI is also supporting this setup, sitting around 40, indicating there’s still room for an upward move if the breakout happens.
Will this scenario play out? Let’s see! If you have any comments or want to share your analysis, feel free to drop them below. Good luck with your trades!
Disclaimer:
This is not financial advice. Trading involves risk, and you should only trade with money you can afford to lose. Always do your own analysis before entering any trades.

ETHERUM TRADING POINT UPDATE >READ THE CHAPTIAN Buddy'S dear friend 👋
SMC Trading Signals Update 🗾🗺️ crypto Traders SMC-Trading Point update you on New technical analysis setup triangle 📐 patterns chart 📉📈 I expect if breakout one said that entry open. Logn or short trade 3400+ if breakout of it more Bullish trend 3744) if breakout 3135) more Short trend 2923)
Key resistance level 3500 + 3600 + 3744
Key support level 3192- 3130 - 2923
Mr SMC Trading point
Support 💫 My hard analysis setup like And Following 🤝 me that star ✨ game 🎮

ETH/USD Analysis: Trading Opportunity in Real TimeHello, traders! Today, I'm testing some premium indicators on TradingView for the ETH/USD pair with a 1-hour timeframe. 🚀 I'm using tools like the Support & Resistance Matrix, Market Prediction Indicator, and Trend Navigator to find the best opportunities.
📌 Trade Details:
Entry: $3,311.07 (latest signal).
Take Profit: $3,400.00 (projected resistance zone).
Stop Loss: $3,237.44 (key support zone according to the indicators).
The Trend Navigator is still showing a bullish trend, and even though I’ve already taken the latest signal, there’s still time to analyze this opportunity! 📈 The projection indicates a potential upward movement, and we are well-positioned to take advantage of it if the price maintains this momentum.
🔥 My analysis: If we respect the blue trend line and hold the nearby support, the target is achievable. But always remember to manage risk and adjust your stop loss to protect capital.
What do you think of this entry? Leave me your comments, and don’t forget to like for more trading content! 🎥✨"

Panic Sell Is Over! Ethereum ETH Will Reach $6000!Hello, Skyrexians!
Last couple of days were difficult for all crypto bulls. While Bitcoin suddenly dropped to GETTEX:92K altcoins bleed much more because of BTC Dominance pump. The main altcoin BINANCE:ETHUSDT lost more than 20% and caused a huge panic. Yesterday's candle closed promising, but if this nightmare is over or our portfolios continue melting in the upcoming days?
Let's take a look at the daily time frame. Here we can see the clear Elliott wave structure. Large wave 1 has been finished with the red dot at the top and after that we have seen this dump in the wave 2. You can tell me that wave 2 is the very ugly, but this is the specific shape of irregular
ABC.
This drop has been stopped exactly at 0.5 Fibonacci. Moreover we have seen the green dot on Bullish/Bearish Reversal Bar Indicator . As always, alerts from this indicator are automatically replicated on my accounts. You can find the information in our article on TradingView . For me it's very strong confirmation that correction is over and wave 3 is about to happen. Wave 3 has the target at 1.61 Fibonacci level equals $6200. See you there!
Best regards,
Skyrexio Team
___________________________________________________________
Please, boost this article and subscribe our page if you like analysis!

What do Ethereum fans think ? TM : 1hHello dear traders. You can see two areas on the chart, you can enter the position depending on the sale and buy area. And I made a serious decision to share the important areas of my personal strategy for free if supported.

ETHUSD Head To $2868.18Major breakout on the daily chat. I used textbook measurements to find the profit target and after is all said an done I'm getting a potential profit target of $2868.18
its moving slow but steady in towards its profit target.

$ETH SIGNAL +500 PIPS & RUNNING!$ETH has been in a bear market since last year in NOV. we will see a big drop after the merge but until then it could retrace and test the 1750 area before the merge> we are still bearish and will continue to look for sells only!

ETH/USDT - Recovery Scenario - 22.12.21Hello Traders!
ETH continues to move in an uptrend.
The price has corrected into the $3700 - $3970 buy zone and tested the MA100 on the daily timeframe.
There was a new announcement this week about ETH 2.0 launching soon and support for Arbitrum's layer-2 solution, which will increase network speed and significantly reduce transaction costs.
During the market correction, some of the big players were actively buying ETH. The reason for that is the switch from Proof of Work protocol to Proof of Stake with the launch of ETH 2.0. In order to become a validator of the network, you will have to buy and hold ETH, instead of the old video card mining.
All of these updates will serve as a strong foundation to support the price along with major fund buys.
We can start to accumulate a medium-term position between $3800 and $4100, and increase purchases after the price moves beyond the $4372 resistance level
We should close the position on a stop-loss after the price leaves under the support level of $3325
The profit taking targets will be the Fibonacci levels
$4664
$5195
$5726
$6258
Part of the position can be held in expectation of new levels of $8000 and $10000
Good luck and watch out for the market
P.S. This is an educational analysis that shall not be considered financial advice

ETH/BTC - 100%! Congratulations to everyone!On April 21, I told you about this pair. Now the price has gone up 100%. Write in the comments or u bought it?
And write in the comments all your questions and instruments analysis of which you want to see.
Friends, push the like button, write a comment, and share with your mates - that would be the best THANK YOU.
P.S. I personally will open entry if the price will show it according to my strategy.
Always make your analysis before a trade
