Ethreumlong
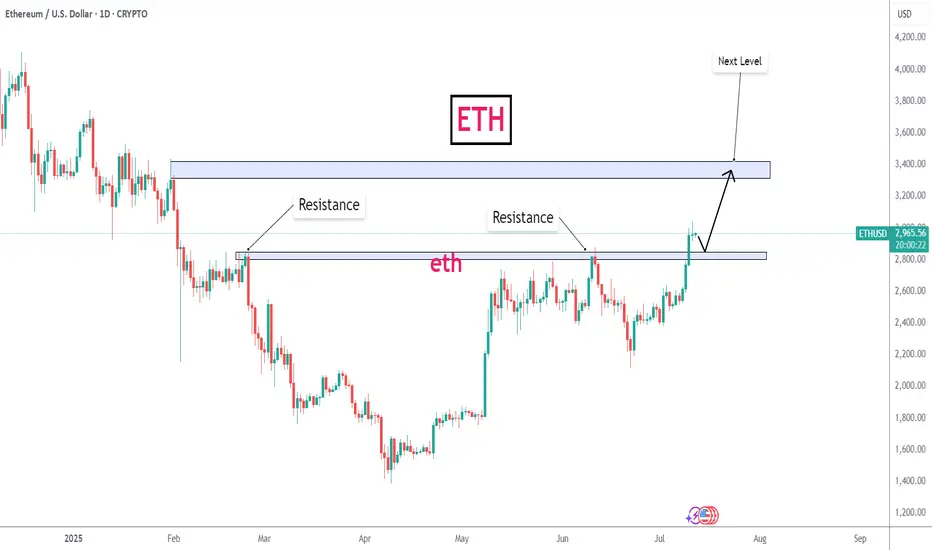
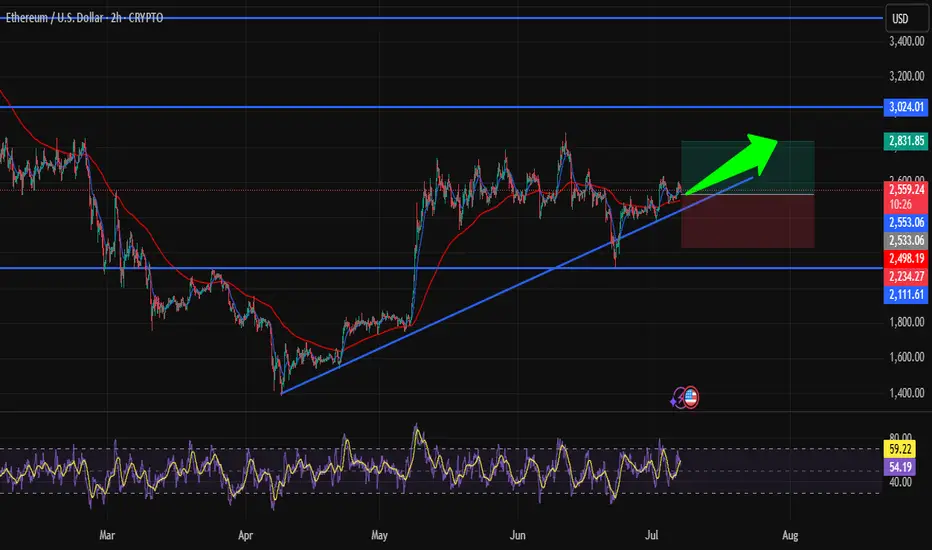
Is ETH Heading to $2800? Strategic Entry in Bullish TrendHi traders! , Analyzing ETH/USD on the 2H timeframe, price is respecting an ascending trendline and showing signs of continuation within the bullish structure:
🔹 Entry: 2555
🔹 Take Profit : 2831
🔹 Stop Loss : 2234
After consolidating above key support and retesting the ascending trendline, ETH is showing potential for a bullish continuation. The recent bounce is forming higher lows, and price remains above the 50 EMA, suggesting buyers are maintaining control.
RSI is currently turning upward from the mid-zone, signaling growing bullish momentum while still avoiding overbought conditions. The trendline has been respected several times, adding confluence to the setup.
If momentum holds, the TP around 2831 lines up with a significant resistance area from previous structure — a logical zone for price to reach in the short term.
⚠️ DISCLAIMER: This is not financial advice. Every trader is responsible for managing their own risk and strategy.
ETHEREUM READY FOR TAKEOFF?Hi traders! Analyzing Ethereum (ETH/USD) on the 1H timeframe, spotting a potential entry:
🔹 Entry: 1,840.30 USD
🔹 TP: 1,990.20 USD
🔹 SL: 1,753.70 USD
Ethereum is showing signs of a possible bullish reversal! RSI is near oversold levels, and if momentum picks up, we could see a strong move toward 1,990.20 USD. Eyes on the charts! 📈
⚠️ DISCLAIMER: This is not financial advice. Trade responsibly.

Ethereum at a Key Level! ¿Rebound or More Drop?Hi traders! 🚀 I'm entering ETH/USD at a key zone. The price is testing support at $2,098, and while the trend is still weak, the RSI at 30 suggests we're in oversold territory. 👀
Trade Details:
🔸 Entry:$2,098 ✨
🔸 SMA 200:$2,213 → strong resistance.
🔸 SMA 20:$2,167 → could act as a barrier.
🔸 TP:$2,256 🟢
🔸 SL:$1,912 🔴
Clear risk management in place—let's see if we get the bounce! What do you think? 📉📈🔥
⚠️ Disclaimer: This is not financial advice. I'm just sharing my analysis and personal experience. Every trader should do their own research and manage their risk. 📢

Ethereum Bullish Flag: A High-Potential Setup! Hi, traders. I’ve just taken this trade on Ethereum as I’m spotting a clear Bullish Flag pattern on the 1-hour timeframe. After a strong drop, the price started consolidating within this channel, respecting the trendlines.
My entry is at $2,620, anticipating a breakout to the upside. My initial target is around $2,932, which aligns with a key resistance level, and my stop loss is set at $2,598, just below the support zone, where the pattern would be invalidated.
The RSI is also supporting this setup, sitting around 40, indicating there’s still room for an upward move if the breakout happens.
Will this scenario play out? Let’s see! If you have any comments or want to share your analysis, feel free to drop them below. Good luck with your trades!
Disclaimer:
This is not financial advice. Trading involves risk, and you should only trade with money you can afford to lose. Always do your own analysis before entering any trades.

ETH/USD Analysis: Trading Opportunity in Real TimeHello, traders! Today, I'm testing some premium indicators on TradingView for the ETH/USD pair with a 1-hour timeframe. 🚀 I'm using tools like the Support & Resistance Matrix, Market Prediction Indicator, and Trend Navigator to find the best opportunities.
📌 Trade Details:
Entry: $3,311.07 (latest signal).
Take Profit: $3,400.00 (projected resistance zone).
Stop Loss: $3,237.44 (key support zone according to the indicators).
The Trend Navigator is still showing a bullish trend, and even though I’ve already taken the latest signal, there’s still time to analyze this opportunity! 📈 The projection indicates a potential upward movement, and we are well-positioned to take advantage of it if the price maintains this momentum.
🔥 My analysis: If we respect the blue trend line and hold the nearby support, the target is achievable. But always remember to manage risk and adjust your stop loss to protect capital.
What do you think of this entry? Leave me your comments, and don’t forget to like for more trading content! 🎥✨"

ETHEREUM IN COMPLEX CORRECTION ? Following is ETHEREUM analysis
1) The major five-wave Elliott wave coming from 2017 ended MAy 2021
2) Wave 2 corrected W1 by almost 85-90%
3) W3 started and had a good 161% fib extension of W1 to 2599
4) W4 is simple correction and retraced only 23% as W2 had a deep correction
5) W5 ended at 4367
------------
A-B-C corection
In a complex A-B-C correction
W(A) is a 3 wave
W(B) is a 3 wave structure and usually ends above W5
Wave(C) is a 5 wave and drastically drops to the start of W(B)
I hope to be wrong but lets see what happens in the next few days
-------------------------------------------------
(Or)
Maybe Wave 3 can be where w(5) ended and we are in a W(4) correction phase and once thats completed we go on W(5)
Love your feedback - happy trading

ETHUSD H1 to 216$ moving towards 1st resistanceETH is forming a symmetrical triangle and an uptrend channel on the H1 chart.
If the symmetrical triangle break out upperside then a price reversal could be confirmed and the 1st target is 216$
If the symmetrical break out downside then ETH may reach to 185$
Symmetrical Triangle : The breakout in a symmetrical triangle happens in the third try 60 to 70% of the time either upside or downside, if the breakout happens upside at the third try the price goes up and reach the target and if it breaks downside at third try then price goes down and reach the target. if price can't break at the third try in downside then it can be guessed that it will breakout upperside.
Currently ETH touched the symmetrical triangle both upperside and downside two time, let's see which side it breaks at the third try and in a confirmed breakout buy or sell decision could be make.
As of now it seems it will break upperside because Sellers strength is weakening.
Support me by hitting the like button.
Thank You;

ETHUSD Ethereum LONG 1 HR ChartHello to all watching my charts
Here is Ehereum again in the focus.
Still long
But we have 2 moves here.
First and bigger move is clear to the upside (blue trendchannel long)
but my the shorttime system is now even flat. !!
So we have to get an eye again on the bigger and longer timechannel
to check whats going on.
Dont follow the guys which tells you Short, Short, Short..
cause we should have here the rule:
We should trade what is really happens in the chart
and not what could happen in the future...
So till the blue channel hold i suggets to stay long...
No Sign of short at these time
2 Possibilites are in status:
First : The pair ignores the short time flat signal
and is smoothly running further up in my longsyystem (blue lines)
Maybe...
Second: The pair follows the shorttime signal as shown flat in the shorttime system and the long
is over and a more sideways trend will follow.
As a consolidation.
Only if ETHUSD break both channels to the downside i suppest to talk about short.
Good trades
If you want to support my work and chart please like them...
Renkotrade
