Ethereum (ETH/USD) Technical InsightsEthereum (ETH/USD) Technical Insights
**Chart Overview**
* **Current Price**: \~\$3,631
* **EMA 7 (Red Line)**: \$3,720.80
* **EMA 21 (Blue Line)**: \$3,522.96
* **Key Support Zone (Pink area)**: \~\$3,600–\$3,650
* **Support 1 (S1)**: \~\$2,950
* **Support 2 (S2)**: \~\$2,500
* **Uptrend Line**: Still intact, but under pressure
**Technical Insights**
* **Price Breakdown**: ETH has dropped below the **EMA 7**, and is now testing a **critical horizontal support zone** around **\$3,600–\$3,650**.
* **Trendline**: Still holds, but ETH is **hovering just above it**, signaling a potential bounce or breakdown.
* **EMA 21** near \$3,522 is the next short-term support if \$3,600 fails.
* **Momentum**: Recent candles show **strong selling**, indicating weakness, but no full breakdown yet.
**Bullish Scenario**
*Conditions**:
* Price **holds above** \$3,600–\$3,620 zone and the **trendline**
* **Bounce** with bullish daily candle from current zone or above \$3,650
**Buy Setup**:
* **Entry**: \$3,620–\$3,650 on confirmation
* **Stop-loss**: Below \$3,520 (just under EMA 21)
* **Targets**:
* TP1: \$3,720 (reclaim EMA 7)
* TP2: \$3,850–\$3,940
* TP3: \$4,100+
**Bearish Scenario**
**Conditions**:
* Price **breaks below** \$3,600 and **the trendline**
* EMA 21 is lost with strong bearish candle
**Sell Setup**:
* **Entry**: Below \$3,580 on breakdown
* **Stop-loss**: Above \$3,650
* **Targets**:
* TP1: \$3,520 (EMA 21)
* TP2: \$2,950 (S1)
* TP3: \$2,500 (S2)
**Bias: Neutral with Bearish Lean**
* **Decision Zone**: ETH is at a key inflection point
* Wait for **confirmation**: bounce or breakdown before entering
Ethrium

Ethereum at Crucial Resistance – Will the Bulls Hold or Fade?Ethereum at Crucial Resistance – Will the Bulls Hold or Fade?”
Ethereum is currently trading near a key resistance zone around $3,800, as marked on the chart. After a strong bullish rally with clear Break of Structures (BOS) along the way, ETH has now reached an extended point where price may face selling pressure.
The Bollinger Bands are stretched, showing overextension, and the marked arrow suggests a possible correction or pullback from this level. A retest of previous support zones (~$3,400–$3,200) could be expected if the resistance holds.
⸻
Key Levels:
• 🔼 Resistance: ~$3,800
• 🔽 Support: ~$3,400 / ~$3,000
• 🔄 Price Action: Watching for rejection or breakout confirmation
This is a textbook case of price approaching a strong resistance level after a bullish wave, where caution and confirmation are key for the next move.

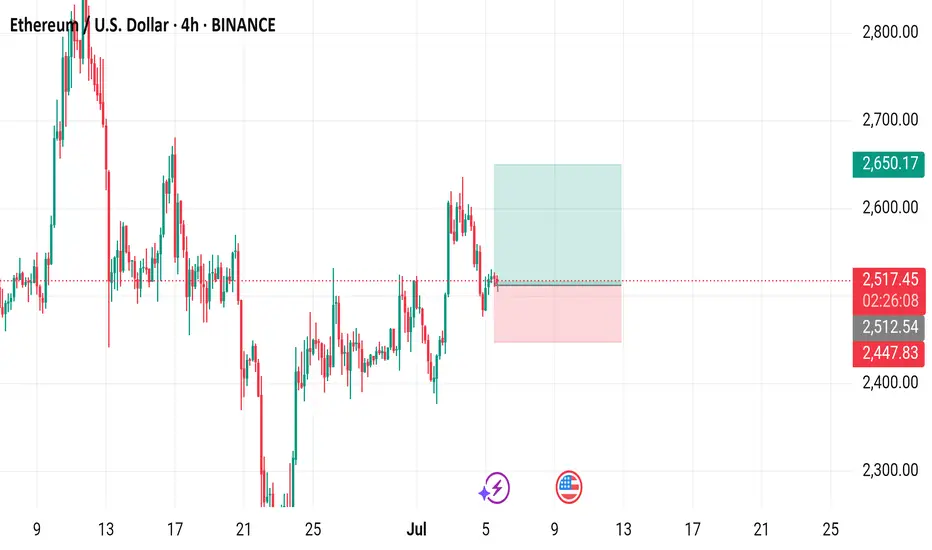
Ethereum / U.S. Dollar 4-Hour Chart4-hour chart from BINANCE displays the price movement of Ethereum (ETH) against the U.S. Dollar (USD) as of July 05, 2025. The current price is $2,520.12, reflecting a 4-hour increase of $10.77 (+0.43%). The chart includes buy and sell signals at $2,520.12, with a highlighted support zone around $2,447.83 and resistance near $2,650.17. A recent price drop is visible, followed by a potential consolidation or reversal zone marked in green and red.
Btc scalping
*DISCLAIMER*
DO NOT take this video as financial advice! I am not a financial advisor and this video was only made for entertainment purposes. I am not liable for any losses you may incur so always do your own research before making any investment/financial decision.
This information is what was found publicly on the internet

Ethrium BULLISHETHRIUM BULLISH AND IN RANGE BUT WHEN BREAKOUT (THAT IS POSSIBLE 95% )
IT MAY JUMP UPTO 20%

ETHUSD ETHERIUM is also going through pandemonium of possible halving of the crypto, it hasn't been doing well for some time, still above the ichimoku cloud if the cloud holds as resistance for a possible buy or it might fail to hold to test levels below


Classisc actioni dont know what to say.
maybe classic will follow like litecoin.
im just pullback for long.
but the confirmation is when the price break through the line.

when is the time for Ethrium?im waiting this quite sometimes. let sew a few days more before end of May.
does can it beat the new freaking rival? ripple.

Get ready for the ethrium classic as wellplanning to buy at the blue box,
stick together guys.
2,@3 days more.
