ETH Neowave - Elliott Wave Theory Analysis (Weekly - Long Term)In ETH, the Macro structure (if you can look at the chart more remotely) shows the most potential time limit as 113-117 weeks. At the same time, in the microstructure (close perspective), the same duration of waves A and C (since wave B is temporally much longer than A) would correspond to 113-117 weeks in the macrostructure.
(These time relationships are measured for the most common cases - it should not be expected to happen at that exact moment at that exact minute. It is only an estimate of the time horizon).
As a result, I expect it to follow the Yellow or Red path at this point.
The Yellow possibility is more likely to be justified by news such as ETH ETF approval, which may come in a fundamental sense. For this reason, this news should be followed up to date. Otherwise, the red possibility has priority.
I take a 1% risk on the trades. Since the formula of the line chart is different, I am thinking of using a manual stop. Options trading will be more suitable for this transaction.
I will share updates here.
Thank you for your support.
Ethshort

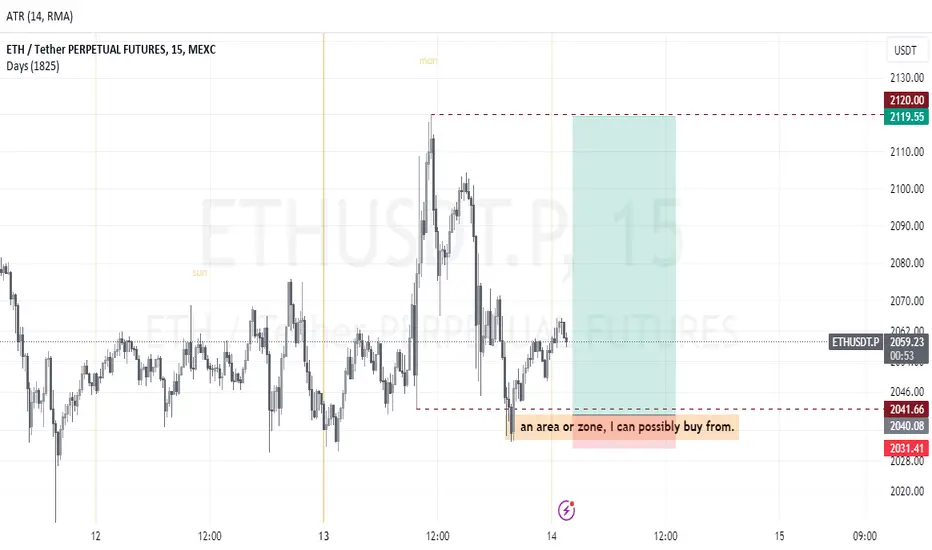
ETHUSD almost at resistanceETHUSD still at symmetrical triangle pattern.
If we look at previous lower high, it touch with a long shadow , so in this wave maybe $2,038 is the new lower high.
pullback from this position at fibonacci support or at triangle support around $1,957
maximum high for this wave at $2,074
Don't forget to support this analysis, Thanks.

Ethereum Price Signals Potential 60% Surge Ethereum is showing signs of a significant breakout, forming an ascending triangle pattern with three higher lows and three nearly equal highs since June 2022. A decisive weekly close above the $2,000 horizontal resistance could trigger a 43% surge to $2,943.
Currently, Ethereum is holding above the support of the Momentum Reversal Indicator (MRI) at $1,936, indicating potential strength. If Bitcoin's price remains stable, Ethereum is expected to rally towards $2,943, facing resistance at $2,539.
While the target is theoretically $2,943, Ethereum could surpass this and reach $3,186, implying a 60% increase. Conversely, a failure to maintain support above $1,936 may lead to a correction towards $1,795. A weekly close below $1,547 would invalidate the bullish scenario, potentially pushing Ethereum down to $1,309.

Overview of the ETH (global picture)Until October 23 , the picture was bearish, which motivated people to open short positions. At the moment, I expect growth to 2200-2400-2600 (which will be a bull trap in the classical sense). So far, the majority does not believe in such growth. Plus, they are catching up with positive news (when the price comes out, I expect even more good news). As a buyer, I am not very happy with positive news (look at the history)

"Ethereum Maintains Strong Position Above $1,935 Support Level" Ethereum's price maintains its position above the crucial $1,935 support level, which could spell doom for ETH if breached. With the RSI tilting upwards and AO staying in the positive zone, ETH may extend its upward trajectory, recovering above the $2,029 support to follow the upward trend. This could propel the second-largest cryptocurrency by market capitalization to reach its highest point at $2,136. However, in the face of increased selling pressure, Ethereum's price might dip below the $1,935 support. A decisive move below this level would confirm a downtrend, with ETH potentially testing the 25-day or 50-day EMA at $1,892 and $1,806, respectively.
In a more bearish scenario, Ethereum's price could target the 100-day EMA at $1,763, and breaking and closing below this level would invalidate the bullish argument below the $1,753 support.
Read also: Ethereum Price Prediction: Ascending Triangle Pattern Evaluates $4,000 Target for ETH in 18 Months.

$ENS BREAKOUT DONE What is a trendline break and how to trade it?
There is a breakout when the price crosses an important level. However, not all breakouts are created equal. There are preconditions for a breakout to be considered relevant:
Consolidation before the breakout.
A significant increase in trading volume.
Indicating investors’ enthusiasm to push the price as far as possible.
Regarding consolidation, breakouts often occur after forming a contraction pattern, such as a triangle or a wedge. During these market phases, the volume gradually decreases, and the amplitude of the movements does the same so that the price action evolves in a narrow range.
A sudden increase in volumes, as well as the exit of the price from the range, is often indicative of a new trend forming.
How to trade breakouts?
There are different ways to trade breakouts in the stock market, which are more or less aggressive depending on where you open your position.

ETH trade setup for 15th Nov 2023My setup yesterday was bullish, I only caught a 1:2rr. I didn't see other factors telling me to go bearish.
I was bent on being bullish, so I know and believe, setups can change. So learning to be dynamic is key and not holding to one belief of how the trade should pane out. However, it was a good day.
Today being, 15th Nov 2023, I'll be expecting a bearish scenario as outline on the chart. So I'll be expecting price to enter into the areas highlighted above and also the rectangle above for a reason to go short at specific time.
This is not a trade advice, please dyor

ETH Trade setup for 14th Nov 2023Eth has been bullish compared to BTC, so for me to trade this pair because it refused to make lower low but it also still took out some lows as an inducement to go short however, that's not the actually direction. It's direction is bullish to offset short traders. My possible scenario is for the market to trade into my zone at about 9:30am NY time today, then I can see what price is doing. If there be reasons to go long or short.
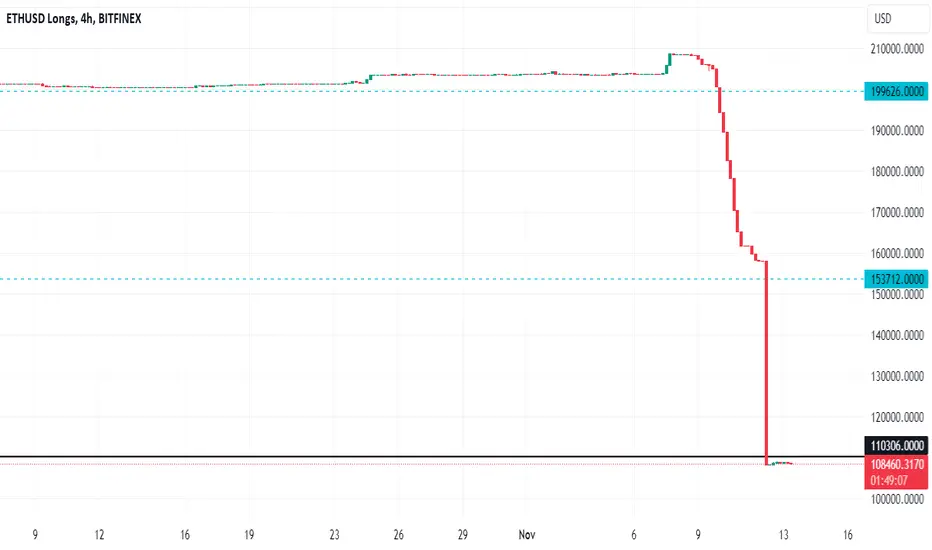
ETHUSDLONGSETHUSDLONGS
On the chart, there was a sharp collapse in ETH longs. This is a likely signal for a subsequent correction of the coin.
But this does not mean at all that the collapse will happen tomorrow or within a week. Perhaps the correction will follow only after six months.
If there is an update, we will notify you.
Don't forget to show your support by like(rocket) and comment✅
#eth #ethereum short term movements#ethusdt has been moving inside this ascending wedge. If #ethprice again declines from top of this channel (2250 - 2300 usd) , then a dump will likely occur.
The invalidation is: If #ethusd price smashes 2300 - 2500 usd price zone with weekly closing and strong volume.
NOT FINANCIAL ADVICE.

ETH/USDT 1DAY UPDATE BY CRYPTOSANDERS !!Hello friends, welcome to this ETH/USDT update from Crypto Sanders.
Chart Analysis:- Turning to ethereum (ETH), the second giant in the crypto realm, we observe a substantial week-on-week gain of 17.4% with the price currently at 2,097. Ethereum’s oscillators, however, send warning signals with an RSI at 80.3, signaling a possible correction, and an overly bullish Stochastic at 90.6 resting at neutral. The CCI exacerbates this caution with a high 262.3, reinforcing the bearish sentiment.
Ethereum’s moving averages paint a more positive outlook, much like Bitcoin’s, with all indicators from the 10-day to the 200-day averages signaling strong upward momentum. The disparity between the shorter-term EMA at 1,937.7 and the longer-term SMA (200-day) at 1,777.4 suggests that while ether’s immediate trend is still bullish, there’s potential overheating that could prompt a near-term correction.
The market capitalization of ether stands at 252 billion, underscoring its significant growth over the past month by 33.1%. The volume and market cap showcases Ethereum’s liquidity and trader interest, indicating a healthy market for ETH. However, the inflated oscillator values raise concerns about sustainability and call for vigilance among traders against possible volatility.
I have tried to bring the best possible results in this chart.
If you like it, hit the like button and share your charts in the comments section.
Thank you.

Ethereum (ETH) Returns to Our Radar - Anticipating Resistance AhHey Traders,
I've got a noteworthy update on Ethereum (ETH) that demands our attention.
Analysis:
I foresee a substantial resistance looming over the ETH price. Despite recent movements, my analysis suggests the likelihood of ETH revisiting levels below $1500.
Disclaimer:
This information is not to be considered financial advice. Always conduct thorough research before making any trading decisions.
Let's delve into the details on the TradingView charts, keeping a close eye on the potential resistance and the factors driving this anticipation. Happy Analyzing! 📈🔍

ETHLeading cryptocurrencies Bitcoin (BTC), Ethereum (ETH) and XRP are showing significant gains, according to data from CoinStats. Today, BTC was up 0.91%, trading at $35,171, with expectations of breaking the $35,612 resistance. If this level is surpassed, BTC is likely to reach $36,000 by the end of this week.
On the other hand, ETH outperformed other cryptocurrencies with a gain of 1.73% and is currently trading at $1,909. If ETH surpasses yesterday's peak, it is predicted to hit the critical $2,000 zone by mid-November.

ETH Flag Pattern: Quick Short then $2KHi Traders, Investors and Speculators of Charts📈📉
As you know, we're trading in the opening moments of a new bullish cycle. Often when quick increases happen, pullbacks and corrections are sure to follow, even during a bull market this is natural.
ETH formed a flag, and this gives the opportunity to take either a long or a short. Watch the video for a quick setup with conditions and an easy to understand explanation.
Remember, support and resistance zones are great to watch for possible long and short opportunities during brief pullbacks!
_______________________
📢Follow us here on TradingView for daily updates📢
👍Hit like & Follow 👍
We thank you for your support !
CryptoCheck
BINANCE:ETHUSDT

ETHUSD SELL | Day Trading Analysis Hello Traders, here is the full analysis.
Watch strong action at the current levels for SELL . GOOD LUCK! Great SELL opportunity ETHUSD
I still did my best and this is the most likely count for me at the moment.
Support the idea with like and follow my profile TO SEE MORE.
Traders, if you liked this idea or if you have your own opinion about it, write in the comments. I will be glad 🤝
Patience is the If You Have Any Question, Feel Free To Ask 🤗
Just follow chart with idea and analysis and when you are ready come in THE GROVE | VIP GROUP, earn more and safe, wait for the signal at the right moment and make money with us💰

ETH/USDT 1DAY UPDATE BY CRYPTOSANDERS !!Hello friends, welcome to this ETH/USD update from Crypto Sanders.
Chart Analysis:- Ethereum (ETH) dropped 2.8% to 1,785 during the past 24 hours, with 13.19 billion worth of ether changing hands over 24 hours. The RSI of 61.4 implies that ethereum has room to rise before overbought conditions materialize.
Meanwhile, the Stochastic level of 79.9 indicates the crypto asset is approaching overbought territory on the daily chart. The CCI reading of 51.4 reflects ether trading in the middle of its band. The 10-day SMA at 1,800 is close resistance, while the 50-day and 100-day SMAs at 1,656 and 1,693 denote some leftover bullish momentum.
Ethereum has witnessed a significant uptick in exchange inflows, reaching a five-month high with a surge of nearly 130,000 ether deposited into exchanges. Over the past fortnight, it has risen more than 10% and over the past month, over 8%. Ether recorded 13.19 billion in 24-hour trade volume on Friday.
I have tried to bring the best possible results in this chart.
If you like it, hit the like button and share your charts in the comments section.
Thank you.


LRC performed Descending BroadeningLRC performed Descending Broadening Wedge
A descending broadening wedge is a technical chart pattern often observed in financial markets, particularly in stock trading and forex. It is a type of wedge pattern that indicates a potential trend reversal from a downtrend to an uptrend. Here's a breakdown of the key characteristics of a descending broadening wedge:
1. **Shape:** A descending broadening wedge consists of two converging trendlines. The upper trendline slopes downward, while the lower trendline slopes upward. This creates a wedge-like shape on the price chart.
2. **Diverging Boundaries:** The defining feature of this pattern is that the two trendlines are moving away from each other, making the wedge broader as time progresses.
3. **Sloping Trends:** The upper trendline represents the resistance level and is typically steeper than the lower trendline, which serves as the support level.
4. **Volume:** Volume tends to decrease as the pattern develops. This is a key characteristic, indicating a decrease in trading activity.
5. **Duration:** The pattern usually takes several weeks to form, but the timeframe can vary.
6. **Breakout:** The pattern is considered complete when the price breaks out of the wedge formation. The breakout can be in either direction, although in the case of a descending broadening wedge, a breakout to the upside is more common and is seen as a bullish signal.
7. **Target:** Traders often use the width of the pattern at its widest point to estimate a potential price target once the breakout occurs. This is typically projected in the direction of the breakout. In the case of a descending broadening wedge, the target would be higher prices.
Remember that technical analysis, including the interpretation of chart patterns like the descending broadening wedge, is just one tool used by traders and investors to make decisions. It's important to consider other factors and use risk management techniques when making trading or investment choices. Additionally, not all chart patterns play out as expected, so it's crucial to use these patterns in conjunction with other forms of analysis to make informed decisions.

ETHUSD showing rejection from Resistance, price may head lowerGBPUSD
The price has shown rejection after reaching descending trendline, if price stays below the descending trendline, we might see price heading lower..
Trade Wisely
*The content on this analysis is subject to change at any time without notice, and is provided for the sole purpose of assisting traders to make independent investment decisions.

$iris started.. Breakout gonna huge NSE:IRIS Performing Falling wedge in 1D Keep eye on Breakout
Falling Wedge
The falling wedge can either be a reversal or continuation signal.
As a reversal signal, it is formed at a bottom of a downtrend, indicating that an uptrend would come next.
As a continuation signal, it is formed during an uptrend, implying that the upward price action would resume. Unlike the rising wedge, the falling wedge is a bullish chart pattern.
In this example, the falling wedge serves as a reversal signal. After a downtrend, the price made lower highs and lower lows.
Notice how the falling trend line connecting the highs is steeper than the trend line connecting the lows.
If we placed an entry order above that falling trend line connecting the pair’s highs, we would’ve been able to jump in on the strong uptrend and caught some pips!
A good upside target would be the height of the wedge formation.


ETH/USDT UPDATE !!Hello friends, welcome to this ETH update from Crypto Sanders.
Chart Analysis:- ethereum’s (ETH) price is coasting along at 1,796 per unit. ETH has witnessed a 24-hour range of 1,786 to 1,827 per ether. Ethereum’s volume is higher than BTC’s today with 10.56 billion traded over the last 24 hours. In terms of market dominance, ETH’s market valuation amounts to 16.4% of the 1.3 trillion crypto economy.
Ethereum presents a more tempered growth story, with a 3.9% increase in price over the past month. The oscillators, with an RSI of 67 and Stochastic of 76, do not indicate an extreme market condition, suggesting a more stable and neutral environment compared to Bitcoin. The moving averages, with an EMA of 1,771 and an SMA of 1,792, provide additional support for a positive outlook, though the growth is not as pronounced as that of Bitcoin.
The steadier price movement of Ethereum, coupled with the less extreme oscillator values, positions ETH as a potentially less volatile option in the current market. However, traders should still exercise caution and consider a range of indicators and market conditions before making trading decisions. The positive trend indicated by the moving averages is a promising sign, but it is crucial to remain vigilant and stay updated with market developments.
I have tried to bring the best possible results in this chart.
If you like it, hit the like button and share your charts in the comments section.
Thank you.

$loka in 1D showing strong BUll DEVRelative Strength Index
The Relative Strength Index (RSI) is a momentum indicator that measures how fast and how much the currency pair’s price changes in a specific time period. It provides traders with overbought and oversold market conditions by providing values ranging from 0 to 100.
A bullish divergence can be identified with RSI when the currency pair price makes higher lows, and RSI makes lower lows.
A bearish divergence can be identified with RSI when the currency pair makes higher highs and RSI makes lower highs.
