Rising wedgeA rising wedge in an up trend is usually considered a reversal pattern. This pattern is at the end of a bullish wave, by creating close price tops, shows us that the supply has intensified and there is a possibility of a trend change. Of course, nothing is certain and if the buyers are more willing and strong, this pattern may be broken in the direction of the market rise.
A rising wedge in the middle of a downtrend, is considered a corrective move and is known as a continuing pattern. For example, take a look at the above chart of Ethereum on the weekly time frame
Ethshort

ETH/USDT 1D TA: Rising wedgeIf the price reaches the supply zone again and sales pressure increases, we can enter a short position (by complying with risk management and approvals (sell position)
The targets are $1905 and $1680


ETH/USD 1DAY UPDATE BY CRYPTO SANDERS !!Hello, welcome to this ETH/USDT update by CRYPTO SANDERS.
CHART ANALYSIS:- ethereum (ETH) also made significant gains on Thursday, rising above 1,900 in the process.
Following a low at 1,812.37 on Wednesday, ETH/USD surged to an intraday high of 1,932.07 earlier in today’s session.
This was the highest level that ethereum had hit since May 6, which is the last time price was over 2,000.
Today’s rally also pushed the RSI to a resistance level at 61.00, a point that it has so far been unable to move past.
the index is now tracking at 60.79, with earlier bulls opting to secure some gains, resulting in a drop in price.
ETH is now trading at 1,882.95.
I have tried to bring the best possible outcome to this chart.
Hit the like button if you like it and share your charts in the comments section.
Thank you

ETH/USD 1DAY UPDATE BY CRYPTO SANDERS !!Hello, welcome to this ETH/USDT update by CRYPTO SANDERS.
CHART ANALYSIS:- Ethereum (ETH) was marginally in the green in today’s session, with price hovering close to a recent support point.
ETH/USD hit an intraday peak of 1,748.64 earlier in the day, before retreating to a low less than 24 hours after climbing from a floor at 1,705.81.
ethereum has slipped back to a support point at 1,725, a point where it has consolidated for the past four days.
this retreat occurred as the RSI ran into a ceiling of its own at the 44.00 mark.
the index now sits at the 42.21 mark, and appears to be heading to a lower floor at 40.00.
Should strength fall below that mark, there is a good chance that ETH will drop below 1,700 in the coming days.
I have tried to bring the best possible outcome to this chart.
Hit the like button if you like it and share your charts in the comments section.
Thank you

ETH Is in a No Trade ZoneTLDR:
• Until ETH gets above the resistance trendline and the 21D & 50 D EMAs and retest the area as support, it is too risky to long.
• Until ETH loses the support trendline (again) and the horizontal 1680 USD support level, it is not a short either.
Background:
• Since June of 2022 ETH is in an uptrend.
• ETH has held an upward sloping support line since November 2022.
• During the past eight months, an oversold RSI reading coupled with a touch of the trendline proved to be a good long opportunity.
• We are now at the same situation as in the previous two lows:
1. Daily RSI is (was) oversold.
2. ETH touched the trendline.
3. ETH is below the 21D & 50D EMAs.
• However, this time, ETH closed a daily candle below the trendline, which IMO is a sign of weakness.
• IF ETH manages to get above resistance and make the same gains it did in previous times, it could go as high as 2700 USD (between the 1 – 1.272 fib extension).
My Trade Ideas:
1. ETH Long:
• Precondition: ETH breaches the resistance trendline and the EMAs and tests them as support. To be clear, as long as ETH is below the EMAs it is not a long IMO.
• Entry: 1815
• SL: Below the trendline, approximately 1755.
• TP: 1930, 2000, 2150, 2700.
2. ETH Short:
• Precondition: ETH loses the upward sloping trendline and the 1680 USD horizontal support level and tests them as resistance.
• Entry: Below support, approximately 1650
• SL: 1720
• Target: 1500 (Liquidity pool)

ETH Bearish consolidation before drop to 1600sWe're pretty much just moving with BTC. So here's a short-term prediction on where we go. I don't think we're going to retest highs anymore, and looking to fall back to 1600s within a few days or less. We consolidated too much at the 1700s and fell too low, so it was basically distribution, not accumulation.
I think we go down a lot from here. Check out my other BTC idea for long term timeframe crypto movement.

SasanSeifi 💁♂️ETH/USDT 👉1D 🔻 1570$/ 1446$ After correcting 15% from the price range of 1900, now the price is trading in the range of 1737. In the long term, the possibility of further price correction can be considered.
Considering the failure of the 1740 price support range, in my opinion, the price will face further correction from the important resistance areas of 1790 and 1842 after the pullback and liquidity collection if selling is confirmed
In case of a positive fluctuation, to better understand the continuation of the trend, We have to see how the price will react to the resistance ranges.
Otherwise, if the price is above the stabilization resistance range, it may be associated with further growth.
Possible trends are identified.
❎ (DYOR)...⚠️⚜️
What do you think about this analysis? I will be glad to know your idea 🙂✌️
IF you like my analysis please LIKE and comment 🙏✌️

ETH good to do short at 18004h time frame
-
ETH is approaching towards resistance
Range 1770-1800
Plan a short trading here
Target: 1385
SL 1846

Ethereum climbs past $1700 but can it continueThe H4 imbalance (white shaded box) was filled and the structure of ETH on the 4-hour remained bearish. The OBV saw a bounce but did not trend upward.
The Fibonacci retracement levels plotted for the move down to $1630 last week showed that the $1716 and $1740 are important resistances.
Entry: $1716
Stop-loss: $1753 (a move above $1740 and $1750 will signal bullish intent and a bullish MSB)
Take-profit: $1597 (the 23.6% extension level, although a drop below $1600 could eventually see $1500 retested in the coming weeks)
R:R- 3.45

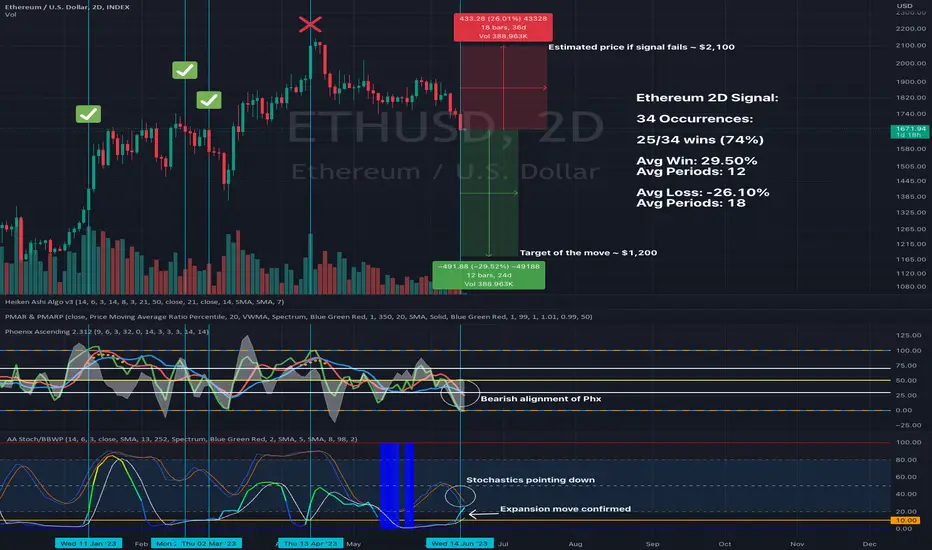
BEARISH 2D ETHEREUM SIGNALThis is the 2Day #ETH chart analysing volatility vs momentum.
This signal has just confirmed, this bearish confirmation may see ETH move down to $1,200 over the few weeks.
This analysis has been quite accurate (74%) over the past 34 iterations, with the average move of the expansion phase being ~29.50% lasting just over three weeks.
*The moves are measured once the BBWP crosses above the orange horizontal line. *
Probability suggests that we will ETH fall to ~$1,200 (-29.50%) over the next 24 or so days. However, if this signal were to fail. Then, ETH may see rally up to April highs around $2,100.
The lack of liquidity can be seen as Bitcoin and Crypto has failed to make higher prices since April, whilst traditional markets such as the S&P 500 and DAX continue to rise.
See 'Total3' which shows money flowing out of altcoins and into Bitcoin, which is a bearish sign.
ETHUSD Waves Analysis Bearish
Impulse wave up that finished on 11th November 2021. Followed by an ABC correction.
Where wave (A) finished and we now either in correction (B) or we started the wave C of the correction.
So even though we can count this minor abc correction in wave (B). it does not mean it is finished. Waves B can take the form of complex corrections wxy.
So how do we know if wave (B) intermediate it is finished if it crosses the paralel channel make it official wave (C).
Supporting indicators
RSI -turning down below 50
MACD - Turning below centre line
Targets going forward
1. Target nr 1 $1400 region if it bounces back correction might not be over yet wave (B)
2. Target nr 2 $874 end of wave 5 of (A)
3. Target nr 3 price target $ 458 -480 region based on symmetrical channel and a few Fibonacci Ratios.

ETHUSDT Short Targets If the support breaks, I expect the targets as shown on the chart. Enjoy with your own responsibility.

ETH on MA200 daily . MA can support ETHETH is on the MA of 200 in the daily time, according to the strength of the trend and confirmation, we can enter into a short trade, otherwise, the return to the top of the support range, according to the previous analysis, the price has the ability to reach 2400

💥 ETHUSD 1D-TIMEFRAME ANALYSIS💥 ETHUSD 1D-TIMEFRAME ANALYSIS
💗Hello ladies and gentlemen
This is my new idea for 💥 Ethereum
12345
I hope my idea is clear
Support me by like and share thank you
Stay Safe💯💲💲💲
Good luck💰😍

ETH/USDT 1DAY UPDATE BY CRYPTO SANDERS !!Hello, welcome to this ETH/USDT update by CRYPTO SANDERS.
CHART ANALYSIS:- ethereum (ETH) moved marginally higher, however, it continued to trade below 1,800.
ETH/USD jumped to a high of 1,757.89 earlier in today’s session, which comes a day after the price was at a bottom of 1,723.09.
The latest surge came as bulls took charge at a floor of 1,730, with the RSI bouncing from a floor of its own at 38.00.
price strength is tracking at 39.33, with the next visible point of resistance being 43.00.
Should the index move beyond the aforementioned ceiling, there is a strong possibility that ETH will climb to 1,800.
I have tried to bring the best possible outcome to this chart.
Hit the like button if you like it and share your charts in the comments section.
Thank you

Ethereum - Looking To Sell Pullbacks In The Short TermH4 - Bearish trend pattern.
Currently it looks like a pullback is happening.
No opposite signs.
Until the two strong resistance zones hold my short term view remains bearish here.

ETH lots opportunities with this potential structure1h time frame
-
ETH may create a wedge or flag structure here from short perspective.
Based on wedge, I plan 4 trading opportunities, including 3 short and 1 long.
Final target is 1380.
Stay prepared for it.

ETH/USD 1DAY UPDATE BY CRYPTO SANDERS !!Hello, welcome to this ETH/USDT update by CRYPTO SANDERS.
CHART ANALYSIS:- ethereum (ETH), which dropped below the 1,800 level to start the weekend.
After climbing to a peak of 1,861.14 on Friday, ETH/USD slipped to a bottom of 1,721 earlier in today’s session.
The move saw ethereum plunge to its weakest point since late April, breaking out of a floor at 1,730.
As a result of this shift in market momentum, the RSI also tailed off, dropping to its lowest level since March.
The index is currently at a reading below 40.00, close to oversold territory, and could act as a slight positive for bulls.
If the price becomes more oversold, there is a good chance that longer-term bulls could move to buy the dip.
I have tried to bring the best possible outcome to this chart.
Hit the like button if you like it and share your charts in the comments section.
Thank you

ETH may dump before the pumpETHUSDT speculative long setup:
Crypto market seems to be struggling to break higher. If we see more downside on crypto, we expect ETH to drop to 1500 $ which would be another higher low in the current uptrend.
Entry for a swing long: 1550$
Target: 2500$
Good luck

ETH/USD 1DAY UPDATE BY CRYPTO SANDERS !!Hello, welcome to this ETH/USDT update by CRYPTO SANDERS.
CHART ANALYSIS:- ethereum (ETH) edged lower in today’s session, a day after prices neared a breakout above the 1,900 level.
Following a high of 1,896 on Wednesday, ETH/USD dropped to an intraday low of 1,822.30.
ethereum moved below a key support point of 1,830, before bulls moved to stabilize this level.
it appears that bulls decided to reenter the market as the RSI found its own floor at 47.00.
Currently, the index is at a reading of 48.52, which is marginally below a ceiling at 49.00.
I have tried to bring the best possible outcome to this chart.
Hit the like button if you like it and share your charts in the comments section.
Thank you

Bearish Outlook on ETHIntroduction :
Ethereum (ETH) has been showing signs of potential weakness that could provide a viable shorting opportunity. This analysis focuses on the possibility of ETH breaking below the opening level of May, which could signal a bearish trend.
Analysis :
May Opening Level: The opening price of ETH in May has proven to be a significant support level. If this level breaks, it could indicate a stronger bearish momentum and potential short entry point.
Increasing Selling Pressure: Look for an increase in selling volume as ETH approaches the May opening level. This could provide additional confirmation of bearish sentiment in the market.
Bearish Divergence on RSI: The Relative Strength Index (RSI) is a powerful tool for identifying potential reversals. If ETH shows lower highs on the RSI while price records higher highs, this bearish divergence could indicate that the bullish momentum is weakening.
MACD Crossover: A bearish crossover on the Moving Average Convergence Divergence (MACD) could provide additional evidence of a potential downturn.
Conclusion :
The potential break of the May opening level could signal a shorting opportunity on Ethereum. It's crucial to wait for confirmation such as a close below the May open on a daily or weekly timeframe, which could confirm bearish sentiment.
Trade Idea :
Consider entering a short position if the May opening level is broken and confirmed with a daily or weekly candle close beneath it. A stop loss could be placed above the broken support level (which could act as a new resistance) to manage risk. The first target for the short position could be the next significant support level.
Remember, trading involves risks. This analysis is intended to provide a perspective based on technical indicators and should not be taken as financial advice. Always conduct your own research and consider your risk tolerance before making any trading decisions.

ETH/USD 1DAY UPDATE BY CRYPTO SANDERS !!Hello, welcome to this ETHEREUM /USDT update by CRYPTO SANDERS.
CHART ANALYSIS:- ethereum (ETH) was also a victim of the recent storm surrounding the market, with prices dropping below 1,800.
Following a high at 1,870.82 to start the week, ETH/USD slipped to an intraday low of 1,780.21 earlier today.
the decline in ETH was relatively muted, with prices hitting a ten-day low.
ethereum is now down by 6% in the last seven days, while Bitcoin has lost over 8% of its value within that same period.
Ethereum’s RSI reading currently sits close to a support point at 42.00.
bulls have moved to buy the earlier dip, with ETH now trading at 1,814.38.
Hit the like button if you like it and share your charts in the comments section.
Thank you
