ETHEREUM short setup Hello Traders, here is the full analysis for this pair, let me know in the comment section below if you have any questions, the entry will be taken only if all rules of the strategies will be satisfied. I suggest you keep this pair on your watchlist and see if the rules of your strategy are satisfied. Please also refer to the Important Risk Notice linked below.
Ethshort

ETH next supportsBTC has stopped rising and started a consolidation since touching 30K and so did altcoins.
Next viable supports of ETH as a leader for altcoins are depicted in this post.
keep in touch to ask your questions.

ETHUSD Downward BreakoutETHUSD - Daily
Ethereum prices confirmed a topping pattern breakout, targeting: $1,700 - $1,515 on the short term.

Potential BAT 1D ETHUSDTLooking at the daily chart, we may have reached a Triple Top, with a BAT formation.
Potential Breakout zone, but considering the Network Upgrade, the economy slowing down and the sudden increase of the market, we could see a correction towards the MA50 zone.
Also, death cross on the Weekly Chart not to be taken lightly.


Ethereum to extend it's loses?Ethereum - 24h expiry - We look to Sell a break of 1783 (stop at 1833)
Short term bias has turned negative.
Posted a Double Bottom formation.
A break of yesterdays low would confirm bearish momentum.
Short term momentum is bearish.
Short term RSI is moving lower.
Our profit targets will be 1663 and 1643
Resistance: 1840 / 1860 / 1880
Support: 1815 / 1785 / 1750
Please be advised that the information presented on TradingView is provided to Vantage (‘Vantage Global Limited’, ‘we’) by a third-party provider (‘Signal Centre’). Please be reminded that you are solely responsible for the trading decisions on your account. There is a very high degree of risk involved in trading. Any information and/or content is intended entirely for research, educational and informational purposes only and does not constitute investment or consultation advice or investment strategy. The information is not tailored to the investment needs of any specific person and therefore does not involve a consideration of any of the investment objectives, financial situation or needs of any viewer that may receive it. Kindly also note that past performance is not a reliable indicator of future results. Actual results may differ materially from those anticipated in forward-looking or past performance statements. We assume no liability as to the accuracy or completeness of any of the information and/or content provided herein and the Company cannot be held responsible for any omission, mistake nor for any loss or damage including without limitation to any loss of profit which may arise from reliance on any information supplied by Signal Centre.

ETH/USDT 1DAY UPDATE BY CRYPTO SANDERS !!Hello, welcome to this ETHEREUM /USDT update by CRYPTO SANDERS.
CHART ANALYSIS:- Ethereum also hovered near its own support point in today's session as the overall market sentiment remained uncertain.
ETH/USD hit a low of 1,835.70 on Wednesday, which comes a few days after the price traded above 2,000.
Ethereum is now in the red for the fifth day in a row and is down nearly 10% during that period.
This recent run has sent the 25-day (blue) moving average (MA) down, with the trend line rapidly approaching its 10-day (red) counterpart.
Although the longer-term momentum is slowing, the fact that the 10-day EMA is below the 25-day line means that an upside crossover could lead to a bullish run.
If this happens, there is a good chance that the Bulls will aim to recapture the 2,000 points.
Hit the like button if you like it and share your charts in the comments section.
Thank you

Ethereum - 6 Possible Scenarios 🧠What's up, traders! In today's market breakdown, we're mapping out our latest levels to watch for on the ETH 30m chart.
Let's dive right in...
Ticker: ETHUSDT
Date: 05/10/23
Timeframe: 30min
Supply: 1875-1890 (1st red zone), 1915-1935 (2nd red zone)
Demand: 1780-1820 (green zone)
Commentary:
Major crypto as of 4PM ET stands exactly where it was before CPI data. Crypto has mainly followed the futures (ES and NQ) with price action today - rejecting supply levels to test major demand and then rallying back to break supply levels.
If major crypto is to continue following the futures, we are to see continuation on this move up. With the major pullback that we have seen since last Friday, the risk to reward also favors bullish bias.
With that in mind, however, we need to be option to trade all sides and there are a few scenarios we could target from here:
✅ Bullish Scenario 1: you want to see price pull back into the demand zone ~1780-1820 and buyers to emerge again for an upside move, possibly into ~1875-1890 supply or higher. This is the safer upside play.
✅ Bullish Scenario 2: you want to see price break above ~1875-1890 supply zone, pull back to retest this zone and turn it into demand to catch a break and retest for a further upside move, potentially into supply at ~1915-1935.
✅ Bullish Scenario 3: you want to see price rally and break both supply levels, pull back to retest ~1915-1935 zone and turn it into demand to catch a break and retest for a further upside move potentially into last weekend's highs.
🟥 Bearish Scenario 1: you want to see price move up and approach supply again at ~28650-28890, sellers to regain control and possibly catch a retest of this supply zone into demand at ~27660-27960 again. This will be the safer downside play.
🟥 Bearish Scenario 2: you want to see price break demand here at ~27660-27960, retest and turn this demand into supply, and find weakness again for a move into ~26500-27000 demand.
🟥 Bearish Scenario 3: you want to see price break demand at ~26500-27000, retest and turn this zone into supply for a further downside move into ~25300.
That's all we got for you in this one.
So what do you think? Are you bullish or bearish?
Let us know in the comments below!
We'll see you in the next one.
-The AlgoBuddy Team

ETHLooks almost done working out sub wave 4 here. I been looking for $1,650-$1,700 TBH but bottom could already be in at the 382% of the 3

Look at these important levels for ETHA person asked me to give ETH a look, here are my thoughts:
The value lines are centers of contraction zones
There are quite a few imbalances that could be filled.
The zones I marked with circles are points of contraction in momentum, this is often followed by a big move up or down.
The recent contraction in momentum happened above a daily value line, which means a long would be taken, for now I wouldn't hop into an ETH trade, but I would wait for either retracement to one of the imbalances or the Bullish Order Block. Make sure to look at momentum at each of these levels, you can make an alert at each price point
**TPI FOR ETH**
The trend probability for eth is still quite neutral, but we have seen a couple of signals
ETH also seems to be flat on its performance, compared to BTC, so you wouldn't be taking on much more risk by swinging longs on ETH than on BTC:
Hope this helps a bit

Looking to Short Crypto, Starting with ETH & BTCTrade Idea Following what bitcoin is doing on HTF, and from the look of it btc is reacting to weekly supply/resistance zone and its ready to drop in few days... its in the phase of distribution and its pretty visible on 1D and 4H chart
1D BTC
4h BTC
So now we waiting for price developments further as we reach that 4h supply
What I like most about this is that we respected supply and tapped into that HTF FVG as we swept that daily/4h high, which gives us more confluences for this trade idea to work
4H

ETH/USDT 1DAY UPDATE BY CRYPTOSANDERSHello, welcome to this ETHEREUM /USDT update by CRYPTO SANDERS.
CHART ANALYSIS:- ethereum (ETH) was also in the red on Monday, with prices plunging below 1,900
Following a high of 1,934.00 on Sunday, ETH/USDT dropped by almost 100, hitting a low of 1,839.89 earlier in the day.
Similar to Bitcoin, today’s decline saw the world’s second-largest cryptocurrency fall for its third consecutive day.
it appears that ethereum bears are now attempting to take the RSI to its own point of support at 45.00.
Currently, the index is at the 47.02 level, having recently moved below a higher support point of 49.00.
Should price strength hit the target of 45.00, there is a possibility that ETH will be trading under 1,800.
Hit the like button if you like it and share your charts in the comments section.
Thank you

ETH - BreakoutAbout to break out from the consolidation trend.
Wait for the below confirmation
1. MA Cross
2. Super trend becomes green

Ethereum to face rejection from short-term range highs?ETH has traded within a range from $1800 to $1965 over the past two weeks. Aggressive bears can wait for a rejection from $1965-$1980 region over the next 12 hours before looking to short.
A breakout past $2000 will invalidate the idea.
Entry: $1960
Exit: $1805
Stop-loss: $2010
R:R- 3

ETH: head & shoulder pattern formed on 1 hr TFclear bearish H&S pattern on ETHUSDT pair. In the short term a drop to 1600s area is likely. Wrong above 1931.


ETH ShortA close on htf under the channel looks like a solid short opportunity. Targets included. Most likely reversal point imo would be near the midline of the large downwards channel.

Block earns $2.16 billion in bitcoin revenue in Q1, up 25% year-Financial technology company Block (SQ) said in a shareholder letter Thursday that its Cash App unit generated $2.16 billion in bitcoin revenue in the first quarter, up 18 percent from $1.83 billion in the fourth quarter and up 25 percent from the first quarter of 2022, with Block taking total bitcoin sales as revenue. Cash App generated $50 million in gross bitcoin profit in the first quarter, up 43% from the fourth quarter and up 16% year-over-year. The company as a whole reported first quarter gross profits of $770 million, up 16% year-over-year. The company did not take an impairment loss on its bitcoin holdings in the first quarter due to the increase in the price of bitcoin. block reported an impairment charge of $9 million on its bitcoin investments in the fourth quarter and $47 million for the full year 2022. As of March 31, Block held bitcoin with a fair value of $229 million, compared to a carrying value of $126 million recognized on the balance sheet.

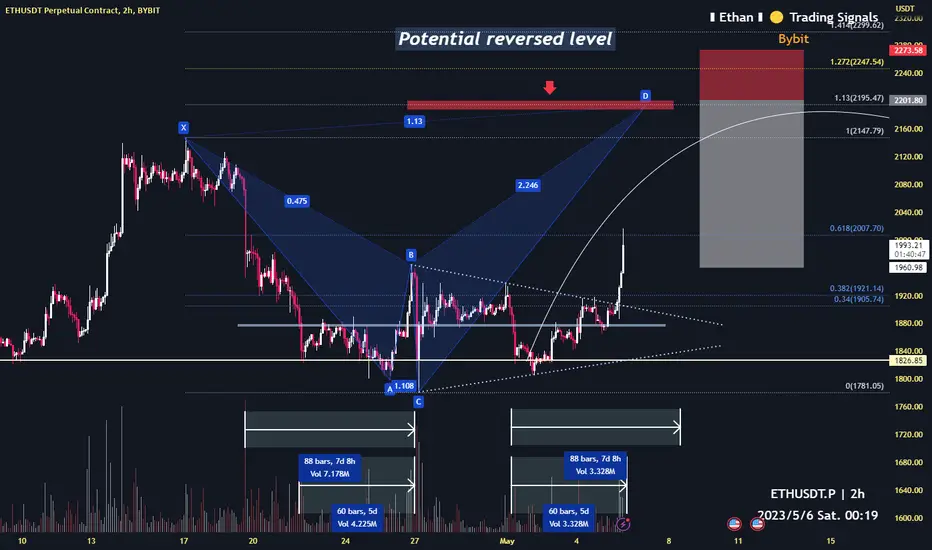
Ethereum as we predicted (pump this week)Potential reversed level as analysis on chart
Stay prepared
Eth shortOn a Rising Wedge, and on a Higher tf decending triangle resistance and watching a liquidity sweep

ETH/USDT 1DAY UPDATE BY CRYPTO SANDERS !!Hello, welcome to this ETHEREUM /USDT update by CRYPTO SANDERS.
CHART ANALYSIS:-Ethereum Analyzing the daily chart, the price previously formed a higher pattern before experiencing a significant decline. The 50-day moving average at $1.8K acted as a support level, casting a significant shadow on the daily charts and substantial volatility on the lower time frames.
Currently, ETH is confined within a narrow dynamic range between the 50-day EMA, which is currently at $1931, and the key resistance area at $2K.
If the price manages to overcome the $2K resistance and surpass its previous high at $2.1K, it could potentially trigger an extended rally. Conversely, if there is a break below the 50-day EMA, the 100-day moving average at $1.7K will become a primary support level.
Hit the like button if you like it and share your charts in the comments section.
Thank you

BTC will show an increase by donating 1000 USDTMay 5 - OpenSats, a nonprofit organization focused on Bitcoin and other projects, announced that it has received a $10 million donation from Jack Dorsey's philanthropic initiative that will be used to support the development of free open source software and projects focused on Bitcoin, the decentralized social protocol Nostr, and related technologies. All donated funds will be allocated to projects reviewed by OpenSats' board of directors. startsmall's donation includes funding for OpenSats' operating budget, and in addition, half of the donation amount ($5 million) will be used to advance the growing new Nostr ecosystem. openSats said it has established a committee of Nostr developers committee, including fiatjaf and NVK, who will help OpenSats evaluate the contribution of projects and protocols.

Ethereum shortEthereum is testing the strong resistance level and bonsing off the descending trendline. Decline to support level at 1808 is possible.
