#ETH/USDT#ETH
The price is moving within a descending channel on the 1-hour frame, adhering well to it, and is heading toward a strong breakout and retest.
We are experiencing a rebound from the lower boundary of the descending channel, which is support at 2460.
We are experiencing a downtrend on the RSI indicator, which is about to break and retest, supporting the upward trend.
We are heading toward stability above the 100 moving average.
Entry price: 2540
First target: 2582
Second target: 2646
Third target: 2717
Ethshort

ETH-----Sell around 2525, target 2475 areaTechnical analysis of ETH contract on June 14:
Today, the large-cycle daily level closed with a small negative line yesterday, the K-line pattern continued to fall, the price was below the moving average, and the attached indicator was dead cross. The decline in the big trend is still very obvious, but we still have to pay attention to the stimulus brought by the news data. The low support is still around the 2300 area; the short-cycle hourly chart yesterday's European session rose and corrected the US session. The price began to retreat under pressure in the Asian morning today. The current K-line pattern is continuous and the price is below the moving average. The attached indicator is dead cross, so it is likely to continue to fluctuate downward during the day.
ETH short-term contract trading strategy:
The current price is 2525, directly short, stop loss in the 2565 area, and the target is the 2475 area;

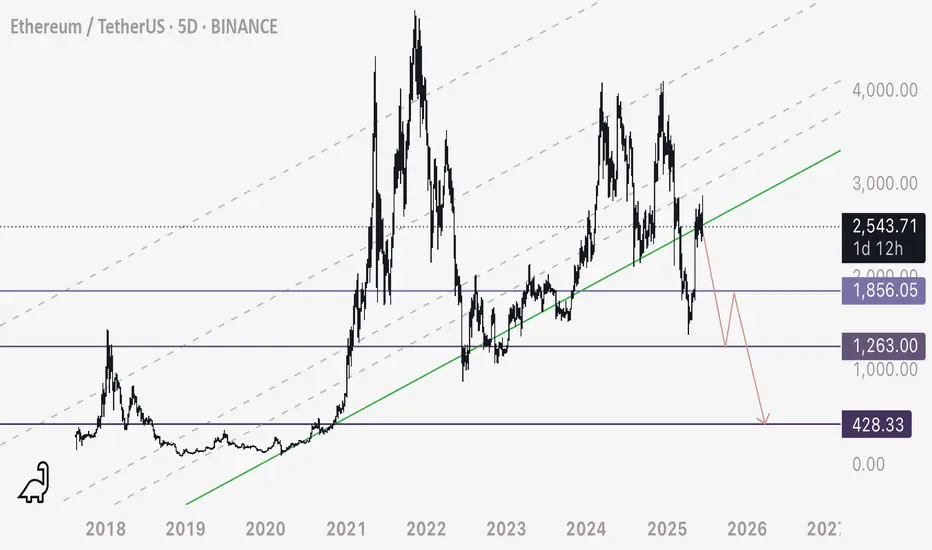
ETH - Another Take - When in Doubt, Zoom OutETH on the multi day time frame appears to have been respecting this ascending series of support / resistances since its inception.
If this resistance holds, this is a major breakdown of ETH’s last support - assuming the chart does work best on these ascending channels (certainly has historically).
Due to this I am shorting ETH at 2550 appx - and my targets are marked on the chart (3 purple levels).
I don’t see why any formation on the chart should be dismissed if it has a strong interaction historically.
Let’s see what happens.
Happy trading
Ethereum (ETH/USDT) Breakout Watch ! Hello traders here is KingPro's analysis on Ethereum
📈ETH is at the critical resistance level strong closing above it could tiger a bullish move.
Current Price: $2,628
EMA 70 Support: Price is holding above the 70-period EMA ($2,577), showing bullish structure.
Support Zone: The area around $2,320–$2,400 is acting as a strong historical support, confirmed multiple times.
Supply Zone: Consolidation occurred near $2,570–$2,620, but price has broken above it — indicating accumulation.
Critical Resistance Area: Around $2,780–$2,800. This is a key level — a breakout above could lead to strong bullish continuation.
Next Target: $2,782.93 – price may retest this resistance as indicated by the projection arrow.
📊 Trade Idea:
If ETH sustains above $2,620 and breaks the short-term channel resistance, a move toward $2,782+ is likely.
🔒 Risk: A breakdown below the EMA or the supply zone (~$2,570) could invalidate the setup.


ETH/USDT 4HOUR CHART UPDATE !!ETH/USDT – 4H Chart Update
Ethereum is trading near an ascending channel's upper boundary, around the $2,790–$2,800 area. This level has historically acted as strong resistance, and we are seeing early signs of price hesitation.
ETH is testing the top of the channel. Rejection from this area could lead to a reversal towards the lower channel trendline near $2,450–2,500.
First Support: $2,600–2,620 (25MA and 100MA area).
Deep Support: $2,450 (Channel Bottom).
Strong Demand Area Below: $2,050–$2,150 (highlighted yellow box).
Moving Averages:
The 25MA (black) and 100MA (purple) are currently bullishly aligned.
Thanks for your support!
DYOR. NFA

$ETH - Top DownBYBIT:ETHUSDT.P Top Down (10/06/25)
V-Levels Bias
Weekly = Bullish
Daily - Bullish
10-Hour = Bullish
1-Hour = Bullish
V-Levels Momentum
Weekly = Bearish FA
Daily = Neutral
10-Hour = Neutral
1-Hour = IB Range (Neutral)
DeCode Market Breakdown
Macro Context
Weekly Chart
Strong bullish MS, printing clean HHs and HLs.
Price has rejected from the same V-Level multiple times.
Rejections are paired with high relative volume and aggressive selling footprints → indicates strong passive interest above.
This area is not ideal for aggressive long entries.
Daily Chart
Still in bullish structure, holding above key POCs and range lows.
The Failed Auction at IB lows has added fuel for upside momentum.
However, we’re trading right into a potential liquidity pocket just below resistance.
Context calls for a wait-and-see approach: either clear breakout or rejection confirmation.
Intraday Picture (10H & 1H)
10H Chart
Still within an Inside Bar (IB) range.
FA at range lows suggests momentum continues upward — but we are at the top of the range.
Key risk: trap above range highs → ideal area for shorts if we get absorption and selling imbalance.
1H Chart
Market is rotating inside the current IB range.
No breakout confirmed yet.
Best short setup: Rejection from IB Highs + Absorption on CVD / Footprint charts.
Breakdown scenario: Short on range low breakdown with volume confirmation.
Longs: Only valid if HTFs confirm breakout → then look for bullish retest or mid-retest entries.
⸻
Summary & Trade Plan
Big Picture: Still bullish, but this isn’t the area to long blindly.
Short Setup 1: Rejection from IB Highs with clear absorption + imbalance.
Short Setup 2: Breakdown below IB Range Lows with volume follow-through.
Long Setup: Wait for HTF confirmation of breakout. If confirmed → retest of prior resistance as support.
Final Notes
This is where traders get chopped. HTF resistance meets LTF momentum.
Let price prove itself. Let volume confirm the move.
No breakout = no long. No trap = no short.

It tapped the level I was watching. Now it’s time to act, not reBINANCE:ETHUSDT just kissed the 0.382 fib at 2479 — and that’s not coincidence. That’s engineered precision. Anyone still waiting for confirmation is late. The confirmation already happened.
Here’s the structure:
4H FVG sits just below, untouched. It’s a magnet — but we may front-run it.
Price reacted from the 0.382, aligning with volume and previous inefficiency.
The 1H OB above (2541–2585) is the first real test. Break it, and we’re looking for 2640+.
This isn’t trend-following. This is manipulation-following. Watch where price shouldn’t go — and then track where it chooses to go.
What I’m watching:
Long is active from the 2479–2441 zone
TP1: 2510 (half-level reclaim)
TP2: 2541–2585 OB sweep
Final target: 2640.86 (EQ of full move)
Invalidation: clean break below 2440 FVG
A level doesn’t need your belief to hold. It needs liquidity.
More setups — real Smart Money reads, not noise — are posted in the profile.

ETH is testing its resistance ETH may reject from its resistance line as ETH is showing weakness at around $2550 mark level, lets see and if it does it may go down to $2200 level. #ETH #BTC #crypto

#ETH/USDT#ETH
The price is moving within a descending channel on the 1-hour frame and is expected to break and continue upward.
We have a trend to stabilize above the 100 moving average once again.
We have a downtrend on the RSI indicator that supports the upward move with a breakout.
We have a support area at the lower limit of the channel at 2429, acting as strong support from which the price can rebound.
Entry price: 2535
First target: 2564
Second target: 2598
Third target: 2647

#ETH/USDT#ETH
The price is moving within a descending channel on the 1-hour frame, adhering well to it, and is heading for a strong breakout and retest.
We are seeing a rebound from the lower boundary of the descending channel, which is support at 2460.
We have a downtrend on the RSI indicator that is about to be broken and retested, supporting the upward trend.
We are looking for stability above the 100 moving average.
Entry price: 2506
First target: 2550
Second target: 2600
Third target: 2656

Technical analysis of ETH contracts (outlook for next week)Technical analysis of ETH contract on June 7 (next week outlook):
After the price rose last year and hit the high point of 4170, the weekly level has been fluctuating downward for four consecutive months this year. After the price rose sharply in May, it has maintained a high-level oscillation trend. The K-line pattern is single Yin and single Yang, and there is no signal of breaking; the daily level is still oscillating in the box, with a high point of 2780 and a low point of 2300; although the price is below the moving average, the attached indicator is dead cross, but the strength and continuation are the current problems; then the advantage of price decline in a short time is relatively large, the current high pressure of the four-hour chart and the hourly chart is near the 2533 area, and the low is near the 2450 area; in general, next week, before the price has no obvious break and trend signal, it is still necessary to follow the trend and still treat it as a range of fluctuations;

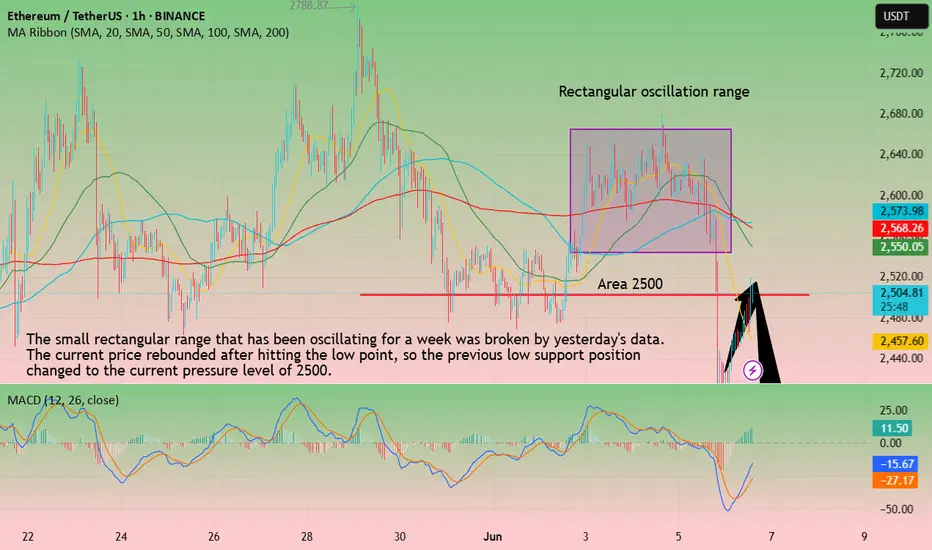
ETH-----Sell around 2500, target 2400 areaTechnical analysis of ETH contract on June 6:
Today, the large-cycle daily level closed with a large negative line yesterday, and the K-line pattern was still a single negative and single positive. The price was below the moving average. The attached indicator was dead cross. The bottom support position of the rectangle below was in the 2300 area. This is what we should focus on next week. Only when this position is broken, the overall downward trend will be formed and move downward; the short-cycle hourly chart maintained a range oscillation trend for a week. Under the stimulation of yesterday's data, it continued to break downward. It is necessary to pay attention to a top-bottom conversion pattern. The previous low support of 2500 has turned into the current pressure level.
ETH short-term contract trading strategy:
Short in the 2500 area, stop loss in the 2550 area, and the target is the 2400 area
No impulse here is random. Each wick is a message.ETH has been rotating around inefficiency — not in confusion, but in setup.
This isn’t sideways. It’s structured accumulation just beneath premium OB.
Here’s the narrative:
Price swept the local low, then tapped the 2,619.06 level — a key reaction zone
Above us: a 15M OB at 2,639.07 — this is where early longs will either get paid or punished
Below: 2,592.78, the real demand block — if we break down, that’s the last hold before structure flips
The volume profile shows clear interest at mid-range — meaning Smart Money isn’t chasing price. It’s absorbing.
Expectations:
Hold above 2,619 → target 2,639 and reevaluate
Failure below 2,592 → rotation opens into inefficiency
Execution plan:
Clean long above 2,619, invalidation below 2,592
Short only if price flips 2,639 and fails to hold it on the retest
This is a reaction zone — I’m not chasing. I’m positioned.
Don’t confuse consolidation with indecision. Smart Money’s already placed.
More trades mapped like this — before they move — are in the profile description.

They bought the dip. I anticipated the shift.This ETH setup didn’t require hopium — just structure, volume, and timing.
The chart respected every level I mapped days ago. And now? Price is setting the table again.
We swept liquidity below 2488.11 — textbook turtle soup into a bullish STB on the 1H.
Then price ripped clean into the 4H OB and tapped 2649.12 — the fib extension target. That’s not retail momentum. That’s interbank delivery at work.
Now we’re pulling back. And here’s where it gets clear:
The 0.5–0.618 zone sits between 2586.56–2571.80
It overlaps with the 1H STB zone — a demand pocket from the origin of the expansion
If price consolidates above 2550.78 (the 0.786) and flips 2564.83 again, I expect continuation back toward 2618.32 and 2648.46
If we sweep 2524.01 without reaction — then it’s a deeper rotation
This isn’t a “buy support” setup. This is a model-driven continuation based on structure and internal range logic.
Entry bias is valid above 2580. Below 2524 — it’s invalidated.
I don’t guess entries. I forecast structure.
More models and trades? Check the profile description. Precision lives there.

ETH/USDT 1DAY CHART UPDATE !!ETH has broken out of a long-term downtrend (black diagonal trendline) and is now in a consolidation phase below the $2,800–$2,850 resistance.
The price is currently $2,612, showing hesitation below the key horizontal resistance.
Resistance Zones:
$2,800–$2,850: Key horizontal resistance. Breaking above this confirms bullish continuation.
$3,200 and $3,600: Medium to long-term bullish targets.
Support Zones:
$2,000–$2,200: Strong horizontal support + ascending trendline + 50 EMA (red line)
$1,410: Key long-term support (unlikely to be tested soon unless the market reverses)
ETH breaks and closes above $2,850 ➝ $3,200 → $3,600 → $3,800+ likely to rise
The structure suggests that a higher low will likely form before the breakout.
If ETH rejects at $2,850, expect a retest of $2,000–$2,200 (golden zone)
This would create a bullish higher low setup and could be a strong buy-dip opportunity.
Thanks for your support!
DYOR. NFA

Price doesn’t chase liquidity. It engineers it.ETH is mid-delivery — not in trend, not in reversal — but in execution. This is where most get faked out. I’m just reading the structure.
Here’s the play:
We’ve tapped into the FVG 4H, reacting from an inefficiency left by the last aggressive selloff
Above that, the BPR 4H marks a supply zone engineered for reaction, not breakout — that’s where early longs will get tested
Fib levels are clean: price is hovering around 0.5 (2,623.76), with clear tolerance for a dip into the 0.618–0.786 (2,584–2,528)
Two paths from here:
A clean push into 2,662.89 → 2,711.32, possibly even sweeping into 2,789.59, followed by rejection from premium imbalance
A deeper pull into OB 4H at 2,457.92 before any real mark-up begins
Execution mindset:
Intraday longs are valid as long as we hold above the 4H OB
HTF liquidity targets sit above 2,660 — but the smarter entries were already taken lower
If we reject the BPR without breaking 2,662, I expect a controlled drop back into discount
This isn’t a breakout. It’s a rebalancing. You don’t follow price. You align with its logic.
For more setups with structure, not noise — check the account description.

ETH/USDT 4H Chart Analysis – Bullish Continuation with Profit You're currently in a solid long position from 2,476.60, and with the price now at 2,537, your unrealized P&L shows strong gains (+$6,322.66). The technicals support your trade with the following highlights:
📊 Key Technical Insights:
Entry Zone: 2,476 – 2,488 (ideal long from OB + 0.786 fib retrace)
OB 4H Supply Target: 2,616.99 – potential area of resistance
Current Price Reaction Zone:
2,550 tapped and acting as interim resistance
Midterm pullback expected toward 2,514–2,490 before another leg up
🎯 Targets:
TP1: 2,550 (hit)
TP2: 2,616.99 (next key resistance/OB)
TP3: Trail to 2,660+ if momentum sustains
🛑 Stop-Loss Consideration:
Below 2,474 = invalidation of structure reclaim
🔁 Possible Scenarios:
Continuation to OB 4H
✔️ Breaks and holds above 2,550
✔️ Momentum push to 2,616
Retest Before Push
🔁 Pullback to 2,514 or 2,488 zone
🔁 Reaccumulation for next move
Failure Risk
❌ Rejection from 2,550–2,560
❌ Break below 2,474 = setup invalidated
📌 “Strong move off the lows with excellent risk-reward. Watch OB 4H at 2,616 closely for next decision zone.”


ETH 4H Setup – Double Tap Reversal + Fib TargetsEthereum has printed a double bottom wick rejection just above the 2,468 level and is now attempting a breakout above the local range high. Price has reclaimed structure, indicating potential momentum toward key fib resistances.
Key Technical Zones:
Support Zone: 2,468 – local double bottom (0% fib)
Breakout Level: 2,544 (0.236 fib)
Targets:
TP1: 2,590
TP2: 2,628
TP3: 2,666 (0.618 fib / likely exhaustion zone)
Scenario Outlook:
🟩 Bullish Path:
Strong rejection from 2,468 confirms demand
Push through 2,544 unlocks path to mid 2,600s
Trend continues if macro holds above 2,500
🟥 Bearish Reversal:
Rejection near 2,590–2,666
Bearish engulfing back below 2,507 invalidates this long setup
Could revisit 2,468 and break to 2,440s
Play Idea:
Entry: Reclaim 2,544 with confirmation
SL: Below 2,496
TP1: 2,590
TP2: 2,628
TP3: 2,666
📌 “ETH bulls defend the low — the battle now shifts to mid-range fib control.”

The wick was the test.Ethereum just kissed the 1.0 fib at $2475.33, tapping into a local demand pocket. That sweep cleared weak longs and set up a cleaner drive back into inefficiency.
What’s happening?
→ ETH is targeting the 1H Fair Value Gap (FVG) around $2512–$2522.
→ $2500 zone = critical reaction level.
→ Volume profile confirms buyer interest above $2480.
Entry Zone: $2480–$2490
SL: Below $2475 swing low
TP1: $2512.75
TP2: $2550.14 (liquidity sweep)
Bias: Bullish while above $2475
Why it matters:
ETH rejected the lows and reversed with structure + timing.
If it reclaims the FVG → it reclaims the narrative.

Ethereum D1 Chart Update Hello Traders,
As you can see that there SBR Zone maintained with RSI DIV as long SBR zone maintained market remains Bearish for shorter Term
once market will break SBR and turned SBR to RBS the it will move towards 3500 or even 3900
Disclaimer: Forex is Risky

ETH is compressing for one reason — delivery.This isn’t just sideways chop. This is coiled intent.
ETH is sitting on top of the 0.618 fib at 2,496.25, after a controlled retracement from 2,546.84. We’ve printed a minor sweep below local lows into a high-volume shelf — exactly where Smart Money wants to reaccumulate.
A 1H Fair Value Gap is forming between 2,505–2,515. That’s the inefficiency that price is magnetized to. It will either reject there (distribution) or displace above it and flip the narrative bullish.
The decision is not in guessing direction — it’s in watching how price interacts at the FVG.
If we break and hold above 2,527.52 (0.236), the draw becomes clear: 2,549.69 and beyond.
Execution focus:
🔄 Current range: 2,496–2,505 (PD array and FVG base)
🔺 Bullish trigger: reclaim 2,515.57 and hold
🎯 Target: 2,549.69
🔻 Bearish scenario: rejection at FVG → continuation to 2,464.97 (final sweep zone)
Let others predict.
I just read the imbalance — and position accordingly.
