ETHUSD SELL IDEAAfter a nice 3 day bull run we finall broke 2k. I think before we can see anymore upward movement we will have to retest the 2k level.
Ethshort

Eth/usdt shot callEtherium is currently testing resistance,
most probably it will come back to rising support
SELL (Current market price) : 2005
SL : 2025
TP : 1982
If the stoploss is hit, we will take long position.

ETH/USD 1DAY UPDATE BY CRYPTO SANDERS !!Hello, welcome to this ETHEREUM /USD update by CRYPTO SANDERS.
CHART ANALYSIS:-Ethereum Buoyed by the Shanghai update, Ethereum outperformed BTC in today's session, gaining nearly 7% in the process.
ETH traded at 1,882.37 in today's session, up from a peak of 2,007.05 a day earlier.
As a result of today's increase in value, the world's second-largest cryptocurrency reached its highest level since last August.
The 75.00 resistance level appears to be the next hurdle for the bulls, and should the momentum continue in the uptrend, ETH could move above 2100 this week.
I have tried to bring the best possible outcome to this chart.
Hit the like button if you like it and share your charts in the comments section.
Thank you

$eth shanghai short | $1777 tpshorted eth this morning after the cpi pop.
htf looks like poo. was expecting btc to pop more after a positive cpi reading, but looks like it's gonna fully retrace the morning run.
ethbtc htf looks awful.
still think alts are the short here.

ETH/USD 1DAY UPDATE BY CRYPTO SANDERS !!Hello, welcome to this ETHEREUM /USD update by CRYPTO SANDERS.
CHART ANALYSIS:-Ethereum fell below the 1900 level during today's session, losing almost 3% in the process.
After hitting a high of $1923.81 on Tuesday, ETH/USD fell to a low of $1860.04 earlier in the day.
Today's move came as ETH declined below the key 1915 resistance level, with the 1830 bottom a potential target for sellers.
I have tried to bring the best possible outcome to this chart.
Hit the like button if you like it and share your charts in the comments section.
Thank you

SHORT PLAN for Ethereum upcoming upgradeBYBIT:ETHUSDT.P
4h time frame
-
Ethereum's Shanghai upgrade is imminent.
Also, we can notice there is a potential double top structure forming.
Try to short it if break down that uptrend line.

ETH/USDT weekly Hi,we are on the weekly time frame for ETH/USDT as we see we are in a channel and the end of trend is going slowly but the biggest problem is hidden divergence or HD- on the RSI so can expect to have frome ETH to make a lower low to get a RD+ on the RSI and after that we can say the bullish market is starting, I have to say this HD- is clearly showing on BTC/USDT and many other big currencies chart so we can say the down trend is exist on weekly charts.
this is just on of scenarios and can be failed so there is no advice to make decision on this analysis.

ethusdt Setup for Next MoveEtherium is look like Bearish when it Touch 2150 so Bear structure invalidation is 2173
we can short it at the price of 2150 our stoploss will be 2173
DYOR

ETHUSDTI think Ethusdt first should crash to 600-800$ then that could lead to raising and breaking themself historical top prices, Please share with me your ideas about Ethuasdt

ETH/USDT🔵🐇 #ETH/USDT
🪄 ETH Scalp Position Based On Fresh Liquidity and Order Blocks and Structures
#eth #btc #bitcoin #ethereum #cryptocurrency #crypto #Trade #trading #Trader #Signal #forex #Scalp #altcoins #chart #RTM #ICT
@aliceinmoneyland

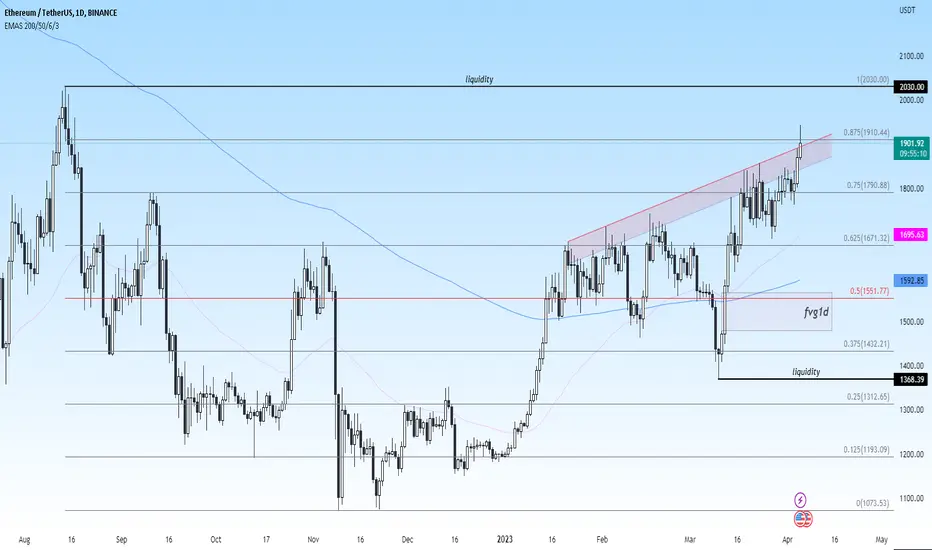
Ethereum - Buy The Rumor, Sell The News? 😳What’s up traders. In today’s trading idea, we discuss our thoughts on Ethereum.
Taking a look at the Daily chart, we’ve mapped out a few key levels & zones.
The story for Ethereum will be similar to our previous post on Bitcoin, in terms of where we think the 2nd largest crypto is headed.
If you haven’t heard, the Ethereum network is about to undergo the highly anticipated Shanghai upgrade on April 12th.
Simply put, this upgrade will allow investors (validators of the network) to withdraw their ETH that has been staked since December of 2020 (massive unrealized gains sheesh).
Right now, staked ETH accounts for 1/7th of the entire supply, 16 million tokens valued at over HKEX:26 billion.
Will a massive price dump follow?
Without diving too deep into the technicalities of the Shanghai fork, a subsequent dump could likely be in the cards.
Scenario 1: Bull Case
We see a continued push from Bitcoin, driving Ethereum up. We’re currently in an ascending triangle / bull flag, so a breakout to previous highs wouldn’t be surprising. HKEX:2 ,000 ETH definitely in the cards (Round number pseudoscience).
If we can surpass the 2K barrier, consolidate above combined with a bullish Bitcoin. Taking longs right now don’t sound too shabby.
Scenario 2: Bear Case
The bearish scenario would entail a “Buy The Rumor, Sell The News” situation. Where this push we’ve witnessed in recent days/weeks is due to the hype surrounding the Shanghai Upgrade.
A dip back down the 1400-1500 levels might be a solid spot if you want to look at getting long. If we see a severe dip from Bitcoin, and end up retouching the 1000-1200 levels. We’d be looking to buy & hold as those prices would be quite appetizing.
As always, NONE of this is financial advice. Trade, and invest at your own risk. This is for educational and entertainment purposes only, and we are in no way shape or form financial advisors.
Eyes peeled out there team. See ya in the next one.

ETH/USD 1DAY UPDATE BY CRYPTO SANDERSHello, welcome to this ETHEREUM /USD update by CRYPTO SANDERS.
CHART ANALYSIS:-Ethereum The price started today's session in the green as it attempted to move back toward the 1900 level.
After a low of 1845.99 on Friday, ETH climbed to a peak of 1879.11 to start the weekend.
The world's second-largest cryptocurrency broke a two-day losing streak after holding above a floor at 1830.
Ethereum price strength remains below support at 61.00.
The 14-day RSI is tracking at 60.42, and should there be a breakout, the price would be more likely to move above 1900.
I have tried to bring the best possible outcome to this chart.
Hit the like button if you like it and share your charts in the comments section.
Thank you

Ethereum Analysis: Head & Shoulders Pattern ConfirmedGreetings everyone,
I am writing this post to share my recent experience trading Ethereum. I have been closely monitoring the 30-minute chart and have identified a Head & Shoulders pattern, which has since been confirmed with a break of the neckline.
To manage my risk, I have placed a stop loss at the halfway point between the two shoulders of the pattern. This will help me limit my potential losses in case the price moves against my position.
As always, it's important to keep a close eye on the market and be prepared to adjust your strategy as needed. I look forward to hearing your thoughts and insights on Ethereum's current price action.

ETHUSD POSIBILITIESThis asset has been trailing an ascending trendline. it is currently about to hit the TL again.
there is likely a break through to the downside id fundamental favours this prediction

ETH SHORTif retest poc at 1865 then I think drop to 1825-1800 is very possible
that's only my opinion DYOR

ETH/USD 1DAY UPDATE BY CRYPTO SANDERS !!Hello, welcome to this ETHEREUM /USD update by CRYPTO SANDERS.
CHART ANALYSIS:-Ethereum (ETH) was also lower today, as prices slipped from an eight-month high the day prior.
Following a high of $1,924.47 on Wednesday, ETH/USD dropped to an intraday low of $1,859.00 earlier in the day.
As a result of this decline, ethereum has fallen from its strongest point since Aug. 17, when the price peaked at $1,957.
today’s drop resulted from the RSI hovering below a recent support point of 61.00.
Overall, it appears that earlier bulls have moved to take profits, ahead of the upcoming uncertainty in the market.
At the time of writing, ethereum is trading at $1,871.63.
I have tried to bring the best possible outcome to this chart.
Hit the like button if you like it and share your charts in the comments section.
Thank you

ETH/USD 1DAY UPDATE BY CRYPTO SANDERS !!Hello, welcome to this ETHEREUM /USD update by CRYPTO SANDERS.
CHART ANALYSIS:-Ethereum (ETH) was also in the green, with prices climbing to a fresh eight-month high.
ETH/USD moved to a high of $1,921.27 earlier in the day, which comes a day after trading at a low of $1,855.37.
As a result of this rally, ethereum went back to its strongest point since August 17, when the price hit a peak of $1,957.
This latest surge has pushed price strength to a current reading of 65.87, which is marginally below a ceiling of 66.00.
Due to this, some earlier bulls have moved to take profits, which has led to ETH falling from the day’s high.
At the time of writing, ethereum is trading at $1,915.88.
I have tried to bring the best possible outcome to this chart.
Hit the like button if you like it and share your charts in the comments section.
Thank you

#ETH HTF update... #ETH HTF update...
#Ethereum is strong AF, while the #Shapella (shanghai) update is coming up on April 12th...
Lets watch if $ETH will claim 0.875 fib today with the daily candle...
ETH(based on NEo wave)well, its a high copy of bitcoin pattern...:D
I updated the last analysis, that want a triangle.
I will sell all of ETH I have and wait to by it on 1400 zone,I will update it maybe lower or higher price for buying.

ETH/USD 1DAY UPDATE BY CRYPTO SANDERS !!Hello, welcome to this ETHEREUM /USD update by CRYPTO SANDERS.
CHART ANALYSIS:-Ethereum (ETH) was mostly higher in today’s session, as bullish sentiment made an unexpected return.
Following a low of $1,771.15 to start the week, ETH/USD climbed to an intraday high of $1,871.35 on Tuesday.
Tuesday’s rally saw bulls push ethereum back to its strongest point since August 17, when the price hit a peak of $1,957.
One of the catalysts for today’s surge appears to be a breakout at the 61.50 zone on the RSI indicator.
Currently, price strength is tracking at 62.54, with an upcoming ceiling of 65.00 a possible destination for bulls.
Should this point be hit, there is a good chance ETH will be trading at $1,900.
I have tried to bring the best possible outcome to this chart.
Hit the like button if you like it and share your charts in the comments section.
Thank you

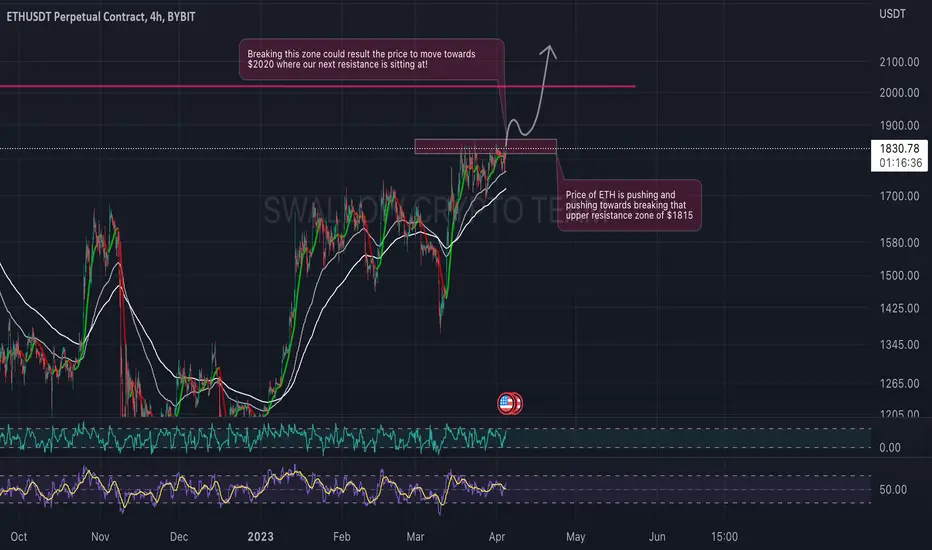
ETH/USDT might have some major movementHey guys 👋
Let's kick off this day with ETH coin where price is on another attempt to breakout that upper zone. We see how many attempt Ethereum has had but every one of them failed. We see a good chance for a breakout to happen here as EMAs are closer to market price and RSI has done a nice crossover as well. Waiting for some volatility to occur here soon which should result the breakout of current zones!
If you like ideas provided by our team you can show us your support by liking and commenting.
Yours Sincerely,
Swallow Team 🔱
Disclamer:
We are not financial advisors. The content that we share on this website are for educational purposes and are our own personal opinions.
ETH/USD 1DAY UPDATE BY CRYPTO SANDERS !!Hello, welcome to this ETHEREUM /USD update by CRYPTO SANDERS.
CHART ANALYSIS:-Ethereum (ETH) continues to trade above the $1,800 level, with traders still targeting a breakout above a key resistance level.
ETH/USD rose to a high of $1,819.29 earlier in today’s session, which comes after an earlier bottom at $1,765.52.
As a result of today’s jump, ethereum bulls attempted to move towards a ceiling at $1,825, however, momentum has since eased.
This comes as earlier bulls seemingly abandoned their positions as the RSI ran into a wall at the 60.00 level.
At the time of writing, price strength is now at the 57.77 mark, with the next visible ceiling around the 62.00 regions.
In addition to this, the 10-day (red) moving average is now nearing a downward cross with its 25-day (blue) counterpart, which could signal upcoming price weakness.
I have tried to bring the best possible outcome to this chart.
Hit the like button if you like it and share your charts in the comments section.
Thank you

ETH/USD 1DAY UPDATE BY CRYPTO SANDERS !!Hello, welcome to this ETHEREUM /USD update by CRYPTO SANDERS.
CHART ANALYSIS:-Ethereum (ETH) was also higher to start the weekend, with prices once again climbing above the $1,800 level.
Following a low of $1,789.76 on Friday, ETH/USD raced to a peak at $1,844.68 earlier in today’s session.
As a result of the move, the world’s second-largest cryptocurrency jumped over a ceiling at the $1,825 zone.
From the chart, this seemingly coincided with the RSI breaking free of a resistance of its own at 59.00.
At the time of writing, price strength is now at the 60.15 mark, with the next visible ceiling around the 62.00 regions.
Should the RSI move closer to this point, ethereum bulls will send prices toward a long-term target of $1,900.
I have tried to bring the best possible outcome to this chart.
Hit the like button if you like it and share your charts in the comments section.
Thank you
