ETH/USD 1DAY UPDATE BY CRYPTO SANDERS !!Hello, welcome to this ETHEREUM /USD update by CRYPTO SANDERS.
CHART ANALYSIS:-Ethereum (ETH) also retreated from recent gains, with prices giving up a five-month high.
ETH/USD surged to a peak of $1,704.46 on Thursday, which was its highest point since September 13.
However, with the NFP fast approaching, market momentum has marginally moved, with ETH falling to a low of $1,634.22 earlier in the day.
Looking at the charts, selling has also taken place with the RSI below the 63.00 mark, which appears to be an interim point of resistance.
At the time of writing this, the index is tracking at 62.92, with the Doji candlestick being the current print on today's chart.
It usually indicates indecision and uncertainty, with neither the bears nor the bulls able to capture the market sentiment.
I have tried to bring the best possible outcome to this chart.
Hit the like button if you like it and share your charts in the comments section.
Thank you
Ethshort

eth deviation above local high | $1430 min targetgot bearish right before fomc. thought we'd lose the TL only to have it pump in my face lol
feels like deviation as powell is once again a local top.
$1430 min target, although i think this could go much lower.
let's send this back home.

ETH/USDT 1DAY UPDATE BY CRYPTO SANDERS!!Hello, welcome to this ETHEREUM /USD update by CRYPTO SANDERS.
CHART ANALYSIS:-Ethereum (ETH) also made significant gains in the last 24 hours, as traders pushed prices close to the $1,700 mark.
Following a low of $1,566.86 on Wednesday, ETH/USD raced to a peak of $1,689.07 earlier in today’s session.
This rally in price saw ethereum move to its highest mark since September 12, when ETH reached a top at $1,761.
Looking at the chart, today’s five-month high came as ETH broke out of its long-term price ceiling at $1,670.
Although one point of resistance has been broken, ethereum bulls are fast approaching another, with the relative strength index (RSI) nearing a ceiling at 68.00.
Currently, the index is tracking at 65.19, with earlier bulls likely to consider taking profits before a full collision occurs.
I have tried to bring the best possible outcome to this chart.
Hit the like button if you like it and share your charts in the comments section.
Thank you

ETH/USD 1DAY UPDATE BY CRYPTO SANDERS !!Hello, welcome to this ETHEREUM /USD update by CRYPTO SANDERS.
CHART ANALYSIS:-Ethereum (ETH) moved slightly higher on Wednesday, with the price approaching the $1,600 area.
ETH/USD reached a peak of $1,598.52 on the first day, which comes after falling to a low of $1,569.04 the day before.
Like bitcoin, ETH bulls were unable to push the price above resistance, with earlier momentum waning as of writing.
From the charts, it appears that there has been a change in sentiment as the RSI was unable to overcome its own high at 58.00.
Currently, the index is tracking at 57.64, with the 10-day (red) moving average also changing its trend, and is now on the downside.
Should this sentiment continue, there is a high probability that ETH will drop to a low of $1,550.
I have tried to bring the best possible outcome to this chart.
Hit the like button if you like it and share your charts in the comments section.
Thank you

eeth short | $1350 targetfeels very weak here. probably should wait until after fomc. think we'll retrace a good portion of this move.
$1350ish target.
good luck.

ETH/USD 1DAY UPDATE BY CRYPTO SANDERS !!Hello, welcome to this ETHEREUM /USD update by CRYPTO SANDERS.
CHART ANALYSIS:-Ethereum (ETH) was also in the red in today’s session, with prices falling further below $1,600.
Following a high of $1,595.86 to start the week, ETH/USD slipped to an intraday bottom of $1,546.66 on Tuesday.
Since hitting a then four-month high of $1,680 on January 21, the world’s second-largest cryptocurrency has mostly consolidated.
Many in the market somewhat saw this coming, due to prices being significantly overbought, with the RSI hovering between 70.00 and 87.00.
Price strength has since weighed heavily, and at the time of writing, the index is currently tracking at 57.02.
ETH has already rebounded from earlier lows and is currently trading at $1,571.37, with bulls sure to make another run toward the $1,600 zone.
I have tried to bring the best possible outcome to this chart.
Hit the like button if you like it and share your charts in the comments section.
Thank you

ETH/USD 1DAY UPDATE BY CRYPTO SANDERSHello, welcome to this ETHEREUM /USD update by CRYPTO SANDERS.
CHART ANALYSIS:-Ethereum (ETH) also edged lower to start the week, as sentiment shifted following a breakout of the $1,600 level
ETH/USD slipped to a bottom of $1,582.18 earlier in the day, as bulls were unable to sustain Sunday’s high at $1,653.73.
Yesterday’s peak saw the world’s second-largest cryptocurrency climb to its strongest point in one week, however, traders used this as an ideal moment to secure recent gains.
The move saw ethereum marginally break out above a ceiling at $1,650, however bearish sentiment around this mark has reigned supreme over the last three months.
A breakout below a floor of 60.00 on the RSI also contributed to the decline, with the index now tracking at 58.40.
In the event today’s decline continues in the coming days, it is possible that ETH could be heading towards a floor at $1,550.
I have tried to bring the best possible outcome to this chart.
Hit the like button if you like it and share your charts in the comments section.
Thank you

ETH Swing ShortIm going for a high leverage ETH swing short, If you see what I'm seeing (HNS) you would understand what I'm saying!
100x Leverage
SL 16.14.82
ENTRY 1606.25
TP 1457.97

ETHERIUM ETH On The 4 Hour Chart.. SHORT ETHEREUM is showing lots of resistance at the 1645 LVL and could possibly Head back down to test these key areas of NOW Support.

Ethereum to extend it's loses?Ethereum - 24h expiry - We look to Sell a break of 1508 (stop at 1551)
Short term momentum is bearish.
Short term bias has turned negative.
A break of the recent low at 1519 should result in a further move lower.
There is no clear indication that the downward move is coming to an end.
Our profit targets will be 1401 and 1381
Resistance: 1560 / 1585 / 1600
Support: 1520 / 1500 / 1450
Please be advised that the information presented on TradingView is provided to Vantage (‘Vantage Global Limited’, ‘we’) by a third-party provider (‘Signal Centre’). Please be reminded that you are solely responsible for the trading decisions on your account. There is a very high degree of risk involved in trading. Any information and/or content is intended entirely for research, educational and informational purposes only and does not constitute investment or consultation advice or investment strategy. The information is not tailored to the investment needs of any specific person and therefore does not involve a consideration of any of the investment objectives, financial situation or needs of any viewer that may receive it. Kindly also note that past performance is not a reliable indicator of future results. Actual results may differ materially from those anticipated in forward-looking or past performance statements. We assume no liability as to the accuracy or completeness of any of the information and/or content provided herein and the Company cannot be held responsible for any omission, mistake nor for any loss or damage including without limitation to any loss of profit which may arise from reliance on any information supplied by Signal Centre.

ETH/USD 1DAY UPDATE BY CRYPTO SANDERS !!Hello, welcome to this ETHEREUM /USD update by CRYPTO SANDERS.
CHART ANALYSIS:-Ethereum (ETH) also shifted on Wednesday, with prices falling below a recent support point at $1,600.
ETH/USD slipped to a bottom of $1,530.80 on Wednesday, following a peak of $1,630.47 during Tuesday’s session.
Since breaking out of its $1,600 floor, ethereum appears to be heading towards a lower level of support at $1,500.
today’s red wave comes as bears have finally opted to reenter the market, as a result of prices being overbought.
Ethereum’s 14-day RSI is currently sitting at 61.07, which is its lowest point since January 8, and this comes a day after breaking out of a floor at 74.00.
There appears to be an upcoming support area at 58.00, and if this remains firm, ETH could manage to stay above $1,500.
I have tried to bring the best possible outcome to this chart.
Hit the like button if you like it and share your charts in the comments section.
Thank you

ETH/USDT 12Hr UPDATE BY CRYPTO SANDERS !!Hello, welcome to this ETHEREUM /USD update by CRYPTO SANDERS.
CHART ANALYSIS:-Ethereum (ETH) is retesting the descending channel. The current short-term resistance level is $1530.
To continue the bullish momentum in the market, the bulls need to clear the $1530 resistance.
In case of a failed retest of the descending channel, $1.5K is a strong support level for the bulls to make higher lows at that level.
I have tried to bring the best possible outcome to this chart.
Hit the like button if you like it and share your charts in the comments section.
Thank you

ETH/USD 1DAY UPDATE BY CRYPTO SANDERS !!Hello, welcome to this ETHEREUM /USD update by CRYPTO SANDERS.
CHART ANALYSIS:-Ethereum (ETH) somewhat slowed in today’s session, with the price approaching its floor at $1,600.
Following a high of $1,658.02 to start the week, ETH/USD dropped to a bottom of $1,609.16 earlier in the day.
Sentiment in the world’s second-largest cryptocurrency seems to have already shifted, with several dojis (candlesticks signaling reversal) appearing on the chart.
As can also be seen on the chart, the RSI is currently hovering slightly above a floor at 74.00, which is a current reading of 74.07.
Should a breakout take place, bearish pressure will likely increase, with traders potentially eyeing a move under $1,600.
I have tried to bring the best possible outcome to this chart.
Hit the like button if you like it and share your charts in the comments section.
Thank you

Ethereum under bearish divergence.Ethereum - Intraday - We look to Sell a break of 1599 (stop at 1637)
We are trading at overbought extremes.
Although the bulls are in control, the stalling positive momentum indicates a turnaround is possible.
Bearish divergence can be seen on the daily chart (the chart makes a higher high while the oscillator makes a lower high), often a signal of exhausted bullish momentum, or at least a correction lower.
A break of bespoke support at 1600, and the move lower is already underway.
Our profit targets will be 1505 and 1485
Resistance: 1640 / 1660 / 1674
Support: 1620 / 1604 / 1570
Please be advised that the information presented on TradingView is provided to Vantage (‘Vantage Global Limited’, ‘we’) by a third-party provider (‘Signal Centre’). Please be reminded that you are solely responsible for the trading decisions on your account. There is a very high degree of risk involved in trading. Any information and/or content is intended entirely for research, educational and informational purposes only and does not constitute investment or consultation advice or investment strategy. The information is not tailored to the investment needs of any specific person and therefore does not involve a consideration of any of the investment objectives, financial situation or needs of any viewer that may receive it. Kindly also note that past performance is not a reliable indicator of future results. Actual results may differ materially from those anticipated in forward-looking or past performance statements. We assume no liability as to the accuracy or completeness of any of the information and/or content provided herein and the Company cannot be held responsible for any omission, mistake nor for any loss or damage including without limitation to any loss of profit which may arise from reliance on any information supplied by Signal Centre.


eth weakness | similar short setup as btceth also looking progressively weak. same setup as bitcoin.
hoping for trendline retest before more potential upside.
think eth is the better short based on ethbtc chart.

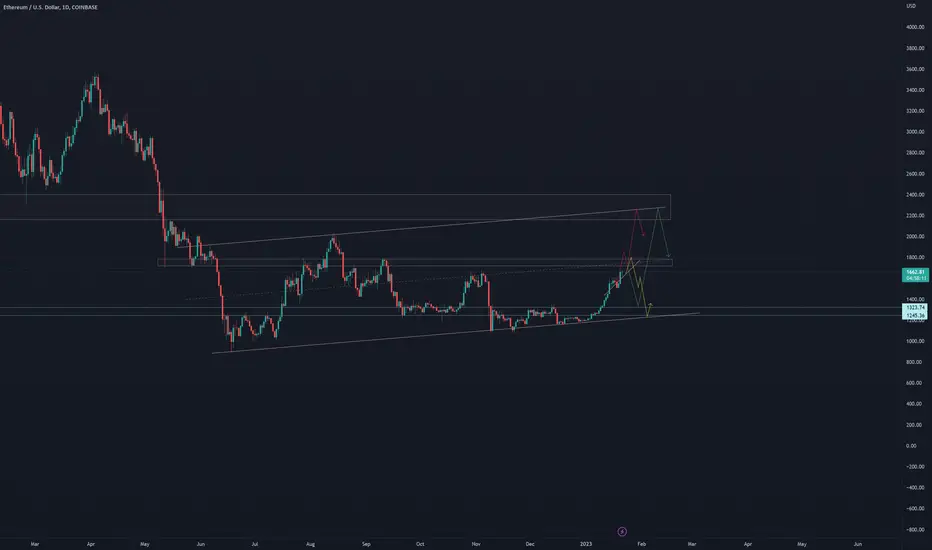
ETH Approaching Key Resistance Daily Trading RangesETH Approaching Key Resistance Daily Trading Ranges
We got potential major uptrend channel inside of yearly downtrend channel.
Rejection of 1650-1800 range will push down to 13xx levels.
Breakout from 18xx can hit 22xx.
ETH/USD 1DAY UPDATE BY CRYPTO SANDERS !!Hello, welcome to this ETHEREUM /USD update by CRYPTO SANDERS.
CHART ANALYSIS:-Ethereum (ETH) Ethereum (ETH) also surged on Saturday, as it climbed to its highest mark in the last four months.
ETH/USD hit a high of $1,674.18 earlier in the day, which comes following a bottom of $1,550.03 on Friday.
As a result of the move, ethereum recaptured a high not seen since September 13, which is the last time it traded over $1,700.
Although prices are currently below this threshold, the resurgence of bullish momentum on Saturday could lead to further surges this weekend.
The surge has pushed the 10-day (red) moving average back into an uptrend, extending its distance from its 25-day (blue) counterpart.
Overall, ethereum is up 6.28% as of writing.
I have tried to bring the best possible outcome to this chart.
Hit the like button if you like it and share your charts in the comments section.
Thank you


ETH/USD 1DAY UPDATE BY CRYPTO SANDERS !!Hello, welcome to this ETHEREUM/USD update by CRYPTO SANDERS.
CHART ANALYSIS:-Ethereum (ETH) also rebounded during today’s session, with prices continuing to move away from a recent floor.
Following a low of $1,515.79 on Thursday, ETH/USD raced to a peak of $1,559.55 earlier in the day.
Today’s surge comes as ethereum continues to move away from a recent support point at the $1,500 level.
Similar to BTC, the move comes following a dead cat bounce on the RSI indicator, with price strength rebounding from a recent low.
Currently, the index is tracking at a level of 74.64, which is marginally higher than the aforementioned floor at 70.00.
ETH bulls will likely now be targeting a resistance level at the $1,600 level.
I have tried to bring the best possible outcome to this chart.
Hit the like button if you like it and share your charts in the comments section.
Thank you

ETH/USD 1DAY UPDATE BY CRYPTO SANDERS !!Hello, welcome to this ETH /USD 1DAY chart update by CRYPTOSANDERS.
I have tried to bring the best possible outcome to this chart.
CHART ANALYSIS:-Ethereum (ETH) also retreated from recent highs, which comes after a failed breakout of its own.
ETH/USD dropped to a low of $1,529.79 earlier today, after trading as high as $1,579.48 on Sunday.
Ethereum failed to climb above the $1,580 high range, which led to a resurgence of some bearish sentiment.
there was a lot of buying seen in the Ethereum price, with the index at its highest point since January 2021.
Now tracking at 83.46, the next visible floor seems to be at the 70.00 mark, which could see ETH trading near $1,475 if hit.
This is not a piece of financial advice.
Hit the like button if you like it and share your charts in the comments section.
Thank you

Where is ETH moving?I could really care less if Ethereum goes to 150k, I'm a scalper not a holder. I see current retail traders are holding onto this bear flag. I have both my long target and my short targets. I am going to play this through patiently.
SHORT ENTRY: 1713.46
SHORT SL: 1727.56
SHORT TP 1627.88
LONG ENTRY 1456.61
LONG SL 1443.61
LONG TP 1503.34

ETH Drop to $1430* before going Higher or LowerI reckon this is in play for Ethereum.
Here are my reasons:
1. BTC & ETH are at strong resistances.
2. Perfect retest of H8 OB for ETH.
3. Lots of Selling Pressure.
4. SPX is at a strong resistance, likely to drop.
5. DXY showing inverse head and shoulders reversal pattern at resistance.
6. Price likes to test main diagonal resistances before making the next move. This is for a liquidity grab to fuel the next move.
I am shorting to these levels. NFA
Risk Management is important.
