This might be an UNPOPULAR opinion... (ETHBTC)This might be an UNPOPULAR opinion...
But I think holding $ETH is crazy right now.
I'm building a big short position on ETH vs BTC chart.
Let's retest the demand zone & blue trend line, this will make me a buyer of $ETH for the longer term.
#ETHBTC
Ethshort

ETH/USDT 1DAY UPDATE BY CRYPTO SANDERSHello, welcome to this ETH /USDT 1DAY chart update by CRYPTOSANDERS.
I have tried to bring the best possible outcome to this chart.
CHART ANALYSIS:-ethereum (ETH) also trended higher on Tuesday, as it once again rose into the $1,200 region.
Following a low of $1,160.38 to start the week, ETH/USD raced to a peak of $1,214.73 earlier in the day.
This comes despite the fact that there has been a recent downward crossover between the 10-day (red) and 25-day (blue) moving averages.
As of writing, the world’s second largest cryptocurrency seems set to collide with a higher resistance at the $1,230 level.
This could prove to be challenging however, with the 14-day RSI now hovering directly below a ceiling at 47.00.
Should there be a break of this key threshold, we will likely see more ETH bulls reenter the market.
This is not a piece of financial advice.
Hit the like button if you like it and share your charts in the comments section.
Thank you

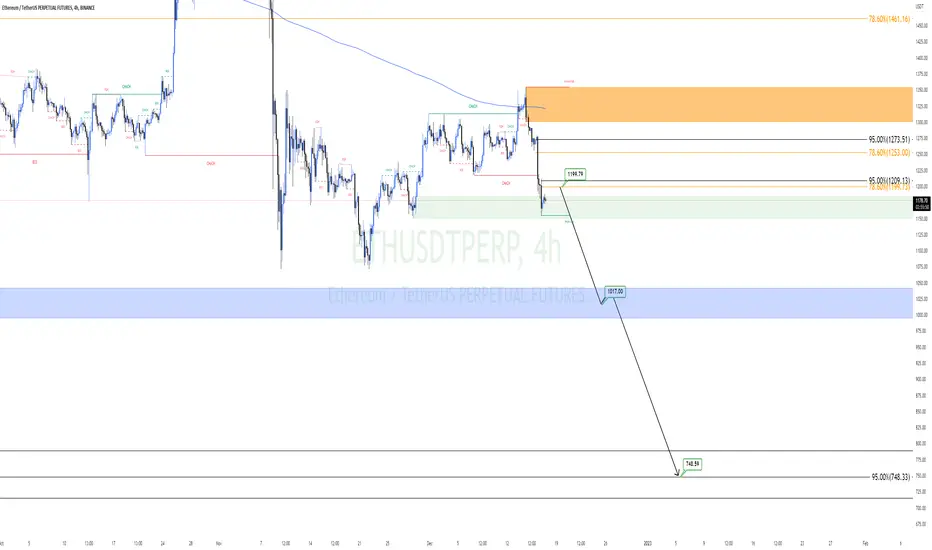
ETHUSDTP Rdy For ShortHello to all my dear friends, I have done the Ethereum analysis for you.
In this analysis, we want to buy the Ethereum cell, and our entry point will be $1,199, as well as the desired targets, $1,017 and $748.
The loss limit that we have set is $1,220.
Also, we will enter into this transaction with 50% of the original capital.
Good luck, dear Manouchehr Azar
Unique Update Of EthereumHello, welcome to this ETH /USD 1DAY chart update by CRYPTOSANDERS.
I have tried to bring the best possible outcome to this chart.
CHART ANALYSIS:-Ethereum (ETH) was also lower on Friday, as the world’s second-largest cryptocurrency fell closer to the $1,200 mark.
ETH/USD hit a bottom of $1,210.35 earlier in the day, which comes after trading at a high of $1,291.32 on Thursday.
Today’s drop sees ethereum move lower for a third consecutive session, breaking out of a key resistance level of $1,230 in the process.
As of writing, ETH is nearly 5% lower than yesterday’s peak, with the RSI tracking at 43.50, which is near a key floor.
This point of support is at the 42.00 mark and hasn’t been reached since November 28, when ETH was below $1,200.
Should price strength continue to head toward this bottom, there is a strong possibility that ethereum will be trading under $1,200.
This is not a piece of financial advice.
Hit the like button if you like it and share your charts in the comments section.
Thank you

Ethereum Remains Higher Ahead of Fed Rate DecisionHello, welcome to this ETH /USDT 1DAY chart update by @CRYPTOSANDERS.
I have tried to bring the best possible outcome to this chart.
CHART ANALYSIS:-Ethereum (ETH) was also trading near a multi-week high in today’s session, as traders geared up for the U.S. Federal Reserve policy meeting.
Many expect the Fed to increase interest rates by 50 basis points, following the better-than-expected inflation report.
ETH/USD hit a high of $1,341.44 on Wednesday, which comes less than 24 hours after trading at a bottom of $1,289.23.
As can be seen from the chart, ethereum remains close to a five-week high, with prices in the green for a third consecutive session.
Like with bitcoin earlier, the RSI is now hovering close to a key resistance level of 59.00, with a current reading of 58.06.
Market pressure could intensify should bulls force a breakout of this hurdle, potentially leading ETH toward $1,400.
This is not a piece of financial advice.
Hit the like button if you like it and share your charts in the comments section.
Thank you

ETH MIGHT RETEST LIQUDITY ZONEETH Shows a possibility of a breakout but the volume seems down, also the current set up not sustainable. We have two possible scenarios. We see a pump and then a dump OR we see a liquidity + trend line test and then a breakout.
At this point, not much choices.

ETH TO REVISIT $870 AGAIN?ETH price action looking eerily similar to 2017/2018... let's see if history rhymes

Unique Update Of EthereumHello, welcome to this ETH /USDT 1DAY chart update by CRYPTOSANDERS.
I have tried to bring the best possible outcome to this chart.
CHART ANALYSIS:-Ethereum(ETH) also trended downwards on Monday, with prices falling for a second consecutive session.
Following a high of $1,281.78 on Sunday, ETH/USD moved to a bottom of $1,243.48 earlier in the day.
The move saw ethereum fall to its lowest point since November 8, and it is now nearing a floor of $1,230.
Looking at the chart, recent bearish sentiment in ETH returned once the RSI failed to break out of a ceiling of 52.00.
As of writing, the index is tracking at 48.60 and now seems to be moving towards a floor of 45.30.
Despite this downtrend, the 10-day (red) moving average still remains above its 25-day (blue) counterpart.
This is not a piece of financial advice.
Hit the like button if you like it and share your charts in the comments section.
Thank you

ETH rising wedgeBINANCE:ETHUSDT is creating a rising wedge on the 1h chart. it's possible that we will see a pullback in the short term before resuming higher.

ETH ShortBitfinex Whales closed fully ETHlongs from 1k at range 1k6-1k8 with 70% profit so i think it will drop like a before !
If you agree give me like ! Wish you good luck

Unique Update Of EthereumHello, welcome to this ETH /USDT 1DAY chart update by CRYPTOSANDERS.
I have tried to bring the best possible outcome to this chart.
CHART ANALYSIS:-Ethereum (ETH) also edged lower in today’s session, with prices falling for a second straight day.
Following a high of $1,252.30 on Wednesday, ETH/USD dived to a low of $1,224.45 earlier in the day.
Today’s drop in price pushed ethereum below a recent support point at the $1,230 level, with prices hitting a nine-day low as a result.
Looking at the chart, the 10-day (red) moving average remains high, which some see as a signal that a bullish reversal could still be on the cards.
Despite this, momentum seems bearish, with the RSI tracking at 46.72, which is its lowest point since November 29.
The index now appears to be heading towards a support point at the 45.00 level.
This is not a piece of financial advice.
Hit the like button if you like it and share your charts in the comments section.
Thank you

ETH SHORT USING ASIAN RANGEDay's Bias: Bearish
Plot:
Asian Range Implementation
Price takes out Asian Range High liquidity while mitigating GAPs.
Obvious liquidity build up below last LTF Swing.
Price to take out LTF Liquidity to finish the HTF Retracement before looking for higher prices.
Trade shall be closed upon reaching target or by end of NY Session.

Ethereum 30m Chart Analysis Idea (Short)An idea before ETH makes a lower low to $1205.
Entry for a short here with good risk management, NFA.

Double Top pattern on ETHThe crypto shows breaking of the neckline of a possible double top pattern; indicating a bearish rally till 1173 price.

Unique Update Of EthereumHello, welcome to this ETH /USDT 1DAY chart update by CRYPTOSANDERS.
I have tried to bring the best possible outcome to this chart.
CHART ANALYSIS:-Ethereum (ETH) was also in the red during Tuesday’s session, as a result of a failed breakout to start the week.
ETH/USD fell to a bottom of $1,252.47 earlier in the day, which comes as bulls were unable to sustain a surge above the $1,300 mark.
As of writing, ETH is currently trading at $1,264.00, which is nearly 3% lower than Monday’s peak of $1,302.24.
Like with bitcoin, today’s decline in ethereum comes as the RSI moved below its ceiling at the 52.00 level.
Currently, the index is at a reading of 50.18, with the world’s second-largest cryptocurrency trading at $1,263.60.
The 10-day (red) moving average continues to hover above its 25-day (blue) counterpart, which typically is a sign of pending bullish sentiment.
CHART ANALYSIS:-Ethereum
In addition to bitcoin , ethereum (ETH) was also in the green to start the week, as prices edged closer to $1,300.
ETH/USD rose to a high of $1,302.24 earlier in today’s session, less than 24 hours after falling to a low of $1,253.16.
As a result of this, the world’s second-largest cryptocurrency has now marginally broken out of a long-term resistance point of $1,300.
Similar to the trend on bitcoin’s chart, Ethereum's moving average (MA) of 10 days (red) continues its upwards ascent versus the 25-day MA.
The 14-day RSI has also climbed, with the index tracking at 52.87, which is above a ceiling of 52.00.
Once bulls are finally able to break this current wall, the next target for traders will likely be the $1,350 point.
CHART ANALYSIS:-Ethereum (ETH) was also in the red on Saturday, as the price of the world’s second-largest cryptocurrency fell below a key resistance point.
Following a high of $1,299.84 on Friday, ETH/USD fell to a low of $1,275.09 earlier in today’s session.
This drop sees ethereum move below its recent ceiling at the $1,285 level, despite a recent upwards crossover of the 10-day (red) and 25-day (blue) moving averages.
Looking at the chart, today’s drop came as the RSI fell below its long-term support point at 51.70. It is now tracking at 51.42, as of writing.
Traders still seem to be optimistic about a potential move above $1,300, however, the RSI will likely need to surge beyond the 52.00 mark.
Should this happen, and the momentum of the moving average climb higher, then we could see ETH move towards a ceiling of $1,370.
CHART ANALYSIS:- Ethereum (ETH) also moved higher on Tuesday, ahead of the U.S consumer confidence report.
The Conference Board consumer confidence survey is expected to come in at a reading of 100, which is marginally below October’s reading of 102.5.
ETH/USD was back above $1,200 on Tuesday, hitting a high of $1,216.52 earlier in today’s session.
As can be seen from the chart, the move, which ended two straight days of losses, pushed ethereum to its highest point since Saturday.
Overall, this move comes as the RSI raced above its point of resistance at 43.70, and it is currently tracking at 46.10 as of writing.
A ceiling of $1,230 now awaits ethereum bulls, and should they overcome this hurdle, a move toward $1,300 will be on the cards.
This is not a piece of financial advice.
Hit the like button if you like it and share your charts in the comments section.
Thank you

Unique Update Of EthereumHello, welcome to this ETH /USDT 1DAY chart update by CRYPTOSANDERS.
I have tried to bring the best possible outcome to this chart.
CHART ANALYSIS:-Ethereum
In addition to bitcoin, ethereum (ETH) was also in the green to start the week, as prices edged closer to $1,300.
ETH/USD rose to a high of $1,302.24 earlier in today’s session, less than 24 hours after falling to a low of $1,253.16.
As a result of this, the world’s second-largest cryptocurrency has now marginally broken out of a long-term resistance point of $1,300.
Similar to the trend on bitcoin’s chart, Ethereum's moving average (MA) of 10 days (red) continues its upwards ascent versus the 25-day MA.
The 14-day RSI has also climbed, with the index tracking at 52.87, which is above a ceiling of 52.00.
Once bulls are finally able to break this current wall, the next target for traders will likely be the $1,350 point.
This is not a piece of financial advice.
Hit the like button if you like it and share your charts in the comments section.
Thank you

Ethereum Price Prediction Update ($600)Along with Bitcoins PA, I see this as the top for ETH, I see more downside from here, with a SMT divergence with Bitcoin. Testing Testlines and Bullish PA is going weaker. I think we will see lower lows very soon for ETH.
I am shorting from here NFA.

$ETH - Bearish to start the week - Bullish to end *SMT*EDIT: MY BNAD FOR NOT STRETCHING OUT THE CHART OF HEAD O0F TIME, i WAS LOOKING AT ANOTHER CHART WHILE TYPING THE IDEA..... It's not pretty but I hope you get the point.
SMT= Smart Money Theory, Please See the related Tutorial regarding smart money principles.
Tripple high, possibly breaks a little higher, make people think it a break out and then it slams on the breaks and heads back down towards the two large fair value gaps and a "Missed opportunity gaP" to possibly the bullish OB (Order Block) that will probably happen around Thursday or Friday (between 1145 and 1135. Before having the weekly profile complete its task of creating wicked on both sides and creating the high and the low at the beginning and ef the week. It still has broken structurer and with two fairt value gaps belowe this only seems the most logical
Additionally we should ALWAYS Look at the commitment of traders indicator it is subject to provide such records for the CFTC. Here you can see a massive drop from longs to more net shjorts, which tells me a short is coming this way... or those p [eople that really study thjis and trade it a lot are not to bright
Heres the daily with no indicators except where the imbakances are, which is about all you need to know about ETH right meow.
chart
ENTRSANCE - 1315-1318
SL - 1360
take Profit - 1217
TP2 1151
TP3 - 1130
I know I fluibbed bad on the last one but last week was news heavy and the fundamentals had a lot to do with it. This week, not so much, so the technical analysis should win this week.
GL GT
BodiesXWix -
COINBASE:ETHUSD
BITGET:ETHUSDT
MEXC:ETHUSDT.P
CME:ETH1!

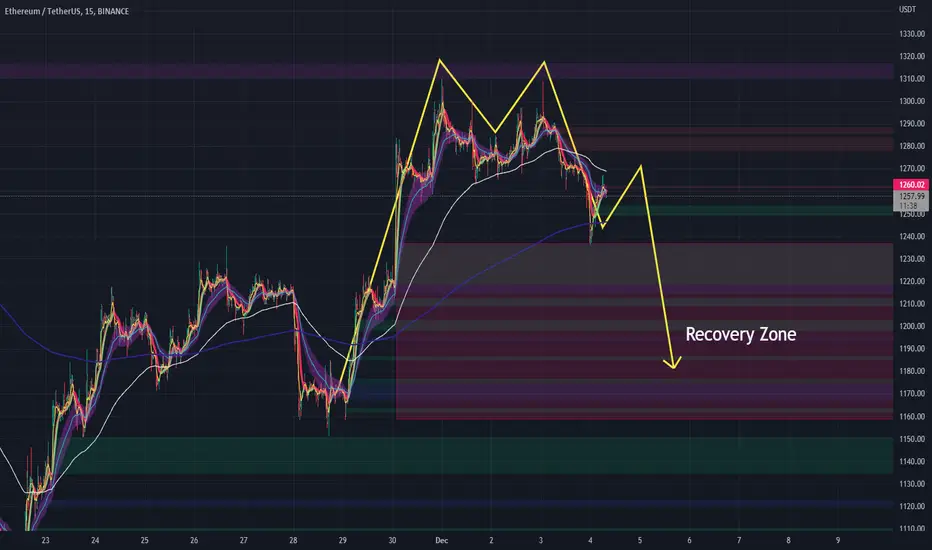
ETH Short SignalWe got a clear M formation and lots of zones to recover marked as "Recovery Zone".
A SHORT Entry would be between 1250 and 1270USD on ETH/USDT.
Monday we will see the play when markets are open.
Until then, keep your feet on the ground an prepare.
Have a great Sunday
Getting Ready for a Hard DROP I marked red the zone we could potentially reach before drop but looks like we will hardly move any more and more like just bleed down as is. The target zone of the drop is also marked so hope this helps follow for unique analysis and more! ))

Unique Update Of EthereumHello, welcome to this ETH /USDT 1DAY chart update by CRYPTOSANDERS.
I have tried to bring the best possible outcome to this chart.
CHART ANALYSIS:-Ethereum (ETH) was also in the red on Saturday, as the price of the world’s second-largest cryptocurrency fell below a key resistance point.
Following a high of $1,299.84 on Friday, ETH/USD fell to a low of $1,275.09 earlier in today’s session.
This drop sees ethereum move below its recent ceiling at the $1,285 level, despite a recent upwards crossover of the 10-day (red) and 25-day (blue) moving averages.
Looking at the chart, today’s drop came as the RSI fell below its long-term support point at 51.70. It is now tracking at 51.42, as of writing.
Traders still seem to be optimistic about a potential move above $1,300, however, the RSI will likely need to surge beyond the 52.00 mark.
Should this happen, and the momentum of the moving average climb higher, then we could see ETH move towards a ceiling of $1,370.
This is not a piece of financial advice.
Hit the like button if you like it and share your charts in the comments section.
Thank you

ETH Short as Retracement Move Using Asian RangeDay's Bias: Bearish
Plot:
Asian Range Implementation - price takes out Asian Range High before trying to reach for lower prices as a retracement.
Short Setup found after price takes out asian range high.
Possible bullish continuation next week.
Price is eyeing for tons of liquidity and gaps below.
Trade will be closed when TP hit or by end of NY Session.

ETH SHORT as Retracement MoveDay's Bias: Short Term Bearish
Overall Bias: Bullish until target price $1350+
Plot:
Strong Impulse move after mitigating GAPS left from a previous HTF bullish run.
Price creates HTF Equal lows instead of taking out an HTF Swing Low prior to this bullish impulse wave, which instructs a bearish continuation on Higher TF.
Price has not left the Asian Range today, but shows has taken out the Asian High.
Expecting price to create a SHORT Setup above asian range midpoint before dropping to about $1230 or lower as a retracement for an upward continuation.
Trade shall be closed by end of NY Session.
