ETH/USDT 1DAY CHART UPDATE !!ETH is still trading inside a descending channel, with the price close to key support.
Support Zone Holding: The $1,750–$1,830 area has provided a strong support base.
Ichimoku Cloud Resistance: The red Ichimoku Cloud above is acting as a crucial
resistance barrier.
Bullish Scenario:
If ETH breaks out of the descending channel, the first major resistance to watch is $2,400–$2,600 (cloud resistance).
A confirmed breakout could lead to a move towards $4,000+.
Bearish Continuation :
If ETH fails to break out, it could retest the $1,750–$1,830 support area.
A breakdown below $1,750 could open the door to lower levels around $1,600.
If you found this analysis helpful, hit the Like button and share your thoughts or questions in the comments below. Your feedback matters!
Thanks for your support!
DYOR. NFA
Ethshort

Chart Analysis Price Action:
The chart shows ETHUSD trading at 2,041.01, with a recent decline of -3.36 (-0.41%).
The high (HI) for the session was 2,044.00, and the low (L) was 1,664.36.
The price is currently near the session’s high, which suggests some resistance around the 2,044 level.
Trend:
The chart spans from 2009 to 2025, indicating a long-term uptrend for ETHUSD.
However, the recent price action (2024-2025) shows consolidation or a potential pullback, as the price is struggling to break above 2,044.
Key Levels:
Support: The low of 1,664.36 is a strong support level.
Resistance: The high of 2,044.00 is acting as a resistance level. If the price breaks above this, it could target higher levels.
Your short position at 2,037 is just below the resistance, which is a logical entry point for a short trade.
Momentum:
The price is currently in a slight downtrend, as indicated by the -0.41% decline.
The fact that the price is struggling to break above 2,044 suggests bearish momentum in the short term.

CRV/USDTHello friends
Due to the heavy price drop, buyers have been supporting the price well on the indicated support, which has caused a good price growth.
Now in the indicated support areas, you can buy in steps with capital management.
If you want to be with us in the Alt Season, send us a message.
*Trade safely with us*

Ethereum wooing toward 2022 lowsEthereum's momentum has been underwhelming to say the least. WIth network upgrades and future developments not showing a whole lot of pizzaz, Ethereum looks as it is heading toward 2022 lows near the $1,200 level. Is it a buy from there?

ETH/USDT Weekly Chart Analysis. The Ethereum (ETH/USDT) weekly chart suggests a potential bullish reversal from a key support area. Here are the details of the analysis:
Support area: Around $1,750 – $1,830, where the price recently rebounded.
Resistance levels:
First target: $4,015
Key resistance: $4,663, which marks a key breakout level.
ETH has bounced off historical support levels, indicating potential accumulation.
If the price sustains above $1,800, the next target is $4,015, followed by $4,663 if the momentum continues.
A break below $1,747 – $1,700 could lead to further declines, with the next strong support near $1,053.
Look for a confirmation of a breakout above $2,000 to confirm a strong uptrend.
Keep an eye on volume and indicators (RSI, MACD) for further confirmation of momentum.
Risk management is important in volatile market conditions.
If you found this analysis helpful, hit the Like button and share your thoughts or questions in the comments below. Your feedback matters!
Thanks for your support!
DYOR. NFA

ETHEREUM ( SHORT TERM )Hello crypto community!
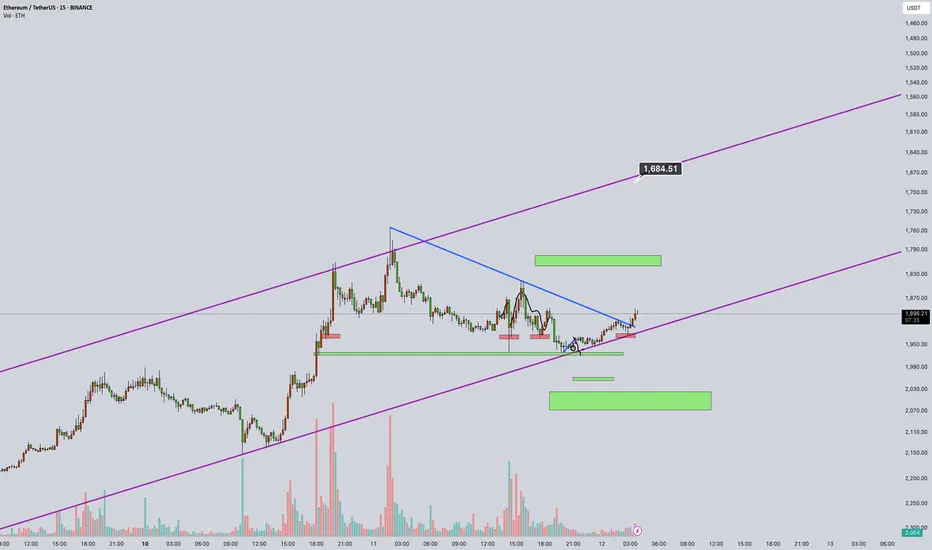
In this analysis, I’ve examined the Ethereum (ETH/USDT) 15M chart by inverting it.
It’s 12 March 2025, exactly 5 years since 12 March 2020, when Bitcoin crashed 55% in a single day, marking the “Black Thursday” that shook the market.
Now, the ETH chart shows the purple trendline as resistance (inverted to 1,684 USD) and green zones as support (inverted to 1,500-1,600 USD).
The pattern suggests a potential downturn; a break below the blue line could trigger a sharp pullback. Volume has risen by ~20% in the last hour, supporting this move.
Potential Scenario:
If resistance at 1,684 holds, the price may test support at 1,500-1,600, with a possible drop to 1,400. While not as severe as the 12 March 2020 crash, this week calls for caution. As a spot trader, I’m planning positions around the 1,600-1,500 range.
What do you think? Will ETH drop, or will the bull run continue? Share your thoughts below! 📉📈
Ethereum – The Never Ending Bear Trend? Current Market Structure – Bearish Trend Dominates
Ethereum (ETH) is currently in a well-defined downtrend, consistently rejecting imbalance zones (highlighted in blue on the chart). Each time price reaches one of these zones, we see a rejection followed by a move lower. This has been a repeated pattern, confirming that sellers remain in control and that ETH is struggling to gain any meaningful bullish momentum.
The presence of a clear descending trendline further supports this bearish structure, as ETH continues to respect this resistance and fails to break higher. Until we see a strong shift in price action, the trend remains intact, and lower prices are likely.
Rejection of Imbalance Zones – No Bullish Confirmation Yet
The imbalance zones act as strong resistance, and so far, every attempt to push above them has resulted in rejection. This means that until one of these imbalance zones is invalidated (i.e., price breaks and holds above one), we cannot consider any bullish scenario.
Each rejection strengthens the bearish case, reinforcing the idea that ETH is likely to continue making lower lows and lower highs. Unless buyers step in with significant strength and push ETH beyond a key resistance level, the safest approach is to assume that the downtrend will continue.
When Can We Consider a Bullish Scenario?
For ETH to turn bullish, we need to see at least one of the following:
Breakout above an imbalance zone – This would indicate a shift in market structure and potential strength from buyers.
Higher highs and higher lows forming – A sign that momentum is shifting away from the current bearish trend.
Price reclaiming key resistance levels – If ETH can reclaim lost ground and sustain above it, it may indicate a potential reversal.
Until one of these conditions is met, there is no reason to be bullish. Any upside move that fails to break a key resistance should be considered a shorting opportunity rather than a bullish reversal.
Key Bearish Confirmation – Lower Prices Expected
As long as ETH keeps rejecting imbalance zones and making lower highs, the market structure remains bearish. The next downside targets are likely to be the previous support levels, with price potentially dropping towards the $1,600-$1,500 range if selling pressure continues.
The projected red price movement on the chart suggests that ETH could consolidate for a bit before continuing its descent. This aligns with the current trend and price behavior.
Historical Context – ETH at 2-Year Lows
ETH is currently trading at a price level last seen two years ago, reflecting significant weakness. Despite temporary rebounds, price action remains suppressed, and we are not seeing the kind of momentum that would indicate a strong recovery.
While some may view this as a “cheap” buying opportunity, the reality is that ETH is showing no bullish strength in its current price action. Without a confirmed trend reversal, simply being at a low price does not make it a good buy. Catching a falling knife is risky, and it is better to wait for confirmation before considering long positions.
Here is the zoomed out chart:
Final Thoughts – Patience is Key
ETH remains in a strong bearish trend, and every rejection confirms lower prices.
No bullish confirmation yet – price needs to break a key level before we consider upside potential.
Expect further downside unless market structure changes.
ETH is at historical low levels, but low prices alone do not mean bullish momentum is coming.
As traders, the best approach is to wait for confirmation and trade with the trend. Until ETH proves otherwise, the bearish structure remains dominant, and downside targets remain in play.
__________________________________________
Thanks for your support!
If you found this idea helpful or learned something new, drop a like 👍 and leave a comment, I’d love to hear your thoughts! 🚀
Make sure to follow me for more price action insights, free indicators, and trading strategies. Let’s grow and trade smarter together! 📈
Also let me know if you want to see a chart of another coin. I will create it for you.

ETH BREAKOUTAs i can see in a Weekly chart that the ETH has broken it's triangle pattern, and right now struggling to break its imp level 1,900 if EHT closes this week's candle under 1,900, so after retest it may show 1,200...

ETHUSDT 📉 ETHUSDT Trade Signal 📈
🔥 Long Entry: $1,990
🎯 Targets:
✅ 1️⃣ $2,277
✅ 2️⃣ $2,507
✅ 3️⃣ $2,818
🛑 Stop Loss: $1,774
⚡ Breakout Watch: Wait for confirmation above $1,990 before entering! 🚀

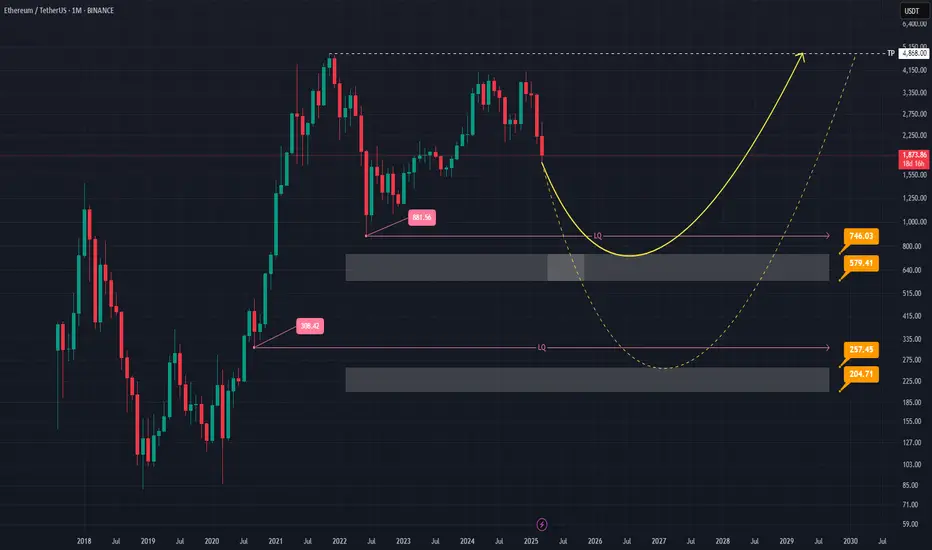
Ethereum: Rebound from here or Drop to $881?Hey everyone! Let’s explore what’s happening on Ethereum’s monthly chart. Right now, there seem to be two main possibilities to keep in mind. The first and more likely scenario involves a dip toward the lower price zones—around 881.56—and then testing important supports near 579.41 and 756.03. Observations suggest that if the price heads down to these areas, there could be a bounce, though a deeper move is possible (even if it seems less likely). On the flip side, if the price climbs from its current level toward its previous peak, we’d want to revisit this analysis for updates.
Key price zones are highlighted on the chart, showing where a lot of buying or selling could happen. A change in trend would typically be confirmed by a clear candlestick pattern and solid trading volume, so those are worth watching. As with any market, unexpected moves can always occur, so it’s good to stay prepared and flexible.
Remember, these are just observations based on the monthly chart, and personal research is always important. Stay curious, stay safe, and never hesitate to dig deeper into your own analysis before making any decisions. Good luck out there! 💼📈
The Fate of ETHER#ethereum price has weakened against both #usd and #btc .In this #ethbtc chart, an Inverted Eve & Adam pattern has been formed in higher time frame. This took a long time and this is.. bearish. CRYPTOCAP:ETH structure shows no strenght, i' ve warned in my ideas and posts many times when price was higher than 3500 usd. Still #ethusd has many risks, #eth needs very strong news. Otherwise, furthermore dumps are inevitable...
Not financial advice.

ETH(based on NEo wave)This supercycle is a nice nature triangle which E wave is ending and its look like a diamon diametrical.
so I will update it for the confirmation, I think ALTseason is so close and we can see that happening soon but this season take about 400 to 450 days and after that there is a huge CRASH!

Short Trade at Ethereum executed Strong signal received on ETH which shows a Profit Factor of 4.00 in Short Trading at the 15min timeframe. The trade was open for 45min and the Exit was placed at a very nice spot.
Would you like to receive such sort of signals in realtime? Tell me in the comments and follow for more!

ETHEREUM price is alarming...#ethereum price has closed a weekly candle below 3 years of trendline for the first time!.. This is the one negative only. The other fact is, #eth price has already declined from the weekly ichimoku cloud and lost support. These must not be underestimated. I' ve warned you about CRYPTOCAP:ETH price structure weakness weeks ago.
What' ll be next? Allrigt. ETH has took support this zone and is now testing 2000 usd support zone. To avoid this sign of "major weakness", #eth price must immediately reclaim 3000 usd and above with monthly candle close. With this weekly close, it' s now getting harder to shelter the trend reversal. For now 2000 usd moderate and 1450 usd are now strong support zones for #ethusd .Otherwise, things will get more serious in mid term. Not financial advice. DYOR.

Failure to hold $2k, will mean $1500 or $860 supportFollowing basics, we break out of support lines, now next levels of support are on the fib lines...
What you think? Not rocket science really for CRYPTOCAP:ETH

Ethereum at Key Support Zone: Is a Counter-Trend Setting Up?Ethereum (ETH) is currently in a strong bearish trend 📉, but it has traded into a key support zone 🛑 and seems overextended, in my opinion. Looking at the price action and market structure on the daily and four-hour timeframes, we’re now seeing Ethereum form higher highs and higher lows on the four-hour chart 📊. While it’s still early, if we see a break above the current range high on the four-hour timeframe, there could be an opportunity for a counter-trend trade 🔄, targeting equilibrium ⚖️ and a previous imbalance highlighted in the video. As always, this is for educational purposes only and should not be taken as financial advice 💡.

#ETH/USDT#ETH
The price is moving in a descending channel on the 1-hour frame and is adhering to it well and is heading to break it strongly upwards and retest it
We have a rebound from the lower limit of the descending channel, this support is at a price of 1950
We have a downtrend on the RSI indicator that is about to break and retest, which supports the rise
We have a trend to stabilize above the moving average 100
Entry price 2236
First target 2340
Second target 2414
Third target 2530

ICP/USDT(BUY)hello friends
Despite the fall of this currency, we are now at the price floor and good conditions have been provided for buying, of course, with capital management...
*Trade safely with us*

ETHUSDT (Ethereum) just an anticipateI think the price will liquid some stoploss and then will toward the pointed area!

weekly chart for ETH/USDT. The weekly chart for ETH/USDT shows Ethereum trading within a descending triangle structure, with the lower support trend line indicating potential price stability around the $2,400 level. The upper resistance line is seen near $3,600.
Currently, the price is at around $2,445, having recently declined by around 2.89%. The chart suggests potential upward movement if the price breaks above the resistance line, which could test the previous highs.
Key Levels to Keep an Eye on: If Ethereum can break the resistance, the bullish momentum could strengthen; conversely, a drop below the support could indicate a bearish trend ahead. It will be important to monitor volume and market sentiment for the next action.
If you found this analysis helpful, hit the Like button and share your thoughts or questions in the comments below. Your feedback matters!
Thanks for your support!
DYOR. NFA

$ETH Ascending Broadening Wedge BreakoutCRYPTOCAP:ETH Ascending Broadening Wedge with completed Partial Rise and Breakout to the downside with Pullback at resistance

Where is Ethereum going from here?Where Is Ethereum Headed Next?
Ethereum’s price action has been holding firm within a key support zone, demonstrating resilience despite broader market uncertainties.
However, a break below this critical support level—which aligns with the top ascending trendline—could signal further downside potential.
Technical Outlook:
If macroeconomic and fundamental pressures continue to weigh on the crypto market, Ethereum may lose its current support, potentially leading to a decline toward $2,500 and possibly even $2,200.
From an investment perspective, I plan to accumulate ETH gradually using a dollar-cost averaging (DCA) strategy around the $2,200 zone. A further drop to $1,500 would present a significant long-term buying opportunity at a discounted level.
What are your thoughts on ETH’s next move?
Let’s discuss—feel free to share your insights, like, and follow for more updates!

ETH/USD SELLThis analysis is based on the provided image and should not be considered financial advice. Trading involves risks, and it is essential to conduct your own research and consult with a financial advisor before making any trading decisions.
