ETH Flag Pattern: Quick Short then $2KHi Traders, Investors and Speculators of Charts📈📉
As you know, we're trading in the opening moments of a new bullish cycle. Often when quick increases happen, pullbacks and corrections are sure to follow, even during a bull market this is natural.
ETH formed a flag, and this gives the opportunity to take either a long or a short. Watch the video for a quick setup with conditions and an easy to understand explanation.
Remember, support and resistance zones are great to watch for possible long and short opportunities during brief pullbacks!
_______________________
📢Follow us here on TradingView for daily updates📢
👍Hit like & Follow 👍
We thank you for your support !
CryptoCheck
BINANCE:ETHUSDT
Ethsignals

Ethereum analysis update in daily time frameThe price range of 1799-2170 has no resistance and is a completely fake price level and we will pass through it.
The main movement of the price has started from the range of 1525 towards the target and it is currently protecting the price and the whales will not be sold until the range of 2700-2900.
Ethereum is now lagging behind Bitcoin and is a better opportunity to profit from it.
We may have a temporary alt party.
Not financial advice


$SNT weekly Breakout DoneNASDAQ:SNT weekly Breakout Done
Trading cryptocurrency breakouts, especially weekly resistance breakouts, can be a profitable strategy, but it also carries a significant level of risk. Here's a step-by-step guide on how to trade a weekly resistance breakout:
1. **Understand the Basics**:
- Make sure you have a good understanding of technical analysis, as it will be a crucial tool for identifying resistance levels and confirming breakouts.
2. **Choose Your Cryptocurrency**:
- Select a cryptocurrency that you want to trade. It's best to focus on well-known coins with sufficient liquidity and trading volume, as they tend to exhibit more predictable price movements.
3. **Identify Resistance Levels**:
- Use technical analysis to identify the weekly resistance levels on the cryptocurrency's chart. These are price levels where the asset has historically struggled to move beyond.
4. **Confirm the Breakout**:
- Wait for a clear breakout above the weekly resistance level. This should ideally be accompanied by increased trading volume to confirm the strength of the breakout. Remember that false breakouts can happen, so confirmation is crucial.
5. **Set Entry and Stop-Loss Orders**:
- Determine your entry point, which should be just above the resistance level where the breakout occurred. Set a stop-loss order just below the breakout level to limit potential losses in case the trade doesn't go as planned.
6. **Risk Management**:
- Calculate your position size based on your risk tolerance. Never risk more than you can afford to lose. A common rule is not to risk more than 1-2% of your trading capital on a single trade.
7. **Take Profit Targets**:
- Consider setting multiple take-profit targets. This allows you to lock in profits as the price rises. Traders often use a combination of technical analysis and indicators to identify potential levels where the price may encounter resistance.
8. **Monitoring and Adjustments**:
- Continuously monitor the trade. If the price starts moving in your favor, consider trailing your stop-loss to lock in profits and reduce risk. If the trade goes against you, stick to your stop-loss and exit the trade.
9. **Emotional Discipline**:
- Keep your emotions in check. It's easy to get carried away with trading, especially when dealing with cryptocurrencies known for their price volatility. Stick to your trading plan and avoid impulsive decisions.
10. **Stay Informed**:
- Be aware of any news or events that could affect the cryptocurrency you're trading. Market sentiment can change rapidly based on news, regulatory developments, or market trends.
11. **Record and Analyze**:
- Keep a trading journal to record your trades, strategies, and results. This can help you learn from your successes and mistakes, improving your trading skills over time.
12. **Seek Professional Advice**:
- If you're new to trading or unsure of your skills, consider seeking advice from a financial advisor or trading mentor. They can provide guidance and help you develop a more solid trading strategy.
Remember that trading cryptocurrencies, like any other form of trading, carries risk. It's essential to do your own research, practice with a demo account if you're new, and only invest what you can afford to lose. Additionally, past performance is not indicative of future results, so always exercise caution and use good risk management practices.

EthereumPair : ETHUSD ( Ethereum / U.S Dollar )
Description :
Bearish Channel as an Corrective Pattern in Short Time Frame and Rejection from the Upper Trend Line or S / R Level. Completed " 1234 - abcd " Impulsive Waves at Fibonacci Level - 38.20%
Entry Precaution :
Wait until it Rejects or Breaks the UTL

False breakout in ETH? Time to analyzeDear traders, Ethereum broke out of the 1750 resistance level on
24 October. However, we are seeing the absence of a follow-through
here.
If you notice the last few daily candlesticks, you can see some long wicks
at the top of each candlestick. This indicates that we might have had
a false breakout. If ETH falls back below 1750, expect another drop
to 1540 soon.

ETHUSD: Careful at the POCWe are likely about to see a lot of traders get trapped in their shorts when we break the POC!
We are currently at the center of a contraction zone
Will keep you posted
The untapped liquidity at the big bearish order block is a good opportunity to short!

#Ethereum Down Time Came...#Ethereum Down Time Came...It's ready to collect downside liquidity. Bull Volume is weaker then Bear Volume. And My PA supports #ETH Short.

ETHUSDT Analysis based on structureI expect a pullback soon or late to fill the missed orders. so I'm looking for confirmation such as heavy reactions or a massive rejection to consider long positions. It may take time.

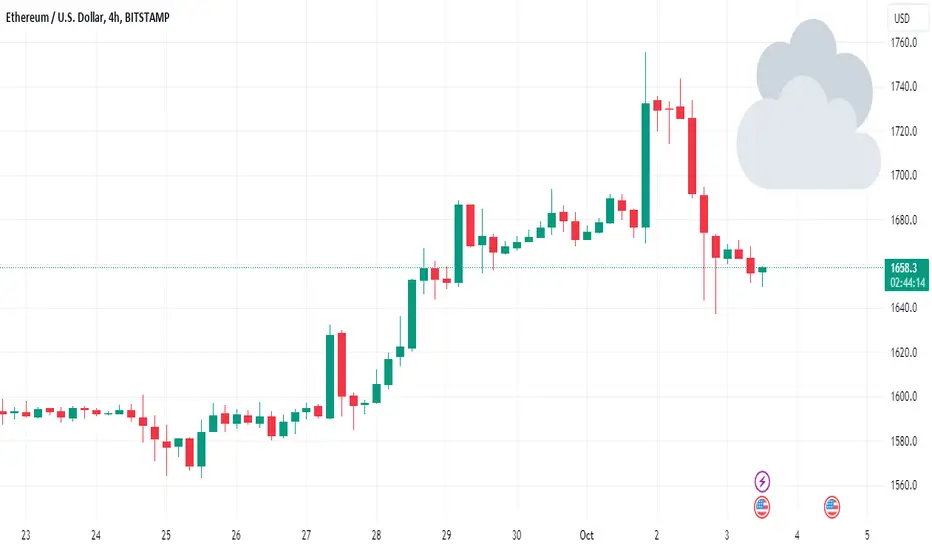
ETH - Rebound Soon? 🌦️Cloudy ☁️ and rainy trading conditions 🌧️ lie ahead for the global crypto market in the next 24 hours, signaling a bearish trend with downside risk for most cryptocurrencies. Ether faces an even stronger downward trend, indicating a likely rebound in the short term. 🌦️
Over a one-week horizon, the bearish trend continues for most cryptos, with Bitcoin being the notable exception. A slightly bullish trend with upside potential is likely for the largest cryptocurrency, according to ATTMO. 🌞
Follow us for more crypto weather reports!

ETHUSDTBINANCE:ETHUSDT idea
⛔"Daily crypto market analyses I provide are personal opinions & not financial advice. Trading carries risks, so do your own research & seek advisor's help.#DYOR"
Don't forget to like and comment

Eth at Daily had a double top!Eth is showing weakness now and had a double top. Also, waiting on the The3eyedscalp indicator to turn red on weekly before I short it with the volume.

ETH, working with liquidityHello Trader! After the rebound on the M30, a nice buy order block has formed. I'll be considering taking three liquidity zones above the order block. Placing the stop below the order block.

ETH - 10/10/23ETH - 10/10/23
**Trade setup:**
ETH doesn't look good one big fall from BTC and we could see ETH fall as far as $750, we are holding ATM on the FVG from previous structure at $1577 to $1466, we break this then we could hit $1000!
If we break higher than $1595 we can still move higher but I would wait for confirmation first!

Looks like ETH would get some bounceEth recently dropped below its trend line and support too, is now trading at a lower support which is also a good demand zone in my vision i expect some upward movement in this zone as per my analysis , any way DO YOUR OWN RESEARCH

ETH 24-Hour Forecast: Bearish ☁️; Next Week: Bullish ☀️Slightly bearish clouds ☁️ lie ahead for Bitcoin and Ether in the next 24 hours, signaling a downside risk. Altcoins such as Litecoin, Cardano, Polygon, and Chainlink may see sunny ☀️ trading conditions.
Over a one-week horizon, the sun ☀️ should return and shine over Bitcoin and Ether. These improved trading conditions won't affect smaller coins such as Ripple, Avalanche, Binance Coin, and Polkadot, which will face a slightly bearish clouds ☁️ trend, according to ATTMO's forecasts.
Follow us for more crypto weather reports!

Ethereum (ETH) - Crypto Trading - 04. OCT. 2023Welcome to SharedCryptoBot!
Bitcoin (BTC)
Price is turning, we just made a higher wave structure, looking for a turnaround for better long entries.
We will update this post!
Leave us some love and let us know what you think down below <3
SharedCryptoBots

Ethereum Moving Towards the Rise!Hi!!
After a long time, I came to give you an analysis of Ethereum
As you can see, Ethereum is forming a double bottom pattern in its corrective movement in its support range (1640-1600). At the limit of 1606, with the return of the trend and the formation of the double bottom pattern in the first target, it will reach the range of 1660, and after breaking the neckline and completing the pattern, it can move to the second target, that is, up to the range of 1750.

#ETH - thoughts out loud#8Good evening from Ukraine!
Dear colleagues, I am glad to welcome you!
Work plan.
Thank you all for your attention, I wish you success.
Sometimes you win/sometimes you learn.
- thoughts out loud
- thoughts out loud
- thoughts out loud
P.S.
...Think positive)

ETH at weekly 0.618 FIB Retracement-ETH reached a new high at 1751 in recent weeks, creating a resistant zone 1725-1751. It then drops about $126 to a support zone @1625-1641
-This support zone is also a weekly 0.618 Fib Retracement zone.
-STO oversold
-Current Price above ma 200
-Next support @1580-1594
Watch the Price above 1H Bear Trend Line for another test at the resistant zone.
What do you think?

ETH ☁️ 24 Hours, Bearish Outlook, ☀️ Back in One Week? Clouds ☁️ lie ahead for the global crypto market, including Ethereum and Bitcoin, in the next 24 hours, signaling bearish trading conditions and downside risk.
Over a one-week horizon, ☀️ sunnier trading conditions with a few 🌤️ clouds lie ahead for the global crypto market, including Bitcoin and Ether. This indicates that a slightly bullish market with upside potential is likely.
Some altcoins, including XRP, Binance Coin, Dogecoin and Chainlink continue to face slightly 🌦️ bearish trading conditions.
Follow us for more crypto weather reports!
Ethereum (ETH) - How to trade Crypto? Vol. 002Welcome to SharedCryptoBot!
Ethereum (ETH)
Ethereum slowed down after a negative phase, looking forward the next upside wave. We will update this post!
Leave us some love and let us know what you think down below <3
SharedCryptoBots

How ETHUSD Might RiseAn idea for ETHUSD suggesting a large breakout
The breakout is a copy of BTCUSD parabolic rally 2017
A wedge can be created with strong trend lines shown by the dotted lines and the lower line of the triangle.
Wen moon
