ETH SECURITY ISSUE ETH IN DANGER;!Eth is considered to be a strong project after Bitcoin recently Eth has been upgraded it was previously on Proof of Work now it has been upgraded to Proof of Stake. New York Attorney General Letitia accused Eth of having security issues, so the case will continue for now. The Shanghai update is going to happen in the month of March and people will have ETH stacks that have been stacked for years and there will be a selling pressure due to which Eth is expected to crash by 10-15%.
Ethsignals


Trading Range ETHUSDThe trade plan is discueesd in chart.You can either play in Range but buy at S1 Or Sell at R1. Incase it breaks S1 and S2 your Sell stop will triger and vice versa.

ETHUSD Inverse Head and Shoulders to $2000Ethereum (ETHUSD) is about to complete an Inverse Head and Shoulders (IH&S) pattern with the Support of the 1D MA50 (blue trend-line). With a 1D Golden Cross already formed since February 08 and the formerly Bear Cycle Resistance of the 1D MA200 (orange trend-line) now turned into Support, this IH&S targets the 2.0 Fibonacci extension, a little over $2000. That is exactly where the 2030 Resistance 2 is of the August 13 High.
Notice how on 1D RSI terms, the pattern is similar to the mid August - September, which started a strong rebound. On top of that, since the August High, ETH appears to be trading on a perfectly symmetrical Cup pattern.
-------------------------------------------------------------------------------
** Please LIKE 👍, FOLLOW ✅, SHARE 🙌 and COMMENT ✍ if you enjoy this idea! Also share your ideas and charts in the comments section below! **
-------------------------------------------------------------------------------
💸💸💸💸💸💸
👇 👇 👇 👇 👇 👇

ETH chart looking so Crazy Ethereum was trading in a weekly descending channel which is recognized as a bullish pattern recently the channel has successfully breakout and is preparing to take a long flight. However, it has active wheels and can sometimes surprise

ETH Buy TradeHere is My Study On Etherium. NExt Month Coming Shanghai Update. It Brings Abit Fomo an We can Touch 2000.
This analysis is for informational purposes only and should not be considered financial or investment advice. The information presented in this analysis is based on my own research and is subject to change without notice. The analysis is not a recommendation to buy or sell any specific cryptocurrency, Forex And Stocks. Please conduct your own research and consult with a financial advisor before making any investment decisions."

ETHRIUM has Enogh With DownTrendHere is My Study on ETH Against Btc.
This analysis is for informational purposes only and should not be considered financial or investment advice. The information presented in this analysis is based on my own research and is subject to change without notice. The analysis is not a recommendation to buy or sell any specific cryptocurrency, Forex or Stocks. Please conduct your own research and consult with a financial advisor before making any investment decisions."

Shanghai upgrade: to the moon or not?Ethereum is an amazing project: the team's ability to stay on the road map and stick to the original plans has always been impressive. Even this one thing makes you stay bullish on $ETH in the long run. Earlier we posted idea about the Shanghai upgrade and we predicted local growth until March. Now let's check things out in a current situation
First of all, we should understand that long-term theses are only good in a bull market, or when most participants are also thinking in the long term. That's why we shouldn't expect a crazy rise right after the Shanghai upgrade.
The Shanghai Upgrade is scheduled to be implemented on the Sepolia test network on February 28, 2023 . Tentatively Shanghai should be released on mainnet a few months after Sepolia (July-August)
Let’s remember that the main feature of the Shanghai Upgrade for the user will be the ability to output steak ETH.
Here’s some statements why you shouldn’t wait for ‘to the moon’ right after the upgrade:
Some of the users who have entered at the price of ETH below the current one may want to take profit
Some of the users who have entered at the prices equal to the current one, may want to secure their positions and fix the token stack they have forged
Some users who have entered at the prices higher than the current one may want to take their losses back
Thanks for reading, share your point of view about ETH and stay with us!

ETHUSD is in bullish regionMake triangle and show some bullish indication
Entry at 1712
TP 1810
SL 1620

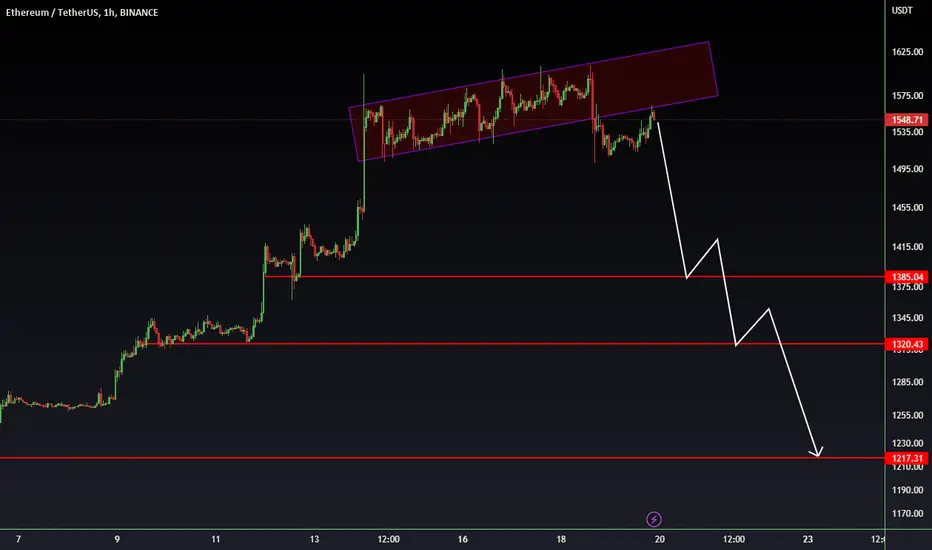
ETH - Same trend as beforeCOINBASE:ETHUSD
4h time frame
-
ETH did break out the ascending channel we mentioned before.
We can notice a similar trend in Nov 2022, which reached ~1070.
I think we shouldn't go back to the box if this is a healthy correction, the ceiling of box is 1355, which has strong support.

ethusdt buy at the supportethusdt buy at the support
Ethereum is in a very important support range that if strong buyers appear, they can grow this Ethereum to the ceiling of the channel or even more.

ETH|USD Weekly Trading Insights: Chart Analysis for Long-Term A 1-week chart analysis of Ethereum can provide valuable insights for long-term holders of the cryptocurrency. By examining the price trends, volatility, and volume of Ethereum over the past week, it is possible to make predictions about the future performance of the asset.
For instance, a steady upward trend in the price of Ethereum over the past week, accompanied by high volume, indicates strong investor confidence and market demand, which are positive indicators for long-term price growth. On the other hand, if the chart shows a lot of volatility and price swings, it could signal a lack of market stability, which may cause concern for long-term holders.
Additionally, a 1-week chart analysis can also provide insights into the impact of any major events or news on the price of Ethereum. For example, if there was a significant spike in price following the announcement of a new development project or partnership, this may indicate that the market is excited about the potential of the project, and that long-term holders may benefit from its success.
Furthermore, Ethereum is often considered a leading indicator of the overall crypto market, so analyzing its 1-week chart can also provide insights into the broader market trends. For example, if Ethereum is experiencing a period of growth, this may be an indicator of positive sentiment for the entire cryptocurrency market.
Overall, a 1-week chart analysis can provide valuable information for long-term Ethereum holders to make informed decisions about their investments. By monitoring trends and staying informed about market conditions, they can make more informed decisions about buying, selling, and holding Ethereum.

ETHUSD💥1H-TIMEFRAME ANALYSISETHUSD💥1H-TIMEFRAME ANALYSIS
💗Hello ladies and gentlemen
This is my new idea for 💥ETHUSD
I hope my idea is clear
Support me by like and share thank you
Stay Safe💯💲💲💲
Good luck💰😍
ETHEREUM Cup and Handle leading it to 1795?Ethereum (ETHUSD) filled the FTX crash gap on the November 04 High (1680) and is now showing the first signs of pulling back. This is can be the Handle of the Cup and Handle (C&H) pattern that could be completed on its 1D MA200 (orange trend-line) and 1D MA50 (blue trend-line) periods and once they form a Golden Cross, push it to the next Higher High. Our target is the 1W MA50 (red trend-line) and the 1795 Resistance (September 11 High).
-------------------------------------------------------------------------------
** Please LIKE 👍, FOLLOW ✅, SHARE 🙌 and COMMENT ✍ if you enjoy this idea! Also share your ideas and charts in the comments section below! **
-------------------------------------------------------------------------------
💸💸💸💸💸💸
👇 👇 👇 👇 👇 👇

ETHEREUM Triangle aiming at the critical 1D MA200 testEthereum (ETHUSD) has been trading within a Triangle pattern since the June 18 2022 market bottom. It is above the 1D MA50 (blue trend-line), where it had the last rejection on December 14 and it targeting for the 1D MA200 (orange trend-line), which happens to be now exactly at the top (Lower Highs trend-line) of the Triangle and is where it had its last major rejection during the FTX crash on November 04 2022.
A 1D candle closing above the 1D MA200 reverses the currently neutral medium-term trend to bullish and targets the 0.618 Fibonacci retracement level (which happens to be on the November 04 Resistance) and if also broken then the 0.786 Fib (which happens to be on the September 11 High/ Resistance). Basically see how all Fibonacci levels have formed critical pressure points within that pattern.
On the other hand, a closing below the 1D MA50 could target the bottom of the Triangle again but only a break below the last Higher Low (1075.50) can turn the trend bearish (medium-term) towards the 885.00 market bottom.
-------------------------------------------------------------------------------
** Please LIKE 👍, FOLLOW ✅, SHARE 🙌 and COMMENT ✍ if you enjoy this idea! Also share your ideas and charts in the comments section below! This is best way to keep it relevant, support me, keep the content here free and allow the idea to reach as many people as possible. **
-------------------------------------------------------------------------------
You may also TELL ME 🙋♀️🙋♂️ in the comments section which symbol you want me to analyze next and on which time-frame. The one with the most posts will be published tomorrow! 👏🎁
-------------------------------------------------------------------------------
💸💸💸💸💸💸
👇 👇 👇 👇 👇 👇

ETHUSDT ! Retest The Resistance ETHUSDT will retest the resistance we open a short position from resistance because of low volume and selling pressure in that scenario we will see a fall towards the support level which will be our TP point.

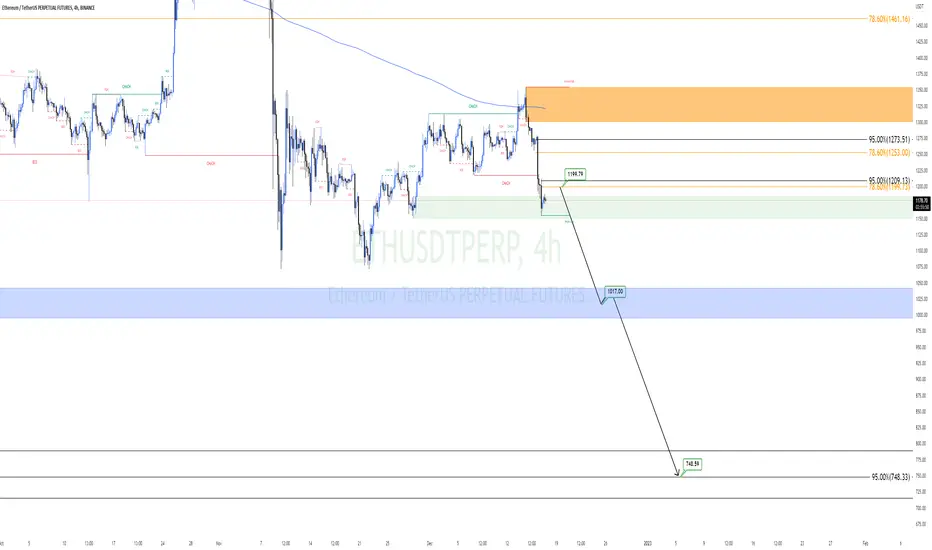
ETHUSDTP Rdy For ShortHello to all my dear friends, I have done the Ethereum analysis for you.
In this analysis, we want to buy the Ethereum cell, and our entry point will be $1,199, as well as the desired targets, $1,017 and $748.
The loss limit that we have set is $1,220.
Also, we will enter into this transaction with 50% of the original capital.
Good luck, dear Manouchehr Azar
Unique Update Of EthereumHello, welcome to this ETH /USDT 1DAY chart update by CRYPTOSANDERS.
I have tried to bring the best possible outcome to this chart.
CHART ANALYSIS:-Ethereum (ETH) also edged lower in today’s session, with prices falling for a second straight day.
Following a high of $1,252.30 on Wednesday, ETH/USD dived to a low of $1,224.45 earlier in the day.
Today’s drop in price pushed ethereum below a recent support point at the $1,230 level, with prices hitting a nine-day low as a result.
Looking at the chart, the 10-day (red) moving average remains high, which some see as a signal that a bullish reversal could still be on the cards.
Despite this, momentum seems bearish, with the RSI tracking at 46.72, which is its lowest point since November 29.
The index now appears to be heading towards a support point at the 45.00 level.
This is not a piece of financial advice.
Hit the like button if you like it and share your charts in the comments section.
Thank you

Ethereum 30m Chart Analysis Idea (Short)An idea before ETH makes a lower low to $1205.
Entry for a short here with good risk management, NFA.

Financial Wave. ETHETH.
The $1300 target that we discussed in previous reviews has been reached. Our priority scenario for Etherium is continued growth in the $1380-1450 range. A price drop below $1150, as well as a long flat cancel this scenario.

Getting Ready for a Hard DROP I marked red the zone we could potentially reach before drop but looks like we will hardly move any more and more like just bleed down as is. The target zone of the drop is also marked so hope this helps follow for unique analysis and more! ))

Financial Wave. ETHEtherium
In previous reviews, we showed our priority scenario for ETH with a target of $1300, in fact it can be considered fulfilled and we have introduced updated growth targets, the wave structure is moving ETH to the next targets of $1380 and $1450. A price drop below $1150 will change our view.

Eth back above 1250. 1420 and 1700 zone could be next targetsAs I said in my previous analysis, there are 3 major cryptos that I really like: Ltc, Eth, and Bnb.
With both Ltc and Bnb working very well, it seems is time for Eth to recover recent losses...
Technically speaking, the recent drop found a strong floor just under 1.1k with bulls taking control twice in this zone.
Last week's drop is a higher low relative to 1.1k and a daily close above 1.3k would also confirm a double bottom in place.
The first resistance is at 1420, but in my opinion, 1700 is more likely in the medium term.
This bullish scenario is negated by a drop under 1.1k
