Ethsignals

ETHSlight rebound for ETH over the last few hours, test stopped by resistance around 2700. A descent to the support from 2450 is very likely, we will see what happens from there. A long moderate prediction for Eth today, once it reaches the 2450 support.

ETH ENTRIES + EXITS FOR THE WEEKHow To Play The Chart Entries/Exits:
Buy at green support entry, if it breaks by -30 pips (count it out) then enter a sell and ride to TP1, 2 and 3. Trail stop at each TP which means place your stop loss in profit but with enough room to be able to continue the sell if it continues. Same thing at resistance, sell but if broken by 30 pips then enter the buy and ride to TP1. Each TP is a support or resistance zone , so you could then even take a sell after TP1 for the buys have been hit and if it breaks out then just repeat.
I will be updating these charts letting you guys know the pip counts for the trades.
#ExclusiveFX

ETHThe day started badly for eth, which has dropped so far. We can say that it has formed a new support, and from here it can easily return for the rest of the day. How much he will recover, we will not be able to see until tomorrow. Moderate forecast from mid-day onwards.

ETHStrong resistance retested around 2900. The 4th rejection leads ETH to the intermediate support, which seems to form immediately below 2700. Possible lateral evolution in the channel formed between 2700 and 2900.

ETHEREUM - ETHBeautiful and more and more determined return for eth, who now has to pass the level of resistance marked with the red box. After the last few hours, he seems to have the strength to overcome this level. Long prediction today.

Ethereum, ETH - I expect on local correction👇🏻Preconditions:
- broken local trendline
- head and shoulders
- pressure of key level
Write in the comments all your questions and instruments analysis of which you want to see.
Friends, push the like button, write a comment, and share with your mates - that would be the best THANK YOU.
P.S. I personally will open entry if the price will show it according to my strategy.
Always make your analysis before a trade

ETHEREUM - ETHPerfect day yesterday for eth, who has a chance to continue the same today. If the excitement returns to Crypto, we will have a new day on the green. Long moderate prediction for ETH.

Ethereum, ETH - 57% drop😰when to buy?Price dropped 57% from high😱 Yesterday it was so big liquidation traders who have long positions. If the price comes back to 1950 - 2200, it will be the best zone for buying. The only spot)
Write in the comments all your questions and instruments analysis of which you want to see.
Friends, push the like button, write a comment, and share with your mates - that would be the best THANK YOU.
P.S. I personally will open entry if the price will show it according to my strategy.
Always make your analysis before a trade

Ethereum, ETH - everything looks like we'll grow locally.Price is closer to mirror level. A good accumulation from 3500 to 3900. Entry point only after breakout and retest. Don't forget about stop-loss!!!
Write in the comments all your questions and instruments analysis of which you want to see.
Friends, push the like button, write a comment, and share with your mates - that would be the best THANK YOU.
P.S. I personally will open entry if the price will show it according to my strategy.
Always make your analysis before a trade

ETHA medium resistance is now in front of ETH. If it exceeds 4000, it has the road open to previous highs. Long ETH today .....

I ANALYZE FOR YOUR COMFORT - ETH There is not much to say, so far the situation seems clear. Long prediction for eth today, as the graph shows!

I ANALYZE FOR YOUR COMFORT - ETHConsolidation channel for eth, who is just waiting for a small shot in the ass to take off to new heights. We live memorable times on Crypto, to take advantage while we still have the Bull Market :)
If you appreciate my analysis please like and follow. If you want other tools analyzed, leave their names in the comments, and in the next hour I will publish the analysis. Everything on green !!

ETH Bearish Divergence?Stochastic about to confirm downwards momentum technically we have to wait for both moving averages to drop under the 80 line to confirm ,there is also declining volume.

ETH/USDT - a great entry point for a long position.Time to buy🔥Preconditions:
- global uptrend
- local uptrend
- breakout of key level
- accumulation
Write in the comments all your questions and instruments analysis of which you want to see.
Friends, push the like button, write a comment, and share with your mates - that would be the best THANK YOU.
P.S. I personally will open entry if the price will show it according to my strategy.
Always make your analysis before a trade

ETHUSD ENTRIES + EXITS FOR THE WEEK!How To Play The Chart Entries/Exits:
Buy at green support entry, if it breaks by -30 pips (count it out) then enter a sell and ride to TP1, 2 and 3. Trail stop at each TP which means place your stop loss in profit but with enough room to be able to continue the sell if it continues. Same thing at resistance, sell but if broken by 30 pips then enter the buy and ride to TP1. Each TP is a support or resistance zone , so you could then even take a sell after TP1 for the buys have been hit and if it breaks out then just repeat.
I will be updating these charts letting you guys know the pip counts for the trades.
#ExclusiveFX

End of Ethereum Bull RunEthereum has been going crazy for the past days and has demonstrated a strong dependence on its own.
Now we can no longer talk about its correlation with bitcoin given that ETH kept going up while almost every other crypto melted down.
Ethereum is a strong project and is having great changes, 95% of blockchain projects rely on Ethereum network.
But after the quite parabolic move it had, it is time for a correction.
RSI is at an important level where price reversed many times
We can see a volume getting quite with a price-volume divergence and price-RSI divergence.
The next red candle might be tomorrow or the day after tomorrow and it would signal the end of this bull run.
Just watch out.
Share your thoughts in the comments and support me with a follow and a like for the idea.
Have a good day folks.


ETHUSD Projections for the next 4 months. Peak at 4k or 7k?Back in January 05 (2021) I posted the following idea that (understandably to some extent) was received with some skepticism by the trading community:
** The Fibonacci Channel and the 1.0 Fib lower rule **
As you see the $1900 target was achieved even before my March deadline, but the most impressive thing is how Ethereum managed to trade so accurately in the Red Rectangle of February - April. The fundamental idea of this study was that ETHUSD is trading on a Fibonacci Channel (Up) which "follows a very specific sequence since May 2020. When a new Fib line High is made, the price pulls back 1.0 Fib below. The Fib zones are quite clearly displayed on the chart. When ETH hit 1.0 Fib it pulled back to 0.0. When it hit 1.5, it pulled back to 0.5. This was repeated several times from May until December 2020, long enough to be considered consistent."
The pattern was confirmed once more (even though the first part was more aggressive than expected) as the price made a new High on the 3.0 Fibonacci extension and dropped 1.0 Fib lower for a Higher Low on the 2.0 Fib. That lasted until early February when the price made a new Higher High on the 3.5 Fib ext and again pulled-back 1.0 Fib lower to form the new Higher Low on the 2.5 Fib ext.
** What's next? Pattern 1 and Pattern 2 projections **
Well if this pattern is extended (and since it has been valid and in effect for 1 year there's no reason to expect it not to), then we should wait and see where the new High is made. Will it be on 4.5, following the more aggressive price action that the more recent Pattern 2 (from Nov 20 until now) displayed or will the price make a Lower High on the 3.0 Fib, following a less aggressive model similar to Pattern 1 (May 01 to Nov 20, 2020)?
** The role of the 1D MA100 **
In my opinion there are slightly fewer chances for a Pattern 1 projection to be realized as this would mean that the 1D MA100 (green trend-line) will break, when this trend-line has been supporting since this aggressive Fibonacci Channel started back in April 2020.
But what do you think? Will ETH follow a Pattern 1 projection and peak around $4000 by August or it will go for the more aggressive Pattern 2 and peak around $7000? Feel free to share your work and let me know in the comments section!
Please like, subscribe and share your ideas and charts with the community!
--------------------------------------------------------------------------------------------------------
!! Donations via TradingView coins also help me a great deal at posting more free trading content and signals here !!
🎉 👍 Shout-out to TradingShot's 💰 top TradingView Coin donor 💰 this week ==> tradertrain
--------------------------------------------------------------------------------------------------------


ETHUSD long signalETHUSD same situation as last ETH idea. I am using volume profile.
We are in support zone. First signal to buy long. But is very good buy to parts.
Check my other ideas, and my proffile. I will be happy for your support .

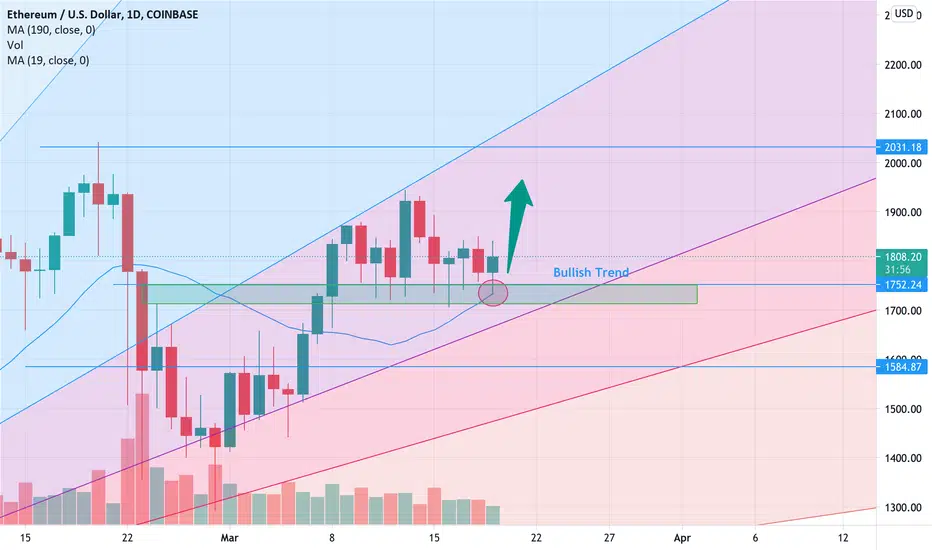
ETHUSD market is increasing.This might be a great opportunity for crypto traders to join a very promising bullish trend.
ETH - 4h. Buyers gave up and began a correction to $1560-1600?Good day everyone and have a good trading week!
The ETH market continues to move within two trend lines that form a wedge. The buyers failed to implement the optimistic scenario, which we wrote about in the previous idea .
However, this is not the worst thing. Notice how easily sellers on February 21 lowered the price by 10% and again tested the local critical point - the range of $1850-1880 . After this drop, buyers have not yet managed to regain control of the ETHUSD market. This becomes clear when you look at the price of BTC . Please note that after a sharp drop on February 21, the BTC price was able to renew its all-time high again and test the mark of $58352 . The ETHUSDT price could not repeat this:
Such behavior has started to be done on ideas, so the ETH buyers are coming to an end, and the ear of corrections to the growth of 7 fierce is to be read soon.
A signal of such a scenario will break through and fix prices below the range of $1850-1880 . As a result, sellers will be able to take control of the data in the range - they will be able to extend the price range of ETH to the range of $1560-1600.
The large timeframe shows that the trend line also passes near this range , which buyers have been holding confidently since January 11:
Another interesting fact can be seen by analyzing the dominance charts of BTC, ETH and USDT.
During the fall of BTC's dominance in late 2020, the ETH market revived significantly. However, since the end of January 2021, when the decline in BTC dominance began to slow down, interest in ETH has fallen sharply.
Looking at the situation on the BTC market now, in any scenario, the price of ETH will be in crisis . A sharp rise or fall in the price of BTC will have a negative impact on the ETH market. The only chance of success is the consolidation of BTC above $55,000.
In this case, ETH buyers will be able to hope for continued price movements within the white wedge and tests of the mark of $2070 . This week should be interesting!
________________________
We create both short-term ideas (for a local understanding of the market situation) and medium-term forecasts of price movements.
Subscribe to us and get daily concise analytics!
