ETH----Buy around 1960, target 2060 areaMarch 20 ETH technical analysis: Today, the large-cycle daily level closed with a medium-sized positive line yesterday, and the K-line pattern continued to rise. The price was above the moving average but at a low level. The fast and slow lines of the attached gold cross indicator were below the zero axis. The suppression at the weekly level was still relatively obvious. So we still have to continue to pay attention to the current rebound trend. The decline in the big trend remains unchanged, and there is a need for a rebound in a short time. This is the current trend situation; the short-cycle hourly chart price retreated under pressure this morning, but the overall retreat was not strong and did not continue. The current K-line pattern continued to fall, and the attached indicator was dead cross running. So we have to wait for the retracement support before entering the European session. The moving average resistance position is near the 1960 area.
Therefore, today's ETH short-term contract trading strategy: buy in the 1960 area when retreating, stop loss in the 1930 area, and target the 2060 area;
Ethsignals

ETHEREUM -Weekly forecast,Technical Analysis & Trading IdeasMidterm forecast:
While the price is above the support 1521.00, beginning of uptrend is expected.
We make sure when the resistance at 2090.33 breaks.
If the support at 1521.00 is broken, the short-term forecast -beginning of uptrend- will be invalid.
BITSTAMP:ETHUSD MARKETSCOM:ETHEREUM
Technical analysis:
A trough is formed in daily chart at 1750.30 on 03/11/2025, so more gains maximum to Major Resistance (2090.33) is expected.
Take Profits:
2362.31
2546.73
2801.10
3042.75
3516.43
3741.60
4107.80
4500.00
4868.00
__________________________________________________________________
❤️ If you find this helpful and want more FREE forecasts in TradingView,
. . . . . . . . Hit the 'BOOST' button 👍
. . . . . . . . . . . Drop some feedback in the comments below! (e.g., What did you find most useful? How can we improve?)
🙏 Your support is appreciated!
Now, it's your turn!
Be sure to leave a comment; let us know how you see this opportunity and forecast.
Have a successful week,
ForecastCity Support Team

ETHUSDT 📉 ETHUSDT Trade Signal 📈
🔥 Long Entry: $1,990
🎯 Targets:
✅ 1️⃣ $2,277
✅ 2️⃣ $2,507
✅ 3️⃣ $2,818
🛑 Stop Loss: $1,774
⚡ Breakout Watch: Wait for confirmation above $1,990 before entering! 🚀

SHORT AND LONG OPPORTUNITY IN ETHmarket can go any direction after the breakout
if btc shows weakness then best shorting opportunity in eth

Ethereum Downside to 1000!!!Ethereum has already broken the upward support trendline within the double top formation.
A break of that support line is bearish for Ethereum, especially now that it looks to complete its double top formation.
Ethereum may have a short interim bounce back to 2200 from todays levels of 1800. But will most likely fail to 1000, where that is the next support zone nearby.
Bitcoin looks like its on its way to retest its prior breakout zone of 65-70k, which would mean a 20% decline in bitcoin. If BTC were to decline 20%, this would bring a 40%+ decline in other coins including ETH. Which would indicate if BTC fell to 65k, it would solidify ETH drop to 1000.

ETH(based on NEo wave)This supercycle is a nice nature triangle which E wave is ending and its look like a diamon diametrical.
so I will update it for the confirmation, I think ALTseason is so close and we can see that happening soon but this season take about 400 to 450 days and after that there is a huge CRASH!

Ethereum at Critical Levels – Breakout or Breakdown for ETH?Ethereum (ETH) is looking heavily overextended right now 📊, with price action pressing into key support zones on the daily and weekly charts ⏳. The market is at a critical juncture, and a sharp pullback 📉 could be on the cards.
This could present a short-term counter-trend buying opportunity on the lower timeframes 💰, but if ETH pushes higher, it may offer a prime short setup 🎯.
⚠️ Not financial advice – trade smart and manage risk accordingly! 🚀

Short Trade at Ethereum executed Strong signal received on ETH which shows a Profit Factor of 4.00 in Short Trading at the 15min timeframe. The trade was open for 45min and the Exit was placed at a very nice spot.
Would you like to receive such sort of signals in realtime? Tell me in the comments and follow for more!

Ready For ATH?Ethereum's three-month timeframe analysis shows that the price could reach all highs from here.

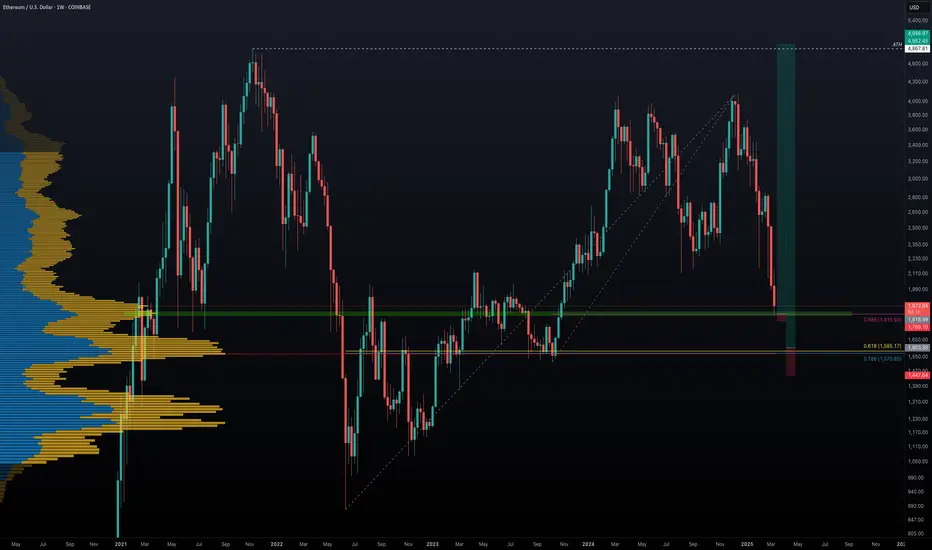
Ethereum's Potential Bottom: Could $5000 Be Next?Ethereum has experienced a significant 56% drop over the last 84 days. Has ETH found its bottom, or is more downside ahead? Let's break it down.
🔹 Fibonacci Retracement from October Low (2023) to December High (2024)
Starting with the Fibonacci retracement from the low of $1520.85 on 12th October 2023 to the high of $4109 on 16th December 2024, ETH recently hit the 0.886 Fib retracement at $1815.9 and saw a bounce. This area aligns with the Point of Control (POC) from previous price action, a potential signal that this could be a major support zone.
However, the real question is whether this is the final bottom, or if ETH will retest lower levels.
🔹 Further Fibonacci Retracement Analysis
Next, we take a larger Fibonacci retracement, from the low of $879.8 on 18th June 2022 to the high of $4109. The 0.786 Fib retracement at $1570.85 appears to be a critical support zone, as it also coincides with the POC in the volume profile of the entire market structure. This indicates that the $1570-$1600 region is a significant area of interest for buyers to step in.
🔹 Log Scale Fibonacci Confluence
To further strengthen this analysis, applying the same Fibonacci retracement on a log scale shows the 0.618 Fib retracement at $1585.17, very close to the POC and 0.786 Fib level, reinforcing this region as a major support zone.
🔹 High-Probability Long Setup
If ETH revisits the $1570-$1600 zone, this forms an ideal high-probability long setup with excellent risk/reward potential. A potential R:R ratio of more than 20:1 could materialise if this setup plays out and price targets $5000 as a take-profit level. The stop loss placement will determine the exact risk-to-reward, but the reward could be massive if this level holds.
💬 What are your thoughts? Will Ethereum find its bottom around these key levels? Excited to see how this develops! 🚀
ETH → Gearing Up for $10,000!? Or $1,200? Let's Answer.Ethereum finally fell into my buy zone this past week and I was able to buy with an average price of $2,185.18. This is a target I've been watching for months in anticipation. The best part is that it may go lower!
How do we trade this? 🤔
ETH has landed on a key support area of $2,100 and is now flirting with falling to the .236 Fib level at $1,800. A final target would be around $1,500 which brings us back into the bear market range. ETH formed a triple top over the course of 2024 and as expected, it pulled back hard with the alt market.
Bitcoin Dominance has been in a bull trend since the last cycle and hasn't shown any signs of weakness yet. Currently at 62%, it could jump up to 70% easily. Until it drops, ETH and the alts are going to remain bleeding out.
I'm targeting the previous all-time high for a first profit target, around $4,800. Whether I take profits at that level depends on the price action leading up to it. If we get a strong push with strong candle closes leading up to that price, I'll likely hang on. Otherwise, I may take 25% of my position off the table and look for a potential re-entry.
Final target price is $6,750, just below the 1.618 Fib level. This level also corresponds with a measured move target if the price attempts $4,000, pulls back to the 3-Year Support, then moves up again. I believe $10,000 ETH is absolutely possible for this run, but given how slumpy the alt market is, I don't see that probability being as high as the previous high of $7,000. This is why I'm taking my profits before that 1.618 Fib level is hit.
💡 Trade Idea 💡
Long Entry: $2,185.18
🟥 Stop Loss: $700
✅ Take Profit #1: $4,800
✅ Take Profit #2: $6,750
⚖️ Risk/Reward Ratio: 1:3
🔑 Key Takeaways 🔑
1. 2024 Triple top led to a retrace down to the 2023 range.
2. First buy at $2,185.18, potential buy at $1,800 and $1,500
3. Stop loss at $700 below the 2022 bear market low
4. Holding the position until the previous all-time high around $4,850 where the first take profit waits. $6,750 is the second take profit just before the 1.618 fib level
5. Weekly RSI is near 34.00 and below the Moving Average. This is a good level to buy.
💰 Trading Tip 💰
Ascending Wedges signal an increased probability of a bear breakout. Combined with three pushes up in a bull trend and strong sell bars (candles with large wicks on their tops), creates conditions where a counter-trend trade is reasonable.
⚠️ Risk Warning! ⚠️
Past performance is not necessarily indicative of future results. You are solely responsible for your trades. Trade at your own risk!
Like 👍 and Follow to learn more about:
1. Reading Price Action
2. Chart Analysis
3. Trade Management
4. Trading Psychology

Ethereum at Key Support Zone: Is a Counter-Trend Setting Up?Ethereum (ETH) is currently in a strong bearish trend 📉, but it has traded into a key support zone 🛑 and seems overextended, in my opinion. Looking at the price action and market structure on the daily and four-hour timeframes, we’re now seeing Ethereum form higher highs and higher lows on the four-hour chart 📊. While it’s still early, if we see a break above the current range high on the four-hour timeframe, there could be an opportunity for a counter-trend trade 🔄, targeting equilibrium ⚖️ and a previous imbalance highlighted in the video. As always, this is for educational purposes only and should not be taken as financial advice 💡.

ETH/USDT 1H: Bullish Momentum – Next Target $2,520?ETH/USDT 1H: Bullish Momentum – Next Target $2,520?
🚀 Follow me on TradingView if you respect our charts! 📈 Daily updates!
Current Market Structure (Confidence 8/10) :
Price: $2,220, confirming a bullish structure from the discount zone.
Hidden bullish divergence confirmed on RSI (58.46), supporting upward momentum.
Market Makers (MMs) engineered a liquidity grab at $2,040, indicating strong accumulation.
Clean break above equilibrium at $2,200, signaling continuation.
Trade Recommendation:
Entry: Current price ($2,220) or pullback to $2,180.
Targets:
T1: $2,360
T2: $2,480
T3: $2,520
Stop Loss: $2,160 (below equilibrium zone).
Risk Score:
8/10 – Strong risk-to-reward setup with clear invalidation.
Market Maker Activity:
Accumulation phase complete at the $2,040 zone.
Currently engineering moves toward the premium zone ($2,520).
Likely targeting shorts above $2,360 before the next push.
Smart Money Insight:
Institutional accumulation is evident, with clear buying pressure.
Structure suggests another leg up, but traders should monitor resistance near $2,520 in the premium zone.
🚀 Follow me on TradingView if you respect our charts! 📈 Daily updates!

#ETH/USDT#ETH
The price is moving in a descending channel on the 1-hour frame and is adhering to it well and is heading to break it strongly upwards and retest it
We have a rebound from the lower limit of the descending channel, this support is at a price of 1950
We have a downtrend on the RSI indicator that is about to break and retest, which supports the rise
We have a trend to stabilize above the moving average 100
Entry price 2236
First target 2340
Second target 2414
Third target 2530

ETHEREUM COIN ANALYSIS AND NEXT POSSIBLE MOVES!!CRYPTOCAP:ETH Coin Update!!
• Technically Overall CRYPTOCAP:ETH Structure look Bearish.
• Two major support areas are marked on a chart.. ( First Support 1950$-1880$ ) & ( 2nd support is 1550$ )
• Where you are able to add CRYPTOCAP:ETH For Long-term in your Portfolio & Also you are able to build trade setups on it... If price respect these levels🫡
Warning : DYOR Before taking any action🚨

ETH CMEThere are three gaps on the ETH's CME chart:
-Gap 1 : $2250
-Gap 2 : $2600
-Gap 3 : $3200
The current ETH price is $2355, High possibility of filling all gaps,especially the $3200 gap in March.

Whales ACCUMULATING ETH 🚨MartyBoots here , I have been trading for 17 years and sharing my thoughts on ETH here.🚨
.
🚨 COINBASE:ETHUSD is looking beautiful , very interesting chart for more upside
and is now into support🚨
Here is a link to Trading View news section showing whales accumulating COINBASE:ETHUSD
Do not miss out on COINBASE:ETHUSD as this is a great opportunity
Watch video for more details

Where is Ethereum going from here?Where Is Ethereum Headed Next?
Ethereum’s price action has been holding firm within a key support zone, demonstrating resilience despite broader market uncertainties.
However, a break below this critical support level—which aligns with the top ascending trendline—could signal further downside potential.
Technical Outlook:
If macroeconomic and fundamental pressures continue to weigh on the crypto market, Ethereum may lose its current support, potentially leading to a decline toward $2,500 and possibly even $2,200.
From an investment perspective, I plan to accumulate ETH gradually using a dollar-cost averaging (DCA) strategy around the $2,200 zone. A further drop to $1,500 would present a significant long-term buying opportunity at a discounted level.
What are your thoughts on ETH’s next move?
Let’s discuss—feel free to share your insights, like, and follow for more updates!

ETH/USD SELLThis analysis is based on the provided image and should not be considered financial advice. Trading involves risks, and it is essential to conduct your own research and consult with a financial advisor before making any trading decisions.

Ethereum’s Dip: A Golden Buying Opportunity?Ethereum has been a disappointment for traders.
Many were expecting a new all-time high, but so far, Ethereum has failed to deliver.
However, for speculators like me, this type of market movement presents an ideal trading opportunity.
Recently, ETH reached a key confluence support zone around the psychologically significant $2,000 level, reinforced by multiple technical factors. This setup suggests a strong potential for a reversal.
What’s Next?
✅ The $2,000 support zone remains critical, and I expect it to hold, leading to an upside move.
✅ While not aiming for extreme highs, I’m looking to buy dips near $2,200 with a target around $2,800.

Ethereum Market OverviewThis analysis builds upon the previous technical outlook, identifying three key patterns on Ethereum’s daily timeframe:
1. Ascending Channel
Ethereum has been trading within a well-established ascending channel since 2018. Each time a new all-time high (ATH) is reached, price consistently tests the channel’s resistance, while the major support level was formed on March 23, 2020, creating a strong demand zone that remains intact.
Currently, ETH has reached the lower boundary of this channel at $2,128, a key support level. If a bullish reversal occurs, the next upside target aligns with the ascending channel resistance at $8,463.
2. Symmetrical Triangle
A symmetrical triangle pattern has been forming since March 23, 2020, with its support level coinciding with the lower boundary of the ascending channel. A confirmed breakout above $3,600 would validate this pattern, triggering a bullish AB=CD extension, with a price projection towards $8,463.
3. Fibonacci Retracement
Currently, ETH is testing the 0.618 Fibonacci retracement level, a critical zone for potential trend reversals. If this level holds against bearish pressure, the next bullish projection aligns with the 1.618 Fibonacci extension at $5,319.
Breakdown Risk & Buyback Strategy
If the current support level fails, ETH could see a maximum downside correction of -26%, targeting $1,600. This level presents a high-probability buyback opportunity, offering a potential +437% upside, should Ethereum rally towards its extended price projection at $8,463.
This analysis underscores the importance of risk management and technical confirmation signals before executing any trades.

ETH | ByBit HACK causes MASSIVE SELL-OFFBybit got hit with a serious security breach.
$1.4 billion was hacked in Ethereum, which is a huge amount of ETH. 2 Apparently the trouble started with their cold wallet, where they keep a lot of their crypto offline. The investigation points to the North Korean Lazarus Group as the likely culprits, and it seems the attack originated from some malicious code within their wallet provider, Safe Wallet.
Currently there's a big push to track down the stolen funds, and Bybit's even offering a bounty, but it's unlikely the funds will be recovered. It's important to understand that this wasn't necessarily a fault of Bybit's own security, but rather a problem with the wallet provider they were using.
Bybit has reassured users that withdrawals remain unaffected and other cold wallets are secure. While investigations into the incident continue, early speculation about Bybit buying back ETH to cover losses, which briefly boosted ETH's price, was dispelled by CEO Ben Zhou. He clarified that a bridge loan covered 80% of the stolen ETH, and there are no plans for spot market purchases. The hackers now holds a substantial amount of ETH across multiple wallets, raising concerns about potential drops should they decide to sell, but this may occur gradually over many months or even years (since they didn't buy it / it will not matter at what price it is sold).
This hack coincides with ETHDenver, a major Ethereum event typically associated with bullish market conditions and optimism. But overall, the outlook for Ethereum isn't looking as bright as it usually would be and this may lead to a further sell-off once more people catch on.
_________________
BINANCE:ETHUSDT

ETH - LONGEthereum has dropped more than 40%, it was hacked, people sold, and it's also a bit lower than before the election results. The Fear & Greed Index is at 10, something that hasn't happened since 2022. It's time to give it a chance. I think it's a good buying opportunity. There is support at 2000 and then around 1700. So it could keep falling, but I think it's a good time to start preparing anyway.
