You thinking of buying ETH ? read this first
There is a saying- "Charts NEVER lie"
And here it is
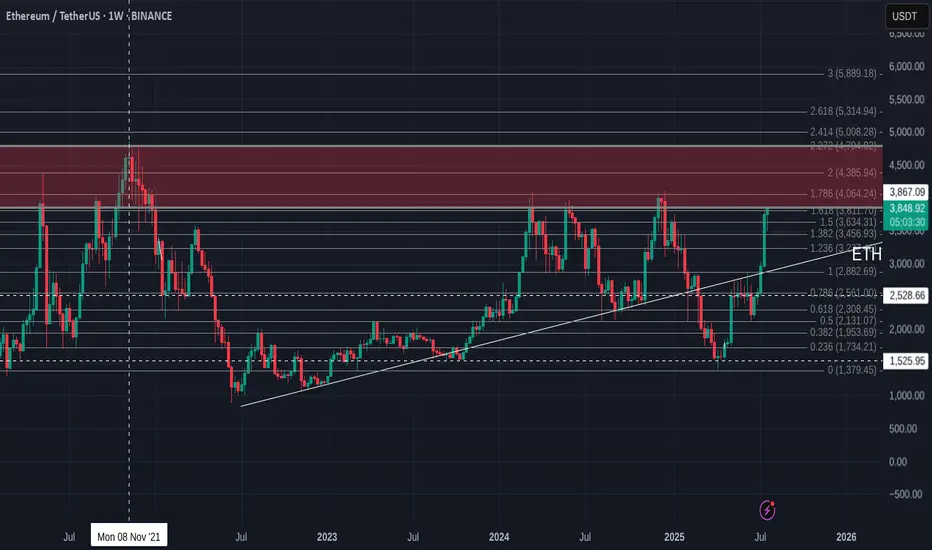
ETH USDT Weekly chart, suggesting that, right now, ETH is up against resistance that has rejected it more times than it has been support.
The RSI on this chart also suggests a pull back is coming
Again, RSI has been rejected in this range more times than it found support
Conclusion -WAIT before you buy and see if it crosses that line of resistance and tests it as support before you spend your money
Just saying
Ethtrading
Navigating the ETH Volume Wall as Capital Rotates to High-Beta
In the intricate and often volatile theater of the cryptocurrency markets, Ethereum (ETH) currently finds itself in a moment of profound tension. As the undisputed king of smart contracts and the foundational layer for decentralized finance (DeFi), its price action sends ripples across the entire digital asset ecosystem. The current outlook presents a fascinating dichotomy: on one hand, Ethereum is staring down a formidable "volume wall," a dense zone of historical trading activity that acts as a powerful barrier to upward momentum. On the other hand, the tantalizing prospect of a decisive breakout above the key $2,900 level beckons, promising a new leg up for the bull market.
This standoff has created a fertile ground for a classic market phenomenon: capital rotation. As Ethereum grinds sideways, battling for every percentage point against heavy resistance, impatient capital is beginning to flow into more nimble, higher-risk assets within its orbit. Traders and investors are increasingly eyeing "cheap crypto"—smaller, more volatile altcoins built on or related to the Ethereum network. These "ETH beta" plays are rallying in anticipation of an eventual Ethereum breakout, offering the potential for outsized returns.
This comprehensive analysis will dissect the complex dynamics shaping Ethereum's current price outlook. We will explore the nature of the heavy volume wall that is capping its ascent and the strategic implications of the resulting price range. We will then delve into the mechanics of capital rotation, examining why traders are turning to lower-cap altcoins as a proxy for Ethereum's future success. Finally, we will weigh the bullish and bearish cases, charting the potential path to a $2,900 breakout while acknowledging the significant risks that could invalidate the optimistic thesis. For investors and market observers, understanding this intricate dance between consolidation, rotation, and breakout potential is paramount to navigating the next chapter in Ethereum's journey.
Part 1: The Great Wall of Ethereum - Deconstructing the Heavy Volume Range
To understand Ethereum's current struggle, one must first grasp the concept of a "volume wall." This is not a literal barrier, but a powerful technical and psychological construct visible on a price chart. It represents a price range where an unusually high volume of tokens has changed hands in the past. This area of high trading concentration becomes a major point of contention for future price movements, acting as a powerful magnet for both support and, in this case, resistance.
What is a Volume Wall and Why Does It Form?
A volume wall is best visualized using an indicator like the Volume Profile Visible Range (VPVR). Unlike traditional volume bars at the bottom of a chart that show volume per unit of time, the VPVR displays it horizontally, showing volume per price level. A large, protruding bar on the VPVR signifies a "High-Volume Node" (HVN), which is the technical term for a volume wall.
These walls form for several key psychological reasons:
1. Breakeven Sellers ("Bagholders"): A significant number of market participants may have bought ETH within this price range during a previous rally. When the price fell, they were left holding at a loss. Now, as the price returns to their entry point, their primary emotion is relief. Their goal is not to make a profit, but simply to exit their position at breakeven. This creates a steady stream of sell orders as the price enters the high-volume zone.
2. Strategic Profit-Takers: Investors who bought Ethereum at much lower prices see this high-volume area as a logical and predictable place to take profits. They recognize it as a zone of contention and potential reversal, making it an opportune moment to sell a portion of their holdings and de-risk.
3. Opportunistic Short-Sellers: Traders who are bearish on Ethereum view the volume wall as a high-probability area for the price to be rejected. They will strategically place short-sell orders within this range, adding to the selling pressure and betting on a move back down.
When these three forces converge, they create a formidable supply zone that can absorb a tremendous amount of buying pressure. For Ethereum to break through, it requires a catalyst strong enough to overwhelm this confluence of sellers.
Identifying Ethereum's Current Range
For the purpose of this analysis, let's assume this heavy volume wall for Ethereum is situated roughly between $2,750 and $2,850. This range becomes a battleground. When the price enters this zone, it often loses momentum and begins to move sideways in a "chop," characterized by volatile price swings without a clear direction.
The implications of being trapped below such a wall are significant. The market enters a state of consolidation or ranging. This means that for the time being, the explosive, directional trend is on pause. Bulls and bears are locked in a battle for control, and until one side emerges victorious, the price will likely remain contained. This period of consolidation, while frustrating for trend-followers, is a critical phase where the market digests previous gains, flushes out weak hands, and builds energy for its next major move. The key question for every trader is which direction that move will be.
Part 2: The Rotation Game - Chasing Beta in a Sideways Market
When a market leader like Ethereum enters a prolonged consolidation phase, a fascinating secondary effect begins to take hold: capital rotation. Traders and investors, particularly those with shorter time horizons, grow impatient with the lack of volatility in the primary asset. Their capital seeks higher returns and more immediate action, leading them to rotate out of the ranging asset and into more speculative plays. In the context of the crypto market, this often means moving into "high-beta" altcoins.
Understanding "ETH Beta"
In traditional finance, "beta" measures an asset's volatility in relation to a benchmark, like the S&P 500. An asset with a beta of 1.5 is expected to move 1.5% for every 1% move in the benchmark. In cryptocurrency, Ethereum itself often acts as a benchmark for the broader altcoin market.
"ETH beta" refers to altcoins that are highly correlated with Ethereum's price but exhibit much higher volatility. These are typically smaller, newer, or more speculative projects within Ethereum's ecosystem. The logic behind the "ETH beta play" is straightforward:
• If you believe Ethereum will eventually break through its resistance wall and rally, you can simply buy and hold ETH.
• However, if you want to maximize potential returns, you can instead buy a high-beta altcoin. The thesis is that when ETH finally moves up 10%, this smaller altcoin might surge 30%, 50%, or even more.
This strategy is essentially a leveraged bet on Ethereum's success, but without using financial leverage like futures or options. The leverage comes from the inherent volatility of the smaller asset.
The Allure of "Cheap Crypto"
The rotation often targets what is colloquially known as "cheap crypto." This term doesn't necessarily mean the project is undervalued, but rather that its token has a low unit price (e.g., under $1 or even fractions of a cent). This has a powerful psychological appeal:
• Accessibility: It feels more accessible to buy 1,000,000 tokens of a memecoin for $1,000 than to buy a fraction of one ETH.
• Perceived Upside: The low unit price creates the perception of explosive growth potential. It's psychologically easier to imagine a token going from $0.01 to $0.10 (a 10x return) than it is to imagine ETH going from $2,800 to $28,000.
During Ethereum's consolidation, we would likely see this rotation manifest in several key sectors of its ecosystem:
• Layer 2 Solutions: Projects like Arbitrum (ARB), Optimism (OP), and Polygon (MATIC) are prime candidates. They are fundamentally linked to Ethereum's scalability and success, making them a direct beta play. As traders anticipate an ETH breakout, they will front-run the move by accumulating these L2 tokens.
• DeFi Blue Chips and Dapps: Protocols for lending, borrowing, and trading, such as Uniswap (UNI), Aave (AAVE), or Lido (LDO), also fall into this category. Their usage and value are directly tied to the health of the Ethereum network.
• Memecoins and Newer Narratives: This is the highest-risk, highest-reward end of the spectrum. Memecoins built on Ethereum (like PEPE or SHIB) or on its Layer 2s can experience parabolic rallies based on pure speculation and social media hype, driven by the narrative that a rising ETH tide will lift all boats.
This rotation is a double-edged sword. While it signals underlying bullish conviction in the Ethereum ecosystem, it also diverts buying pressure away from ETH itself, potentially prolonging the consolidation phase. However, it is a clear sign that the market is positioning for an eventual breakout.
Part 3: The Bull Case - Charting a Path to the $2.9K Breakout
Despite the formidable resistance, a powerful bull case for Ethereum is building, suggesting that a breakout above the $2,900 level is not a matter of if, but when. This optimism is rooted in a combination of bullish technical patterns, strengthening on-chain fundamentals, and a powerful external narrative.
The Technical Setup for a Breakout
While the price may be moving sideways, a closer look at the chart often reveals underlying strength building beneath the surface. Several technical patterns and indicators could signal an impending breakout:
• Ascending Triangle Formation: A classic bullish pattern. This would be characterized by the price making a series of higher lows while being capped by the horizontal resistance of the volume wall (around $2,850-$2,900). The higher lows indicate that buyers are becoming more aggressive on each dip, squeezing the price upwards against the resistance. A breakout from the top of this triangle would be a powerful technical signal.
• Bullish Engulfing or Hammer Candlesticks: The appearance of strong bullish candlestick patterns at key support levels below the range would indicate that buyers are stepping in with force, absorbing selling pressure and defending the uptrend.
• Resetting Momentum Oscillators: During a consolidation phase, indicators like the Relative Strength Index (RSI) will cool off from "overbought" levels. If the RSI can reset back to neutral territory (around 50) while the price remains stable, it suggests the market is building up energy for another push higher without being overextended. A "hidden bullish divergence," where the price makes a higher low while the RSI makes a lower low, would be an even stronger signal of trend continuation.
• Support from Key Moving Averages: For the bull case to remain intact, Ethereum's price must hold above critical long-term moving averages, such as the 50-day and 200-day Simple Moving Averages (SMAs). These levels often act as dynamic support, and successful bounces from them reinforce the underlying bullish trend.
Fundamental and On-Chain Catalysts
Beyond the charts, Ethereum's fundamental health provides a strong tailwind for a potential rally:
• The Spot Ether ETF Narrative: The single most powerful potential catalyst on the horizon is the approval of a spot Ether ETF in the United States. Following the monumental success of the Bitcoin ETFs, the market anticipates that an Ether ETF would unlock a similar torrent of institutional capital. This narrative alone is enough to encourage accumulation, as investors look to position themselves ahead of a potential approval. Any positive news or regulatory progress on this front could provide the immense buying pressure needed to shatter the volume wall.
• Deflationary Supply Dynamics (The Burn): Thanks to the EIP-1559 upgrade, a portion of every transaction fee on Ethereum is "burned," or permanently removed from circulation. During periods of high network activity, this can make ETH a deflationary asset, meaning more coins are being destroyed than created. This programmatic scarcity is a powerful long-term value driver that makes holding ETH more attractive.
• The Growth of the Layer 2 Ecosystem: The success of Layer 2 solutions like Arbitrum and Optimism is not a threat to Ethereum but a testament to its success. These networks bundle transactions and settle them on the Ethereum mainnet, increasing its overall throughput and utility. A thriving L2 ecosystem drives demand for ETH as the ultimate settlement and data availability layer, strengthening its fundamental value proposition.
• Staking and Supply Sinks: A significant and growing portion of ETH's total supply is locked up in staking contracts to secure the network. This staked ETH is effectively removed from the liquid, circulating supply available for sale on exchanges. This continuous supply reduction creates a "supply shock" dynamic, where even a moderate increase in demand can have an outsized impact on the price.
When these technical and fundamental forces align, they create a powerful case that the consolidation phase is a temporary pause before the next major uptrend. A decisive break and close above $2,900 would liquidate short positions, trigger FOMO (Fear Of Missing Out) buying, and likely signal the start of a rapid move towards the next major psychological and technical target, potentially $3,500 or higher.
Part 4: The Bear Case and Prevailing Risks
A balanced analysis requires acknowledging the significant risks that could invalidate the bullish thesis. The volume wall is formidable for a reason, and a failure to break through could lead to a sharp reversal. Several factors could contribute to a bearish outcome for Ethereum.
Rejection at the Wall
The most immediate risk is a decisive rejection from the volume wall. If buying pressure wanes and sellers take firm control within the $2,750-$2,850 range, it could signal a local top. This would likely be confirmed by a break below the recent series of higher lows and key moving averages. Such a rejection could trigger a cascade of stop-loss orders from long positions, accelerating a move downwards to retest lower support levels, potentially in the $2,400-$2,500 range.
Macroeconomic Headwinds
As a major global asset, Ethereum is not immune to the broader macroeconomic environment. A "risk-off" sentiment sweeping through traditional markets would almost certainly impact crypto. Factors that could trigger this include:
• Hawkish Central Bank Policy: Unexpectedly high inflation data could force central banks like the Federal Reserve to maintain high interest rates for longer, or even signal further hikes. This "tight liquidity" environment is generally negative for risk assets like cryptocurrencies.
• Geopolitical Instability: An escalation of global conflicts can cause investors to flee to perceived safe havens like the US dollar or gold, pulling capital away from more speculative markets.
• Recessionary Fears: Signs of a weakening global economy could dampen investor appetite for risk, leading to broad-based selling across asset classes.
Regulatory Uncertainty
Regulatory risk remains a persistent cloud over the entire crypto industry, and Ethereum is at the center of a key debate. The U.S. Securities and Exchange Commission (SEC) has not definitively clarified whether it views ETH as a commodity (like Bitcoin) or a security. A negative ruling, or even prolonged legal battles suggesting it will be classified as a security, could have a chilling effect on the market. It would create significant compliance hurdles for exchanges and could derail the spot Ether ETF narrative entirely. Any negative headline on this front could be the catalyst that turns the volume wall from a temporary obstacle into an impenetrable ceiling.
Competitive Pressures
While Ethereum remains the dominant smart contract platform, it faces ever-growing competition from other Layer 1 blockchains (often dubbed "ETH Killers") like Solana, Avalanche, and others. These platforms boast high transaction speeds and low fees and are constantly vying for market share in the DeFi and NFT spaces. While a multi-chain future is the most likely outcome, a significant migration of developers and users away from Ethereum to a competitor could erode its network effect and negatively impact its long-term valuation.
Conclusion: A Pivotal Moment of Decision
Ethereum stands at a critical juncture, a crossroads where powerful bullish and bearish forces are locked in a tense equilibrium. The price is pinned against a heavy volume wall, a technical barrier representing the collective memory of the market. This has forced the asset into a period of consolidation, a sideways grind that is testing the patience of even the most steadfast bulls.
This very consolidation is fueling a secondary narrative of capital rotation, where traders, anticipating an eventual breakout, are channeling funds into higher-volatility "ETH beta" plays. The rallies in Layer 2 tokens and other ecosystem projects are a vote of confidence in Ethereum's future, a sign that the market is positioning for upside. The fundamental picture, bolstered by the potential of a spot ETF, deflationary supply mechanics, and a thriving ecosystem, provides a strong foundation for the bull case. The path to a $2,900 breakout seems not only possible but plausible.
However, the risks are undeniable. A failure to breach the wall could lead to a sharp correction, exacerbated by potential macroeconomic headwinds or negative regulatory surprises. The outcome of this battle will be pivotal. A successful breakout would reaffirm Ethereum's market leadership and likely kickstart a new wave of adoption and price appreciation across the entire altcoin space. A rejection would signal a deeper correction and a longer period of uncertainty. For now, the market holds its breath, watching the wall, waiting for the rotation to culminate, and anticipating the decisive move that will set the tone for the months to come.

Ethereum Whale Buys $422M in ETH: Bullish Signal or False Hope?
The cryptocurrency market has always been a playground for big players, often referred to as "whales," whose massive transactions can influence market sentiment and price action. Recently, one such Ethereum whale has made headlines by accumulating a staggering $422 million worth of ETH in less than a month. This aggressive buying spree has sparked curiosity and speculation among investors and analysts alike. Is this whale positioning for a massive rally, or are they simply hedging against market uncertainty? Let’s dive into the details of this significant accumulation and explore its potential implications for Ethereum’s price trajectory.
The Whale’s Buying Spree: A Breakdown
Blockchain analytics platforms like Lookonchain and Whale Alert have been tracking the movements of this Ethereum whale over the past few weeks. According to their data, the whale has been systematically purchasing large quantities of ETH across multiple transactions, totaling over 150,000 ETH at an average price of approximately $2,800 per token. This accumulation, valued at $422 million, represents one of the largest buying sprees by a single entity in recent months.
What’s particularly intriguing is the timing of these purchases. The whale began accumulating during a period of relative market uncertainty, with Ethereum hovering near key support levels after a significant correction from its earlier highs. This suggests that the whale may have viewed these price levels as a buying opportunity, potentially anticipating a rebound or long-term growth in Ethereum’s value.
Why Are Whales Accumulating Now?
There are several reasons why a whale might choose to accumulate such a massive amount of ETH at this juncture. First, Ethereum remains the backbone of decentralized finance (DeFi) and non-fungible tokens (NFTs), two sectors that continue to drive innovation and adoption in the crypto space. Despite short-term price volatility, Ethereum’s fundamentals—such as its developer activity, network usage, and upcoming upgrades—remain strong.
Second, the whale may be betting on the long-term impact of Ethereum’s transition to Proof-of-Stake (PoS) via the Merge and subsequent upgrades like sharding. These upgrades are expected to make Ethereum more scalable, energy-efficient, and cost-effective, potentially driving greater adoption and value over time.
Finally, macroeconomic factors could be at play. With inflation concerns and uncertainty in traditional markets, some institutional investors and high-net-worth individuals are turning to cryptocurrencies like Ethereum as a store of value or hedge against economic instability. This whale’s buying spree could be a signal of growing institutional interest in Ethereum as a long-term investment.
Market Implications of the Whale’s Actions
The actions of whales often have a ripple effect on the broader market. When a single entity accumulates such a large amount of a cryptocurrency, it can create a supply crunch, reducing the amount of ETH available for sale on exchanges. This, in turn, can drive up prices if demand remains constant or increases.
Moreover, whale activity often attracts the attention of retail investors, who may interpret such moves as a bullish signal. Social media platforms like Twitter and Reddit are already buzzing with discussions about this whale’s accumulation, with many speculating that a major price rally could be on the horizon. However, it’s worth noting that whale movements can also be a double-edged sword—while accumulation can signal confidence, sudden sell-offs by the same whale could trigger panic and price crashes.
For now, the Ethereum market appears to be reacting positively to this news. In the days following the whale’s most recent purchases, ETH’s price has shown signs of recovery, bouncing off key support levels. But is this just a temporary blip, or the beginning of a sustained rally? Let’s explore this further in the next section.
________________________________________
Ethereum Bounces Hard After Support Bluff: A False Alarm or Fresh Rally?
Ethereum’s price action in recent weeks has kept traders on edge. After a prolonged period of consolidation and a dip toward critical support levels, ETH staged a powerful bounce, reclaiming key technical levels and reigniting hopes of a broader rally. However, the question remains: is this bounce a genuine signal of bullish momentum, or merely a false alarm before another downturn?
The Support Bluff and Subsequent Bounce
Ethereum had been trading in a tight range for much of the past month, with $2,500 acting as a crucial support level. This level was tested multiple times, and on several occasions, it appeared that bears would succeed in pushing the price lower. However, each time ETH approached this support, buyers stepped in, preventing a breakdown.
This repeated defense of $2,500 created what some analysts call a “support bluff”—a situation where the market tests a key level multiple times, creating uncertainty about whether it will hold. Just when it seemed like the support might finally give way, Ethereum staged a hard bounce, surging over 10% in a matter of days to reclaim the $2,800 level. This move caught many traders off guard, particularly those who had positioned for a breakdown.
Technical indicators also supported the bullish case for this bounce. The Relative Strength Index (RSI) moved out of oversold territory, signaling renewed buying pressure, while the Moving Average Convergence Divergence (MACD) showed a bullish crossover on the daily chart. Additionally, on-chain data revealed a spike in transaction volume and active addresses during the bounce, suggesting that the move was backed by genuine market participation.
False Alarm or Fresh Rally?
While the bounce has undoubtedly injected optimism into the Ethereum market, it’s too early to declare a full-fledged rally. Several factors could determine whether this move has legs or if it’s just a temporary relief rally before further downside.
On the bullish side, the whale accumulation discussed earlier could provide a psychological boost to the market. If other large players follow suit and start buying ETH at these levels, it could create a self-reinforcing cycle of demand. Additionally, Ethereum’s fundamentals remain strong, with ongoing developments like the upcoming Cancun-Deneb (Dencun) upgrade, which aims to reduce Layer 2 transaction costs, potentially driving greater adoption.
However, there are also bearish risks to consider. The broader cryptocurrency market remains correlated with macroeconomic conditions, and any negative developments—such as interest rate hikes or geopolitical tensions—could weigh on risk assets like Ethereum. Moreover, if the whale who accumulated $422 million in ETH decides to take profits at higher levels, it could trigger a sharp sell-off, undermining the current momentum.
For now, traders are closely watching key resistance levels around $3,000 and $3,200. A break above these levels could confirm a fresh rally, potentially targeting Ethereum’s previous highs near $4,000. On the other hand, a failure to sustain the current bounce could see ETH retest the $2,500 support, with a breakdown below this level opening the door to further declines.
________________________________________
Ethereum Developer Proposes 6-Second Block Times to Boost Speed, Slash Fees
Ethereum’s scalability and transaction costs have long been points of contention among users and developers. While the transition to Proof-of-Stake has improved energy efficiency, issues like high gas fees and network congestion persist, particularly during periods of high demand. In a bid to address these challenges, Ethereum developer Barnabé Monnot has proposed a radical change: reducing Ethereum’s slot times (the time between blocks) from 12 seconds to just 6 seconds. This proposal aims to make the network more responsive, improve efficiency for DeFi applications, and significantly lower transaction fees. But what are the implications of this change, and is it feasible?
Understanding Slot Times and Their Impact
In Ethereum’s current Proof-of-Stake consensus mechanism, validators propose and confirm blocks in slots that occur every 12 seconds. This slot time was chosen to balance network security, decentralization, and performance. A shorter slot time means blocks are produced more frequently, which could theoretically increase transaction throughput and reduce latency for users.
Barnabé Monnot’s proposal to halve slot times to 6 seconds is based on the idea that faster block production would make Ethereum more responsive, particularly for time-sensitive applications like decentralized exchanges (DEXs) and other DeFi protocols. Additionally, by processing transactions more quickly, the network could reduce congestion during peak periods, potentially leading to lower gas fees for users.
Potential Benefits of 6-Second Slot Times
If implemented successfully, Monnot’s proposal could have several positive impacts on Ethereum:
1. Improved User Experience: Faster block times would reduce the time users have to wait for transactions to be confirmed, making Ethereum more competitive with centralized payment systems and other blockchains like Solana, which boast sub-second transaction finality.
2. Enhanced DeFi Efficiency: DeFi protocols often rely on rapid transaction processing for arbitrage opportunities, liquidations, and other automated functions. A 6-second slot time could make these processes more efficient, potentially attracting more users and capital to Ethereum’s DeFi ecosystem.
3. Lower Gas Fees: By increasing the frequency of block production, the network could process more transactions per minute, reducing competition for block space during high-demand periods. This could lead to lower gas fees, addressing one of the most persistent criticisms of Ethereum.
4. Competitive Edge: Faster block times could help Ethereum maintain its dominance in the smart contract space, especially as rival blockchains continue to innovate with speed and cost efficiency.
Challenges and Risks
While the proposal sounds promising, it’s not without challenges. Reducing slot times could place additional strain on validators, particularly those with less powerful hardware. This could lead to missed slots or delays in block production, potentially undermining network stability. Additionally, shorter slot times could increase the risk of network forks or reorgs (reorganizations of the blockchain), where competing blocks are proposed simultaneously, creating temporary uncertainty about the canonical chain.
Another concern is the impact on decentralization. If faster block times disproportionately favor validators with high-performance hardware or low-latency connections, it could lead to greater centralization of the network, as smaller validators struggle to keep up. This would go against Ethereum’s core ethos of maintaining a decentralized and accessible infrastructure.
Finally, implementing such a change would require extensive testing and coordination among Ethereum’s developer community. Any misstep could result in bugs or vulnerabilities that compromise the network’s security.
Community Response and Next Steps
Monnot’s proposal has sparked lively debate within the Ethereum community. Some developers and users are enthusiastic about the potential for faster transactions and lower fees, while others caution against the risks of rushing such a significant change. Ethereum co-founder Vitalik Buterin has expressed cautious optimism, noting that shorter slot times could be a viable long-term goal but emphasizing the need for thorough research and simulation to understand the full implications.
For now, the proposal remains in the discussion phase, with no concrete timeline for implementation. If it gains traction, it could be tested on Ethereum testnets before being rolled out to the mainnet as part of a future upgrade. Regardless of the outcome, Monnot’s idea highlights Ethereum’s ongoing commitment to innovation and addressing user pain points.
________________________________________
Is Ethereum Staging a Repeat of 2021? Here’s Why a 200% Surge Could Follow
Ethereum’s price history is full of dramatic rallies and corrections, with 2021 standing out as a particularly bullish year. During that period, ETH surged from around $700 at the start of the year to an all-time high of nearly $4,900 in November—a gain of over 600%. As Ethereum shows signs of recovery in 2023, some analysts are drawing parallels to 2021, suggesting that a 200% surge could be on the horizon. But are these comparisons justified, and what factors could drive such a rally?
Parallels Between 2021 and 2023
Several factors from 2021 appear to be resurfacing in 2023, fueling speculation of a repeat performance:
1. Market Sentiment: In early 2021, the crypto market was riding a wave of optimism driven by institutional adoption, mainstream media coverage, and retail FOMO (fear of missing out). Today, while sentiment isn’t quite at 2021 levels, there are signs of growing interest, with major financial institutions exploring blockchain technology and retail investors returning to the market.
2. Network Upgrades: The lead-up to Ethereum’s London Hard Fork in 2021, which introduced the EIP-1559 fee-burning mechanism, was a major catalyst for price appreciation. In 2023, upcoming upgrades like Dencun and potential improvements to block times (as discussed earlier) could similarly boost confidence in Ethereum’s long-term value.
3. DeFi and NFT Growth: The explosive growth of DeFi and NFTs in 2021 drove massive demand for Ethereum, as most of these projects were built on its blockchain. While the hype around NFTs has cooled, DeFi continues to evolve, and new use cases like decentralized social media and gaming could reignite interest in Ethereum.
4. Macro Conditions: In 2021, loose monetary policies and stimulus packages created a favorable environment for risk assets like cryptocurrencies. While the macro environment in 2023 is more challenging, any shift toward accommodative policies—such as interest rate cuts—could provide a tailwind for Ethereum.
Why a 200% Surge Could Happen
If Ethereum is indeed staging a repeat of 2021, a 200% surge from current levels (around $2,800) would take ETH to approximately $8,400—a new all-time high. Several catalysts could make this possible:
• Institutional Adoption: Increased participation from institutional investors, as evidenced by whale accumulation like the $422 million ETH purchase, could drive sustained demand.
• Bitcoin Halving Effect: The upcoming Bitcoin halving in 2024 historically triggers bull runs across the crypto market, with Ethereum often outperforming BTC during these cycles.
• Technical Breakout: If Ethereum breaks above key resistance levels like $3,200 and $4,000, it could trigger a wave of buying momentum from technical traders and algorithms.
• Network Improvements: Successful implementation of upgrades like Dencun or shorter block times could enhance Ethereum’s utility, attracting more users and capital to the ecosystem.
Risks to the Bullish Thesis
Despite the optimism, there are significant risks that could derail a 200% surge. Regulatory uncertainty remains a major concern, with governments worldwide scrutinizing cryptocurrencies and DeFi. Additionally, competition from other Layer 1 blockchains like Solana, Avalanche, and Polkadot could divert developer and user attention away from Ethereum if it fails to address scalability and cost issues.
Moreover, the macro environment remains unpredictable. Persistent inflation, geopolitical tensions, or a prolonged recession could dampen risk appetite, weighing on Ethereum’s price regardless of its fundamentals.
Conclusion
Ethereum is at a fascinating crossroads. The massive $422 million accumulation by a whale signals strong confidence from big players, while the recent price bounce suggests that bullish momentum may be building. At the same time, innovative proposals like Barnabé Monnot’s 6-second block times highlight Ethereum’s commitment to addressing long-standing issues like fees and speed. Whether these factors coalesce into a 2021-style rally remains to be seen, but the potential for a 200% surge is not out of the question if key catalysts align. For now, investors and traders should remain vigilant, keeping an eye on technical levels, on-chain activity, and broader market trends to navigate the exciting but volatile world of Ethereum.

ETH-----Sell around 2525, target 2475 areaTechnical analysis of ETH contract on June 14:
Today, the large-cycle daily level closed with a small negative line yesterday, the K-line pattern continued to fall, the price was below the moving average, and the attached indicator was dead cross. The decline in the big trend is still very obvious, but we still have to pay attention to the stimulus brought by the news data. The low support is still around the 2300 area; the short-cycle hourly chart yesterday's European session rose and corrected the US session. The price began to retreat under pressure in the Asian morning today. The current K-line pattern is continuous and the price is below the moving average. The attached indicator is dead cross, so it is likely to continue to fluctuate downward during the day.
ETH short-term contract trading strategy:
The current price is 2525, directly short, stop loss in the 2565 area, and the target is the 2475 area;

#ETH/USDT#ETH
The price is moving within a descending channel on the 1-hour frame and is expected to break and continue upward.
We have a trend to stabilize above the 100 moving average once again.
We have a downtrend on the RSI indicator that supports the upward move with a breakout.
We have a support area at the lower limit of the channel at 2429, acting as strong support from which the price can rebound.
Entry price: 2535
First target: 2564
Second target: 2598
Third target: 2647

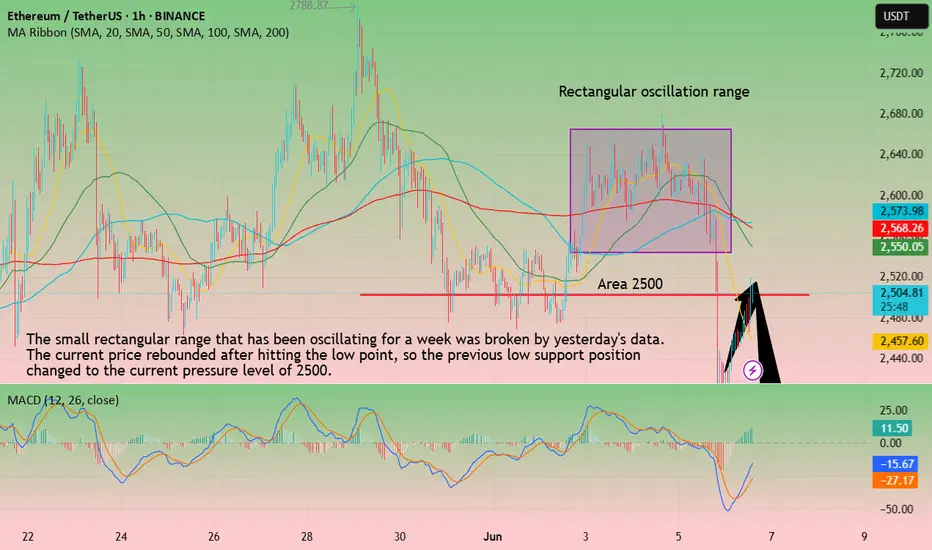
ETH-----Sell around 2500, target 2400 areaTechnical analysis of ETH contract on June 6:
Today, the large-cycle daily level closed with a large negative line yesterday, and the K-line pattern was still a single negative and single positive. The price was below the moving average. The attached indicator was dead cross. The bottom support position of the rectangle below was in the 2300 area. This is what we should focus on next week. Only when this position is broken, the overall downward trend will be formed and move downward; the short-cycle hourly chart maintained a range oscillation trend for a week. Under the stimulation of yesterday's data, it continued to break downward. It is necessary to pay attention to a top-bottom conversion pattern. The previous low support of 2500 has turned into the current pressure level.
ETH short-term contract trading strategy:
Short in the 2500 area, stop loss in the 2550 area, and the target is the 2400 area
ETH Price Action Explained – What the Charts Are Really Saying?🔍 Taking a look at Ethereum ETH right now across multiple timeframes…
On the lower timeframes ⏱️, we’re seeing a bullish break 💥 that might spark some enthusiasm 🚀, but when you zoom out and get that macro perspective 🌐, my outlook shifts from to one of caution ⚠️.
📊 ETH is currently trading into a key resistance level 🧱, and if we step back and view the bigger picture, we can clearly see that it’s been range-bound 🔁 for quite some time.
On the lower timeframes, there might be an opportunity to squeeze a bit out of the range 🎯 by trading between the highs and lows—but keep in mind, this approach is not for the feint hearted ⚡.
📹 This video is purely analysis 🧠, not a trade idea. I’m sharing my thoughts and market view 📈, and I hope you find it helpful and insightful 💡.
🚫 Not financial advice.

ETHEREUM AT A CRUCIAL INFLECTION POINT:CRYPTOCAP:ETH has been grinding just below a major resistance zone (~$2,850) after breaking out of a long-term descending channel.
This is the final barrier before a potential rally towards $4,000.
What to Watch:
Resistance: ~$2,850
Break above = momentum likely to accelerate
Rejection = possible pullback to retest breakout zone (~$2,400–$2,200)
Structure is strong, but confirmation is key. Bulls must clear this ceiling with volume.
Patience. React to a breakout or rejection — don’t front-run.

$ETHUSDT - Major Breakout Alert! CRYPTOCAP:ETH has officially broken out of a long-standing descending parallel channel on the daily chart — a key structural shift in market sentiment. This breakout is further supported by a successful close above the 50 EMA, which had acted as dynamic resistance throughout the downtrend.
Key Technical Developments:
- Broke out of a descending parallel channel
- Closed above 50 EMA for the first time in weeks
- Strong daily candle with 8% gain confirms momentum shift
Immediate Support: $1,790 (former resistance zone turned support)
Next Major Resistance: $2,393
This is the mid-zone before ETH challenges the broader supply area around $2,550–2,850.
This breakout mirrors Ethereum's typical behavior during previous cycle expansions — grinding accumulation followed by aggressive breakout moves. The confluence of the EMA breakout and channel structure suggests we could be looking at the beginning of a broader trend reversal.
Trading Plan:
Retests towards $1,850–$1,790 can offer high R:R entries.
Watch for continuation patterns or consolidation above $2,000 for the next push.
CRYPTOCAP:ETH is reclaiming momentum — if BTC remains stable, this move could expand quickly.
If you find this analysis helpful, please hit the like button to support my content! Share your thoughts in the comments, and feel free to request any specific chart analysis you’d like to see.

ETHEREUM push higher, previous push and FTX collapse connection
Anyone that knows me fully understands that I DISLIKE ETHEREUM A lot...Foe many reasons - So, please read this but understand, I am not going to paint many Rosey, Bright images about it....Mostly because there are NONE
For a start, the staking model giving Voting abilities DEPENDING ON HOW MUCH eth YOU HOLD..... is NOT decentralised Crypto
And the simple Fact that the American SEC refused to ever call ETHEREUM a Security while pointing its fingers at ALL others just leads me to feel that ETHEREUM is the Crypto of the American State...
Many think it was the 2nd Crypto to be released, the First ALT.
LITECOIN was the first..ETH arrived Late on the scene in 2013.
the ONLY thing that makes it 2nd is its Market Cap
SO, the Chart
The last Time ETH made a serious push was back in the middle of a BEAR market !
June 2022, while everything esle was dropping, dipping and crashing..... ETH made a push.
Suspicious from the start
With out to many details, FTX, another american Crypto "Baby" was likely responsible while manipulating the market as CZ from Binance stated at the time ( funny how the USA demanded he return and spend time in prison AT A LATER DATE huh )
Anyway, After this push, ETH Dipped sharply and recovered and then Ranged until the day that FTX collapsed.
And then look at what happened.
DROPPED while Every other Crypto in the world recovered some.
JAN 2023 - the beginning of the Recovery from a deep bear for crpyto.....
Except ETHEREUM - iT DROPPED AS MOST PEOPLE IN THE KNOW UNDERSTOOD JUST WHAT eth IS.
And now, With the President Trump Crypto loving American Dream coming alive, ETH decides to wake up after a Long Sleep....Why now ? Why not earlier ????
AND I STILL DO NOT TRUST IT
You can buy it, trade it, Just do not hold it is my opinion.
And it is at 54% right now...
Can it go higher ?
All depends on what the next phase of the USA CRYPTO DREAM has in store.
ETH last push in 2022 was 64% then ranged while being manipulated.....
Smells the same to me
BUY BITCOIN - HOLD BITCOIN
TRULY DECENTRALISED

ETH Overextended: Eyeing a Retracement from Key Liquidity ZoneTechnical Analysis: ETH/USDT Daily/4H and 30m Chart 🚨
Ethereum (ETH) has experienced a powerful rally, surging from the $1,900 region to above $2,500 in just a few sessions. This explosive move has pushed price into a previous area of significant resistance, where a large liquidity pool is likely sitting. The current daily candle structure shows signs of hesitation, with smaller bodies and wicks indicating potential exhaustion at these highs.
Given the overextended nature of this move 📈 and the fact that ETH is now trading at a premium relative to its recent range, a retracement back toward equilibrium is probable. If price action breaks below the current range low (the most recent swing low on the daily), this could confirm a distribution phase 🏦 and open up a short opportunity.
I'm watching for a clear break and close below the range low to trigger a potential short setup. My expectation is for price to revisit the mid-range or even the origin of the recent rally, where demand may step in again. Until then, patience is key—let the market show its hand before entering.
Key Points:
ETH is overextended and trading into previous highs with heavy liquidity 💧
Signs of exhaustion are emerging at the top of the move
A break below the current range low could confirm distribution and offer a short setup 🔻
Targeting a retracement toward equilibrium, possibly the $2,000–$2,200 zone 🚨

ETH Surges 20% Post-Pectra: Crypto's Ultimate Comeback?Ether Clocks 'Insane' 20% Candle Post-Pectra — A Turning Point?
The cryptocurrency market witnessed a remarkable event as Ethereum (ETH) surged by an impressive 20% following the successful implementation of the Pectra hard fork. This dramatic price movement has caught the attention of traders, investors, and analysts alike, sparking intense debate about whether this represents a genuine turning point for the second-largest cryptocurrency by market capitalization or merely a temporary respite in a challenging market environment.
The Pectra Catalyst
The Pectra hard fork, representing one of Ethereum's most significant technical upgrades since its transition to proof-of-stake, was successfully implemented in early 2025. This upgrade introduced crucial improvements to the Ethereum network, including enhanced transaction processing efficiency, reduced gas fees, and expanded smart contract functionality.
Unlike previous upgrades that sometimes resulted in "buy the rumor, sell the news" reactions, Pectra's implementation appears to have triggered substantial positive price action. The 20% candle marked Ethereum's largest single-day gain in over 18 months, propelling ETH past the crucial $1,900 resistance level that had previously acted as a ceiling for price movements.
The timing of the upgrade coincided with increasing institutional interest in Ethereum, creating perfect conditions for a significant price movement. Data from on-chain analytics platforms indicates that large wallet addresses began accumulating ETH in the weeks leading up to Pectra, suggesting informed capital was positioning ahead of the technical catalyst.
Institutional Buying Signals
On-chain metrics reveal compelling evidence of institutional participation in Ethereum's recent surge. Blockchain analytics firm Glassnode reported a substantial increase in large-value transactions exceeding $1 million in the 72 hours surrounding the Pectra implementation, with transaction volume reaching levels not seen since late 2023.
Several key metrics support this institutional narrative:
1. Exchange outflows have accelerated, with over 200,000 ETH leaving centralized exchanges in a single 48-hour period post-Pectra, indicating buyers intend to hold rather than trade.
2. The number of addresses holding more than 1,000 ETH increased by 2.8% in just one week, representing substantial accumulation by wealthy entities.
3. Futures open interest has expanded by over $2 billion since the Pectra announcement, demonstrating increased leveraged positioning.
4. Options markets show a significant skew toward calls, with the put/call ratio reaching its lowest level in 14 months.
These metrics collectively suggest that smart money sees the Pectra upgrade as a legitimate inflection point for Ethereum rather than a temporary technical bounce.
The Long Position Explosion
Perhaps most intriguing is the dramatic increase in long positions across various trading platforms. Data from cryptocurrency derivatives exchanges shows that long-to-short ratios have reached levels not seen since Ethereum's previous major bull run in 2021.
This positioning dynamic creates an interesting technical setup where further price increases could trigger a positive feedback loop as short sellers are forced to cover their positions, potentially accelerating ETH's upward movement.
Retail Sell-Off vs. Whale Accumulation
A fascinating dynamic has emerged in Ethereum's market structure: while retail investors appear to be reducing exposure, larger entities ("whales") are aggressively accumulating. This divergence in behavior between market participants has created an unusual tension in ETH's price action.
Blockchain analytics firm Santiment reported that addresses holding between 0.1 and 10 ETH have decreased their collective holdings by approximately 3% over the past month, indicating retail profit-taking or repositioning. Simultaneously, addresses holding over 1,000 ETH have increased their positions by nearly 7%.
This pattern often emerges during major market transitions, where retail participants, scarred by previous drawdowns, remain skeptical of recovery signals while institutional investors position for longer-term trends based on fundamental catalysts.
This dynamic creates an interesting market structure where future price movements may depend on which cohort ultimately proves correct in their assessment of Ethereum's prospects.
Technical Breakout Analysis
From a technical analysis perspective, Ethereum's 20% surge represents a significant breakout from multiple resistance levels that had contained price action for months. The move pushed ETH decisively above its 200-day moving average, a key indicator watched by trend-following traders.
The volume profile accompanying the move also supports the legitimacy of the breakout, with transaction volume reaching its highest level in nine months. This high-volume breakout typically indicates strong conviction behind the price movement rather than a technical fake-out.
Additionally, the Relative Strength Index (RSI), while showing overbought conditions in the short term, has broken out of a long-term downtrend on higher timeframes, suggesting potential for sustained momentum despite possible near-term consolidation.
Macro Context and Ethereum's Narrative Shift
Ethereum's dramatic move occurs against a complex macroeconomic backdrop that had previously contributed to crypto market weakness. Recent signals of potential monetary policy shifts, including discussions of rate cuts by central banks, have created a more favorable environment for risk assets broadly.
Beyond pure price action, Ethereum's narrative has evolved considerably in recent months. After facing criticism regarding high transaction fees and scaling limitations, the successful implementation of Pectra addresses several key concerns that had dampened enthusiasm for the network.
The upgrade's focus on reducing gas fees and improving transaction throughput directly counters the competitive threats from alternative Layer 1 and Layer 2 solutions that had been gaining traction by positioning themselves as more efficient alternatives to Ethereum.
This narrative rehabilitation, combined with Ethereum's established network effects and developer ecosystem, creates compelling fundamental support for the recent price action.
Sustainability Questions and Potential Challenges
While enthusiasm surrounding Ethereum's post-Pectra surge runs high, significant questions remain regarding the sustainability of this momentum. Several potential challenges could impact ETH's trajectory in the coming months:
1. Technical Overextension: The speed and magnitude of the 20% move have pushed short-term technical indicators into overbought territory, potentially setting up conditions for a correctional pullback.
2. Regulatory Uncertainty: The evolving regulatory landscape for cryptocurrencies, particularly regarding potential security classifications and staking activities, continues to create background uncertainty for Ethereum.
3. Competitive Pressures: Despite Pectra's improvements, alternative blockchains continue to innovate rapidly, potentially challenging Ethereum's dominance in specific use cases.
4. Macro Reversal Risk: Any shift back toward hawkish monetary policy could negatively impact risk assets broadly, potentially including Ethereum despite its technological progress.
5. Execution Risk: While Pectra's implementation was successful, future technical upgrades still carry execution risk that could impact market confidence.
Conclusion: A Genuine Turning Point?
As market participants attempt to determine whether Ethereum's "insane" 20% candle represents a genuine turning point or a temporary deviation, the weight of evidence increasingly suggests this could indeed mark a significant inflection point in ETH's market cycle.
The confluence of technical breakouts, on-chain accumulation signals, derivative positioning, and fundamental improvements through the Pectra upgrade creates a compelling case for sustained momentum. The divergence between retail selling and institutional accumulation further supports the notion that a meaningful market transition may be underway.
However, sustainable price appreciation will likely require continued technical execution, expanding adoption metrics, and at minimum, a neutral macro environment that doesn't actively handicap risk assets.
For investors and traders, the coming weeks will be crucial in determining whether Ethereum can build upon this momentum or if the surge represents another false dawn in a challenging market. But regardless of short-term price action, the successful implementation of Pectra unquestionably strengthens Ethereum's long-term value proposition as a leading blockchain infrastructure platform.

ETH-----Sell around 1800, target 1730 areaTechnical analysis of ETH contract on April 30:
Today, the large-cycle daily level closed with a small negative line yesterday. The K-line pattern was a continuous positive single negative, the price was above the moving average, and the attached indicator was a golden cross with a shrinking volume. However, at present, the rise did not break the high and did not continue. The decline also did not see the strength and continuation. It is likely to be a fluctuating trend. Therefore, we should not think too much about trading, just keep short-term; the short-cycle hourly chart was under pressure and retreated in the morning. Yesterday's high point was in the 1842 area, and the previous low point supported the 1722 area; this is the current range of range fluctuations. The current K-line pattern is a continuous negative, and the attached indicator is dead cross running, so there is still a high probability of a downward trend during the day.
Therefore, today's ETH short-term contract trading strategy; sell at the 1800 area, stop loss at the 1830 area, and target the 1730 area;

Risky Scalp Short | $ETH @ CMP 1778 | 5x–7x LeverageHigh-risk scalp short on ETH based on intraday price action and overextension signs.
Trade Plan:
Entry 1: CMP ~1778
Entry 2: 1812
Leverage: 5x to 7x
SL: To be updated (Max 3% risk)
Quick scalp — watch closely for volatility & potential fakeouts.
⚠️ High-risk trade. Not financial advice. For educational purposes only. Use proper risk management.

ETH-----Sell around 1610, target 1550 areaTechnical analysis of ETH contract on April 16:
Today, the large-cycle daily level closed with a small negative line yesterday, and the K-line pattern was a single negative and a single positive, but the price was still below the moving average. The attached indicator dead crosses and the fast and slow lines are golden crosses, but the pressure is below the zero axis. In this way, the current pullback trend can only be regarded as a correction, because the price has not stood on the moving average and has not broken the previous high. It is easy to fall under pressure for the second time when the indicators are not unified; the current K-line pattern of the four-hour chart has fallen continuously, and the attached indicator dead crosses. The price is below the moving average, and the pressure position of the pullback moving average is near the 1610 area. The short-cycle hourly chart was under pressure in the US market yesterday and was corrected in the Asian time today. The trend pattern is still the same, and the correction pullback cannot be large.
Therefore, today's ETH short-term contract trading strategy: sell at the pullback 1610 area, stop loss at the 1640 area, and target the 1550 area;

Warning: Low Ethereum Target LoomsThe Unthinkable Target: Is $1,000 ETH Really in Play?
Suggesting Ethereum could fall back to $1,000 might seem hyperbolic to those who remember its peak near $5,000. However, the crypto market is notorious for its brutal volatility and deep drawdowns. Bitcoin itself has experienced multiple corrections exceeding 80% from its all-time highs throughout its history. While Ethereum has matured significantly, it's not immune to severe market downturns or shifts in narrative dominance.
A $1,000 price target represents a roughly 65-70% decline from prices seen in early-to-mid 2024 (assuming a starting point around $3,000-$3,500) and an approximate 80% drop from its all-time high. While drastic, such a move could become plausible under a confluence of negative circumstances:
1. Severe Macroeconomic Downturn: A deep global recession, coupled with sustained high interest rates or a major credit event, could trigger a massive risk-off wave across all assets, hitting speculative investments like crypto particularly hard.
2. Regulatory Crackdown: Punitive regulations targeting DeFi, staking, or specific aspects of Ethereum's ecosystem could severely damage sentiment and utility.
3. Technological Stagnation or Failure: Major setbacks in Ethereum's scaling roadmap or the discovery of a critical vulnerability could erode confidence.
4. Sustained Loss of Narrative: If competing blockchains definitively capture the dominant narrative for innovation, speed, and cost-effectiveness, ETH could lose its premium valuation.
5. Technical Breakdown: A decisive break below key long-term support levels (like the previous cycle highs around $1,400 or psychological levels like $2,000) could trigger cascading liquidations and stop-loss orders, accelerating the decline towards lower supports, including the $1,000 vicinity which acted as significant resistance/support in previous cycles.
While not a base-case prediction for many, the $1,000 target serves as a stark reminder of the potential downside if the current negative pressures persist and intensify, particularly within a broader bear market context. The factors currently driving ETH's weakness provide fuel for this bearish contemplation.
Reason 1: The Underwhelming Arrival of Spot Ethereum ETFs
Following the monumental success of Spot Bitcoin ETFs in the US, which attracted tens of billions in net inflows within months of launch, expectations were sky-high for their Ethereum counterparts. The narrative was compelling: regulated, accessible vehicles would unlock a floodgate of institutional capital, mirroring Bitcoin's ETF-driven price surge.
However, the reality has been starkly different and deeply disappointing for ETH bulls. Since their launch, Spot Ethereum ETFs have witnessed tepid demand, characterized by weak inflows and, at times, even net outflows. The initial excitement quickly fizzled out, failing to provide the anticipated buying pressure.
Several factors contribute to this underwhelming debut:
• Pre-Launch Regulatory Uncertainty: The SEC's approval process for ETH ETFs was far less certain and more contentious than for Bitcoin. This lingering ambiguity, particularly around Ethereum's classification (commodity vs. security) and the handling of staking, may have made some large institutions cautious.
• Lack of Staking Yield: Unlike holding ETH directly or through certain other investment products, the approved US Spot ETH ETFs do not currently offer holders exposure to staking yields – a core component of Ethereum's tokenomics and a significant draw for long-term investors. This makes the ETF product inherently less attractive compared to direct ownership for yield-seeking capital.
• Existing Exposure Channels: Institutional players interested in Ethereum already had established avenues for gaining exposure, including futures markets (CME ETH futures), Grayscale's Ethereum Trust (ETHE, although less efficient pre-conversion), and direct custody solutions. The incremental demand unlocked by the spot ETFs may have been smaller than anticipated.
• Market Timing and Sentiment: The ETH ETFs launched into a more challenging macroeconomic environment and a period of cooling sentiment in the broader crypto market compared to the Bitcoin ETF launch window. The initial risk-on euphoria had faded, replaced by concerns about inflation, interest rates, and geopolitical tensions.
• "Sell the News" Event: As often happens in markets, the period leading up to the ETF approval saw significant price appreciation. The actual launch may have triggered profit-taking by traders who had bought in anticipation of the event.
The impact of these weak ETF flows is significant. It signals a lack of immediate, large-scale institutional appetite for ETH through this specific channel, removing a key bullish catalyst that many had banked on. It also contributes to negative market sentiment, reinforcing the narrative that Ethereum is currently out of favor compared to Bitcoin or other trending assets. Without this expected wave of ETF-driven buying, the price is more susceptible to selling pressure from other sources.
Reason 2: Derivatives Market Flashing Red - Low Interest, Negative Funding
The derivatives market, particularly perpetual futures, provides crucial insights into trader sentiment and positioning. Two key metrics are currently painting a bearish picture for Ethereum: Open Interest (OI) and Funding Rates.
• Low Open Interest (OI): Open Interest represents the total number of outstanding derivative contracts (longs and shorts) that have not been settled. While OI naturally fluctuates, consistently low OI relative to historical peaks or compared to Bitcoin's OI suggests a lack of strong conviction and reduced speculative interest in Ethereum. When traders are uncertain or bearish, they are less likely to open large, leveraged positions, leading to subdued OI. This indicates that fewer market participants are willing to bet aggressively on ETH's future price direction, especially on the long side.
• Negative Funding Rates: Funding rates are periodic payments exchanged between long and short position holders in perpetual futures contracts. They are designed to keep the futures price tethered to the underlying spot price.
o Positive Funding: When the futures price trades at a premium to spot (contango) and bullish sentiment dominates, longs typically pay shorts. This incentivizes shorting and disincentivizes longing, helping to pull the prices back together.
o Negative Funding: When the futures price trades at a discount to spot (backwardation) and bearish sentiment prevails, shorts pay longs. This indicates a higher demand for short positions (either speculative shorting or hedging long spot holdings). Consistently negative funding rates, as observed for ETH during periods of weakness, are a strong bearish signal. It means traders are actively paying a premium to maintain short exposure, reflecting widespread pessimism about the price outlook.
•
The combination of low Open Interest and negative Funding Rates creates a negative feedback loop. It shows reduced speculative appetite, a dominance of short positioning, and a lack of leveraged longs willing to drive the price higher. While extremely negative funding can sometimes precede a "short squeeze" (where rising prices force shorts to cover, accelerating the rally), the persistent nature of these conditions recently suggests underlying weakness rather than an imminent explosive reversal. This bearish derivatives landscape acts as a significant headwind, absorbing buying pressure and making sustained rallies difficult.
Reason 3: The Relentless Rise of Competing Layer-1s
Ethereum's primary value proposition has long been its status as the dominant, most secure, and most decentralized platform for smart contracts and decentralized applications (DApps). However, its reign is facing its most significant challenge yet from a growing cohort of alternative Layer-1 (L1) blockchains, often dubbed "ETH Killers."
While Ethereum still dominates in terms of Total Value Locked (TVL) in DeFi and overall network value, competing L1s like Solana, Avalanche, Cardano, and newer entrants are rapidly gaining ground in crucial areas of network activity:
• Transaction Throughput and Fees: Many competitors offer significantly higher transaction speeds (transactions per second) and dramatically lower fees compared to Ethereum's mainnet. While Ethereum's Layer-2 scaling solutions aim to address this, the user experience on some alternative L1s can feel faster and cheaper for certain applications, attracting users and developers.
• Active Users and Daily Transactions: Chains like Solana have, at times, surpassed Ethereum in metrics like daily active addresses and transaction counts, particularly fueled by specific niches like meme coins, high-frequency DeFi, or certain NFT projects. This indicates a migration of user activity seeking lower costs or specific functionalities.
• Developer Activity and Ecosystem Growth: While Ethereum retains a vast developer community, alternative L1s are aggressively courting developers with grants, simpler tooling (in some cases), and the allure of building on the "next big thing." This leads to vibrant DApp ecosystems growing outside of Ethereum.
• Technological Differentiation: Competitors often employ different consensus mechanisms (e.g., Proof-of-History, Avalanche Consensus) or architectural designs that offer trade-offs favoring speed or specific use cases over Ethereum's current approach (though Ethereum's roadmap aims to incorporate many advancements).
The impact of this intensifying competition is multifaceted. It fragments liquidity and user attention across multiple platforms. It challenges the narrative of Ethereum's unassailable network effect. Crucially, it reduces the relative demand for ETH itself, which is needed for gas fees and staking on the Ethereum network. If users and developers increasingly opt for alternative platforms, the fundamental demand drivers for ETH weaken, putting downward pressure on its price relative to these competitors and the market overall. Ethereum is no longer the only viable option for building or using decentralized applications, and this increased competition is clearly impacting its market position and price performance.
The Path to Reversal: What Needs to Change for Ethereum?
Despite the current headwinds and the looming shadow of lower price targets, Ethereum is far from dead. It possesses a resilient community, the largest developer base, significant first-mover advantages, and a comprehensive roadmap for future upgrades. However, a sustainable trend reversal requires tangible progress and shifts across several fronts:
1. ETF Flows Must Materialize: The narrative needs to shift from disappointment to tangible success. This requires sustained, significant net inflows into the Spot ETH ETFs, potentially driven by broader institutional adoption, clearer regulatory frameworks globally, or perhaps future ETF iterations that incorporate staking yields (though regulatory hurdles for this are high).
2. Derivatives Sentiment Needs to Flip: Open Interest needs to build substantially, indicating renewed speculative conviction. More importantly, funding rates need to turn consistently positive, signaling a shift towards bullish positioning and leveraged longs re-entering the market.
3. Successful Execution of Ethereum's Roadmap: Continued progress and successful implementation of Ethereum's scaling solutions are paramount. Wider adoption and tangible impact from upgrades like Proto-Danksharding (EIP-4844) reducing Layer-2 fees, and clear progress towards future milestones like Verkle Trees and Statelessness, are needed to demonstrate Ethereum can overcome its scalability challenges and maintain its technological edge.
4. Reigniting Network Activity and Demand: Ethereum needs compelling new applications or upgrades to existing protocols that drive genuine user demand and increase the consumption of ETH for gas. This could come from innovations in DeFi, NFTs, GameFi, decentralized identity, or other unforeseen areas. The narrative needs to shift back towards Ethereum as the primary hub of valuable on-chain activity.
5. Favorable Macroeconomic Conditions: Like all risk assets, Ethereum would benefit significantly from a broader shift towards risk-on sentiment, potentially fueled by central bank easing (lower interest rates), controlled inflation, and stable global growth.
6. A Renewed, Compelling Narrative: Ethereum needs a clear and powerful story that resonates beyond its existing user base. Whether it's focusing on its superior security and decentralization, its role as the foundational "settlement layer" for the digital economy, or a new killer application, a refreshed narrative is needed to recapture investor imagination and justify a premium valuation.
Conclusion: Ethereum at a Critical Juncture
Ethereum's recent price struggles are not arbitrary; they are rooted in tangible factors: the lackluster performance of its spot ETFs, bearish signals from the derivatives market, and the undeniable pressure from faster, cheaper Layer-1 competitors. These elements combine to create an environment where contemplating a fall towards $1,000, while bearish, is a reflection of the significant challenges the network faces.
However, Ethereum's history is one of resilience and adaptation. It has weathered bear markets, technical hurdles, and competitive threats before. The path back to sustained growth and potentially new all-time highs is challenging but not impossible. It hinges on reigniting institutional interest via ETFs, flipping derivatives sentiment, successfully executing its ambitious technological roadmap to counter competitors, and benefiting from a supportive macro environment. Until these positive catalysts materialize convincingly, Ethereum may continue to lag, and the possibility of further downside, even towards the $1,000 mark in a severe downturn, will remain a topic of discussion among market participants navigating the crypto giant's uncertain future.

ETH-----Sell around 1900, target 1530 areaTechnical analysis of ETH contract on April 10: Today, the large-cycle daily level closed with a large positive line yesterday, and the K-line pattern was a single positive line with continuous negative lines. The price was still at a low level, and the attached indicator was dead cross. Although the current rebound trend is relatively strong, it is a correction in terms of both the trend pattern and the basic technical indicators. The large-cycle price is suppressed, and it is difficult to continue and form a trend. This is inevitable; the current K-line pattern of the four-hour chart is continuous negative, and the price has also reached the pressure position of the moving average. From the perspective of the pattern, it is very likely to go in the shape of a head and shoulders top. The high point of yesterday's rebound is the top. The short-cycle hourly chart was under pressure and retreated in the morning. The current continuous negative decline, the attached indicator is dead cross running.
Today's ETH short-term contract trading strategy: Sell directly in the current price area of 1600, stop loss in the 1630 area, and target the 1530 area;

ETH-----Sell around 1840, target 1770-1750 areaTechnical analysis of ETH contract on April 3: Today, the large-cycle daily line level closed with a medium-yin line yesterday, the K-line pattern was a continuous Yin and a single Yang, the price was below the moving average, and the attached indicator was dead cross, so there was no problem with the trend and it was still falling significantly, but the trend this week was more volatile, and it was greatly stimulated by the news and data. The rhythm of trading is very important; the four-hour chart is the focus, the current K-line pattern is a continuous Yin, the attached indicator is dead cross, the morning fell, and the correction was made during the day. It was just corrected to the 1845 area near the moving average pressure position, so we still have to focus on the price continuing to break in the European session. In addition, the same anti-pull strength cannot be large, otherwise it will still fluctuate.
Therefore, today's ETH short-term contract trading strategy: sell directly at the current price of 1840, stop loss in the 1870 area, and target the 1770-1750 area

ETH/USDT BUYHello friends
Given the price support, we can buy at two levels that we have specified for you.
The price targets have also been specified...
Please observe capital management.
*Trade safely with us*

ETH----Buy around 1960, target 2060 areaMarch 20 ETH technical analysis: Today, the large-cycle daily level closed with a medium-sized positive line yesterday, and the K-line pattern continued to rise. The price was above the moving average but at a low level. The fast and slow lines of the attached gold cross indicator were below the zero axis. The suppression at the weekly level was still relatively obvious. So we still have to continue to pay attention to the current rebound trend. The decline in the big trend remains unchanged, and there is a need for a rebound in a short time. This is the current trend situation; the short-cycle hourly chart price retreated under pressure this morning, but the overall retreat was not strong and did not continue. The current K-line pattern continued to fall, and the attached indicator was dead cross running. So we have to wait for the retracement support before entering the European session. The moving average resistance position is near the 1960 area.
Therefore, today's ETH short-term contract trading strategy: buy in the 1960 area when retreating, stop loss in the 1930 area, and target the 2060 area;

Ethereum at Critical Levels – Breakout or Breakdown for ETH?Ethereum (ETH) is looking heavily overextended right now 📊, with price action pressing into key support zones on the daily and weekly charts ⏳. The market is at a critical juncture, and a sharp pullback 📉 could be on the cards.
This could present a short-term counter-trend buying opportunity on the lower timeframes 💰, but if ETH pushes higher, it may offer a prime short setup 🎯.
⚠️ Not financial advice – trade smart and manage risk accordingly! 🚀

Ethereum at Key Support Zone: Is a Counter-Trend Setting Up?Ethereum (ETH) is currently in a strong bearish trend 📉, but it has traded into a key support zone 🛑 and seems overextended, in my opinion. Looking at the price action and market structure on the daily and four-hour timeframes, we’re now seeing Ethereum form higher highs and higher lows on the four-hour chart 📊. While it’s still early, if we see a break above the current range high on the four-hour timeframe, there could be an opportunity for a counter-trend trade 🔄, targeting equilibrium ⚖️ and a previous imbalance highlighted in the video. As always, this is for educational purposes only and should not be taken as financial advice 💡.

Ethereum Market OverviewThis analysis builds upon the previous technical outlook, identifying three key patterns on Ethereum’s daily timeframe:
1. Ascending Channel
Ethereum has been trading within a well-established ascending channel since 2018. Each time a new all-time high (ATH) is reached, price consistently tests the channel’s resistance, while the major support level was formed on March 23, 2020, creating a strong demand zone that remains intact.
Currently, ETH has reached the lower boundary of this channel at $2,128, a key support level. If a bullish reversal occurs, the next upside target aligns with the ascending channel resistance at $8,463.
2. Symmetrical Triangle
A symmetrical triangle pattern has been forming since March 23, 2020, with its support level coinciding with the lower boundary of the ascending channel. A confirmed breakout above $3,600 would validate this pattern, triggering a bullish AB=CD extension, with a price projection towards $8,463.
3. Fibonacci Retracement
Currently, ETH is testing the 0.618 Fibonacci retracement level, a critical zone for potential trend reversals. If this level holds against bearish pressure, the next bullish projection aligns with the 1.618 Fibonacci extension at $5,319.
Breakdown Risk & Buyback Strategy
If the current support level fails, ETH could see a maximum downside correction of -26%, targeting $1,600. This level presents a high-probability buyback opportunity, offering a potential +437% upside, should Ethereum rally towards its extended price projection at $8,463.
This analysis underscores the importance of risk management and technical confirmation signals before executing any trades.
