ETHUSD HEADS TOWARDS WEEKLY RESISTANCEETHUSD HEADS TOWARDS WEEKLY RESISTANCE
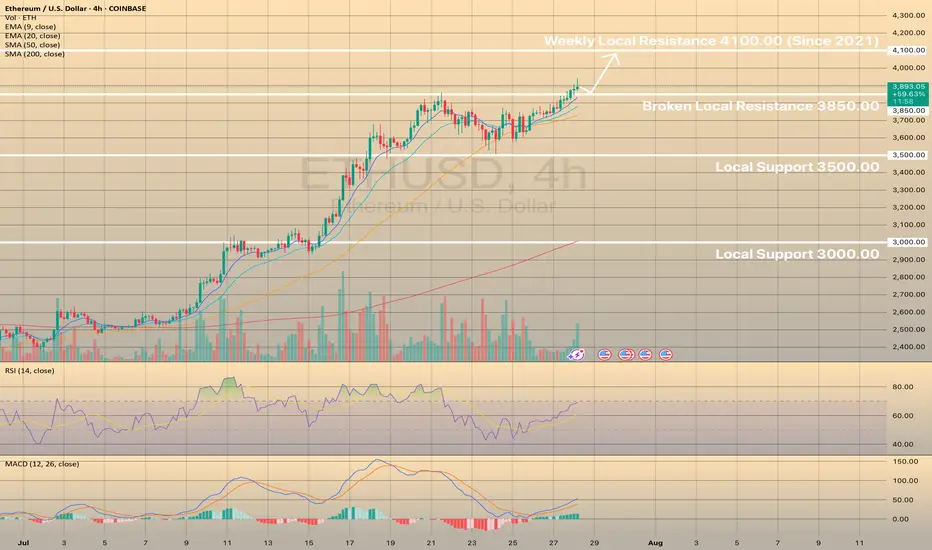
ETHUSD has broken local resistance of 3,850.00 and is currently heading towards weekly resistance of 4,100.00, the level, established in 2021. Last time the asset came close to this level at the end of last year and reversed from it afterwards. Same situation is expected here.
Price may retest the level of 3,850.00 and then head towards 4,100.00 level. No reversal signs on RSI or MACD. Vice a versa, RSI shows local strength of the asset, MACD is in the green zone. Buying volume highlights current bullish impulse.
Ethusdanalysis
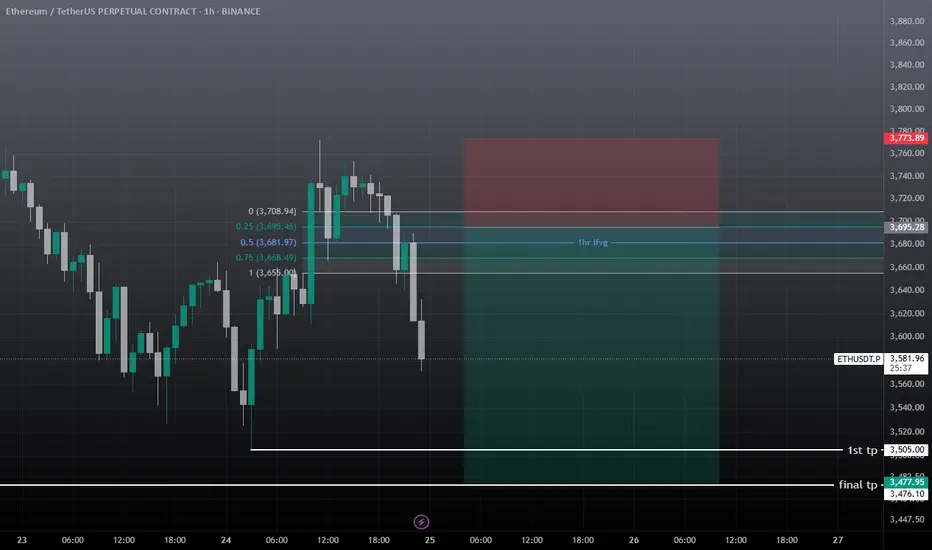
eth usdt short setupEth showing some correction towards 3.4-3.2k , I'm not bearish but alts needs some correction before another mini leg-up, must use sl, take some entry at 3681 and other on 3695. If tp hits first then ignore it.
ETHUSD, XRPUSD - BEARISH DIVERGENCE SUCCESSFULLY WORKED OUT
ETHUSD, XRPUSD - BEARISH DIVERGENCE SUCCESSFULLY WORKED OUT
On these 2 graphs you may observe ethereum and ripple declining after strong bearish divergence showed up on both of these instruments. Here, the bearish divergence proved to be a success. In both cases the price has almost reached first targets: 3,500.00 for ETHUSD and 3.00000 for XRPUSD.
What will be next?
It looks like downwards correction still persists and we may observe some deeper than now decline with possible targets of 3,000.00 for the ETHUSD and 2.60000 for the XRPUSD.
ETHUSD FORMED A BEARISH WEDGE. READY TO REVERSE?ETHUSD FORMED A BEARISH WEDGE. READY TO REVERSE?📉
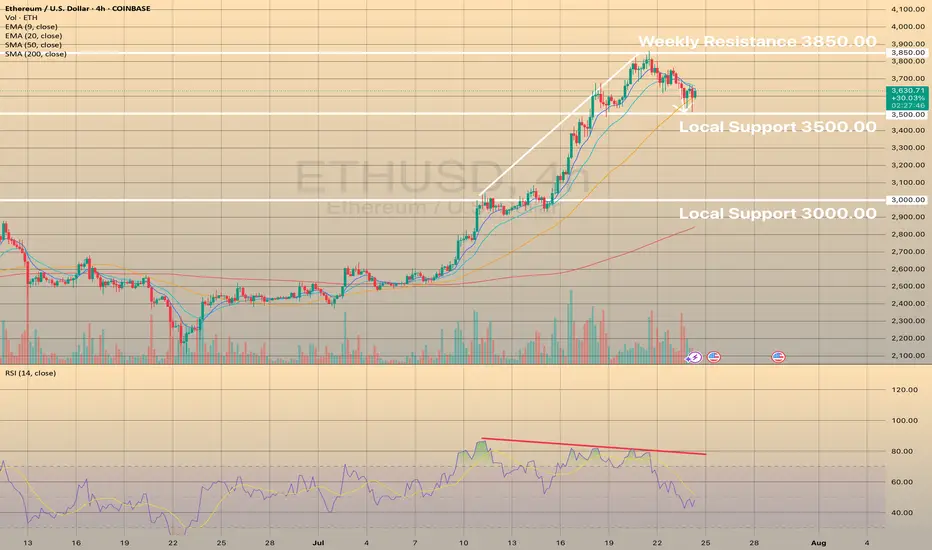
ETHUSD has been moving bullish since July 9, forming the bearish wedge, supported by the bearish divergence. Today the price started to breakdown this pattern.
A bearish wedge is a bearish reversal pattern in an uptrend, where the price forms higher highs and higher lows within converging upward trendlines, signaling weakening bullish momentum and a potential downward reversal. To trade, identify the wedge with declining volume and confirm with RSI or divergence. Sell or short on a breakdown below the lower trendline with a volume spike. Set a stop-loss above the recent high or upper trendline. Target the wedge’s height projected downward from the breakdown or the next support level with a 1:2 risk-reward ratio.
The decline towards local support of 3,500.00 is highly expected. If the bearish impulse gets strong enough, we may see the decline towards 3,000.00 support level.

DeGRAM | ETHUSD retest of the support level📊 Technical Analysis
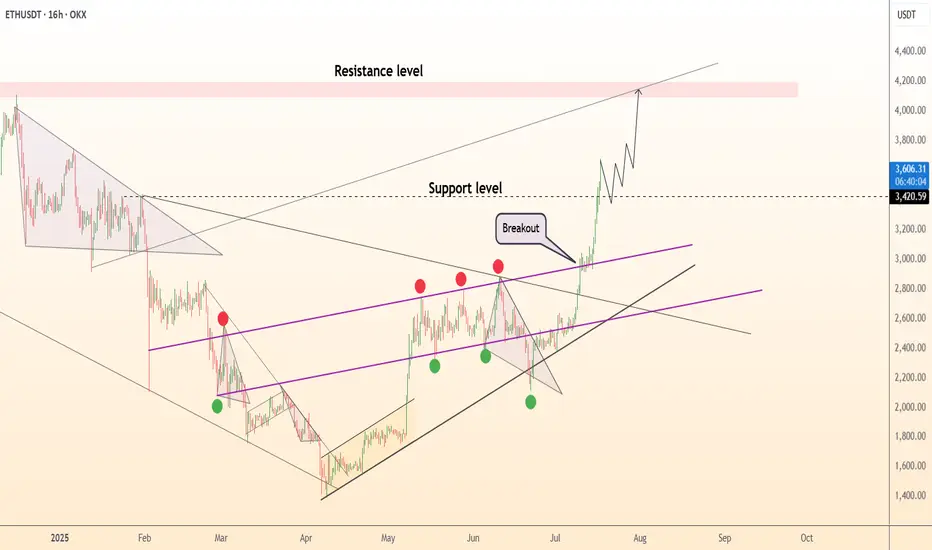
● ETH exploded out of the purple median channel, invalidating March-July lower-highs; retest of 3 210 held as a fresh higher-low, confirming trend acceleration.
● Price is now travelling the channel’s outer parallel; flag pole projected from the 2 430→3 210 thrust aligns with the 4 150-4 250 supply zone shown in pink.
💡 Fundamental Analysis
● CME ether futures OI hit a 14-month high on 17 Jul while exchange balances dropped to a five-year low, signalling strong institutional demand and tight float ahead of expected spot-ETF approvals.
✨ Summary
Long 3 210-3 300; hold above 3 210 targets 3 600 → 4 200. Bull view void on a 16 h close below 3 020.
-------------------
Share your opinion in the comments and support the idea with like. Thanks for your support!
DeGRAM | ETHUSD above the resistance area📊 Technical Analysis
● Price burst through the 12-week compression roof, converting the 2 990 supply into support and printing the strongest close since March.
● The pull-back just retested both the purple trend-fan and the 2 960 flip zone; the active rising channel and flag depth map the next magnet at 3 410.
💡 Fundamental Analysis
● SEC’s 12 Jul request for updated spot-ETH ETF S-1s hints at imminent approval, fuelling fresh inflows.
● Glassnode reports the largest daily net-staking deposit since April, reducing exchange float and adding bid pressure.
✨ Summary
Long 2 960-3 000; holding above 2 990 targets 3 110 → 3 410. Bias void on an H4 close below 2 860.
-------------------
Share your opinion in the comments and support the idea with like. Thanks for your support!

ETHUSDT BUY / Long SetupThis 4hrs candle closes above the mentioned level, then took long from 50% fib level of the fvg, and put sl below the recent swing low, I will update the trade whether it's active or not? tp towards 3.3-3.4k , while btc.d getting recked so becareful shorting any altcoin.

ETH/USD Setup | Thief Trading Blueprint for Profit.🔥🚨THE ETHEREUM HEIST PLAN: Thief-Style Trading Blueprint for Maximum Gains🚨🔥
💰Thief Mode: Activated | Time to Rob the Bulls 💰
📢🌍 Hello Money Makers, Crypto Crooks & Chart-Breaking Bandits! 🐱👤🤑💸
Welcome to the “Thief Trading Style” breakdown — a high-stakes, high-reward crypto market blueprint built on deep technical & fundamental intel. This isn’t your average strategy… it’s a full-blown heist on the ETH/USD market!
🧠 THE MASTER PLAN (ETH/USD – Day & Swing Trade)
🔎 Based on our Thief Mode analysis — blending market sentiment, trend psychology, and price action — Ethereum is ripe for a bullish robbery. We’re setting up shop at high-risk liquidity traps and targeting bearish overconfidence.
💥ENTRY STRATEGY – "The Vault Is Open, Time to Strike!" 💥
🟢 Go Long:
Swipe in on bullish momentum.
🕒 Set Buy Limit Orders at key pullback zones (swing highs/lows from 15m or 30m timeframes).
💼 Use DCA (Layered Orders) for multiple precision entries. The more layers, the stronger the loot stack.
🛑STOP LOSS – "Thief Rule: Don’t Get Caught"
📍Place SLs at logical swing highs/lows using the 1H timeframe
💡 Adjust according to lot size & how many entries you're stacking
Risk smart, steal smarter!
🎯TARGET – "Make the Escape at 2850.0 or Jump Early if Cops Close In!"
📌Set TP at 2960.0, or
📌Exit early if the market starts turning shady (exit before reversal signs appear)
⚔️SCALPER'S CODE – "Fast Hands Only!"
🧲Only scalp Long-side plays
🧠Use trailing SLs to protect stolen profits
💼Big wallets? Front-run the move
🪙Smaller bags? Team up with swing traders and follow the blueprint.
🚨MARKET CONTEXT – Why This Heist is Bulletproof
💥ETH/USD is showing bullish energy due to:
Macro & Fundamental Drivers
On-Chain Metrics showing accumulation
Sentiment Analysis leaning toward over-leveraged bears
Intermarket Correlation signaling rotation into altcoins
🔗Stay sharp, keep updated with: COT Reports, Macro Calendar, Crypto News Feeds
⚠️NEWS RELEASE WARNING – "Robbers Hate Surprises"
📛Avoid new entries during major news releases
📈Use Trailing Stop Losses to lock in profits
⛔Don’t leave positions unmanaged during volatility spikes
💖LOVE THE PLAN? THEN BOOST THE GANG!
🎯Tap the 🔥 Boost Button 🔥 and show support for the Thief Trading Style!
The more boosts, the more plans drop — let’s build a community of smart traders robbing the market legally (😉).
✍️DISCLAIMERS
📌This analysis is for educational purposes only — not financial advice.
📌Always trade within your own risk management rules.
📌Market conditions change fast — adapt, evolve, and don’t trade blindfolded.
🚀Stick around for more blueprints — the next heist is always just around the corner.
Until then… Lock. Load. Loot. 🐱👤🤑💰

ETHUSD h4 next move downThe resistance at 1.36554 may be weak due to:
Multiple taps already
Reduced seller interest
A breakout above this zone could trigger short covering → sharp rally
✅ 2. Higher Low Structure
Recent low at 1.35475 held strong
Current consolidation appears like a bullish flag or accumulation range
Could indicate continuation, not rejection
✅ 3. Fakeout Reversal Setup
If price dips into the support at 1.35475 again, it might:
Trap breakout traders
Reverse and form a new impulse leg upward
Target = 1.3700–1.3750 zone

DeGRAM | ETHUSD rebound from the support line📊 Technical Analysis
● Bounce off the purple up-trend and 2 320 support printed a bullish engulfing, maintaining the sequence of higher-lows that has guided price since April.
● Price is squeezing into an ascending triangle under 2 700-2 730, where the former wedge cap meets horizontal supply; a break projects to the 3 040 macro fib / channel roof.
💡 Fundamental Analysis
● Net-staking deposits keep rising while, per FXStreet (25 Jun), whales add ETH ahead of the SEC’s spot-ETF S-1 verdict, underpinning demand.
✨ Summary
Long >2 320; triangle breakout above 2 730 targets 3 040. Thesis void on a 16 h close below 2 200.
-------------------
Share your opinion in the comments and support the idea with like. Thanks for your support!

Ethereum Bullish Bias Pauses After Reaching Weekly HighF enzo F x—Ethereum rose from $2,539.5, backed by VWAP and volume profile, but momentum eased after hitting the $2,651.0 weekly high. Stochastic signals overbought conditions at 87.0, hinting at possible consolidation or downside pressure.
Bullish scenario : The bullish trend remains intact above $2,500, with upside potential toward the bearish FVG at $2,741.0.
Bearish scenario : A close below $2,500 would shift focus to the $2,383 support zone.

ETHUSDT Long / Buy SetupMust take from the entry and USE tight SL. Can be a fakeout, if real breakout then tps are mentioned. In case sl hit, use the previous setup, it's still valid. While for short I'm still waiting for 3k or above.

ETHUSD POTENTIAL LONGETHUSD potential bullish setup ↗️
ETH still showing bullish momentum. Might bounce on the bullish trend line, for now it’s hasn’t done the third touch so expect it go lower to the trendline first. A strong bullish confirmation would be a signal to go LONG. Share your thoughts on this in comment section.

ETH SWING TRADEETH Showing strong momentum against BTC, July is also good for eth and some alts, maybe we see correction in Aug, September but before expected pullback towards 2.9k-3k. Must use SL as market is very Volatile these days.
ethusdt no trade zoneETH is stuck in a range, wait for the sweep of range high, then closing below the range high and take the short, target weekly low. 2nd scenario is wait for to take out the weekly low and any daily candle closing failed to close below this level take the long entry and target the range high. Otherwise expecting this week choppy mean sideways. no major move. Will update if found any good trade.

Ultimate Ethereum Heist Plan : Catch the ETH/USD Bull Run!🌍 Hello, Global Money Makers! 🌟 Salaam, Ciao, Hola! 🌟
Dear Traders and Market Raiders, 🤑💸
Get ready to execute the *Thief Trading Strategy*—a slick blend of technical and fundamental analysis designed to conquer the ETH/USD crypto market! 📈💥 Follow the plan outlined in the chart for a *long entry* and aim to cash out near the high-risk *Yellow ATR Zone*. This is where the market gets wild—overbought conditions, consolidation, or even a trend reversal could trap the bears! 🐻💪 Take your profits and treat yourself—you’ve earned it! 🎉
**Entry 📈:** The heist begins! Wait for the *Moving Average breakout* at 2750 to strike. Bullish gains are calling! 💰
- Set *buy stop orders* above the MA for a clean breakout.
- Alternatively, place *buy limit orders* on a pullback within a 15 or 30-minute timeframe, targeting the most recent swing low/high.
📢 *Pro Tip:* Set an alert on your chart to catch the breakout moment! 🚨
**Stop Loss 🛑:** Listen up, crew! 🗣️ For *buy stop orders*, hold off on setting your stop loss until *after* the breakout. Place it at the nearest swing low on the 4H timeframe (around 2360) for day/swing trades.
- Adjust your stop loss based on your risk tolerance, lot size, and number of orders.
⚠️ Take control of your risk—it’s your heist, not mine! 😎🔥
**Target 🎯:** Aim for 3200 or exit early if the market signals a reversal.
**Scalpers, Eyes Here 👀:** Stick to *long-side scalping*. Got deep pockets? Jump in now! Smaller accounts? Join the swing traders and follow the plan. Use a *trailing stop loss* to lock in your loot. 💰
**Market Outlook 🐂:** The ETH/USD market is charging with bullish momentum, fueled by key fundamentals. ☝️ Check the linkks for *COT Report*, macroeconomics, sentiment, and intermarket analysis for a full picture. 👉🏻🔗
**⚠️ Trading Alert: News & Risk Management 📰**
News releases can shake up prices and volatility. Protect your positions:
- Avoid new trades during major news events.
- Use *trailing stop-loss orders* to secure profits.
💥 *Boost This Plan!* 💥 Support our *Thief Trading Crew* by hitting the Boost button. Let’s make money effortlessly every day with this strategy! 🚀🤝 Stay tuned for the next heist plan, and let’s keep raiding the markets! 🤑🐱👤🎉

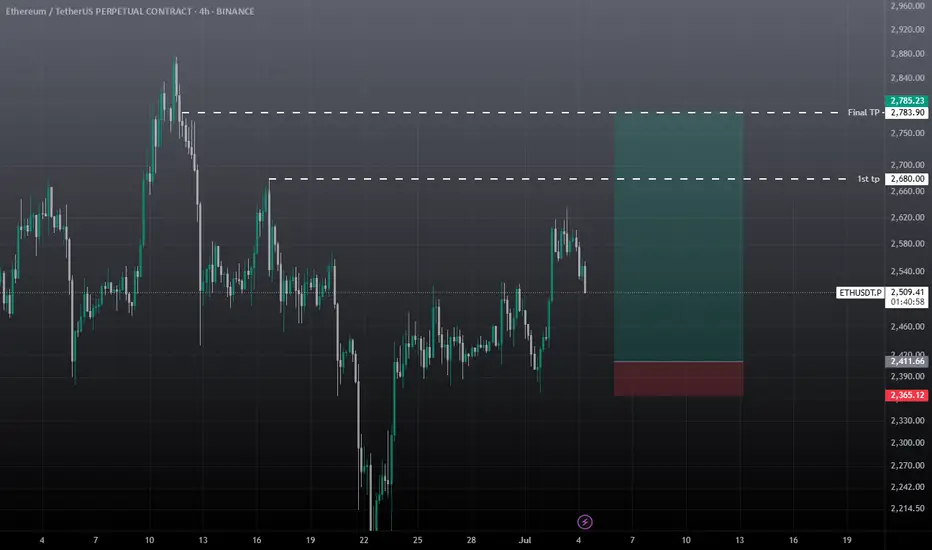
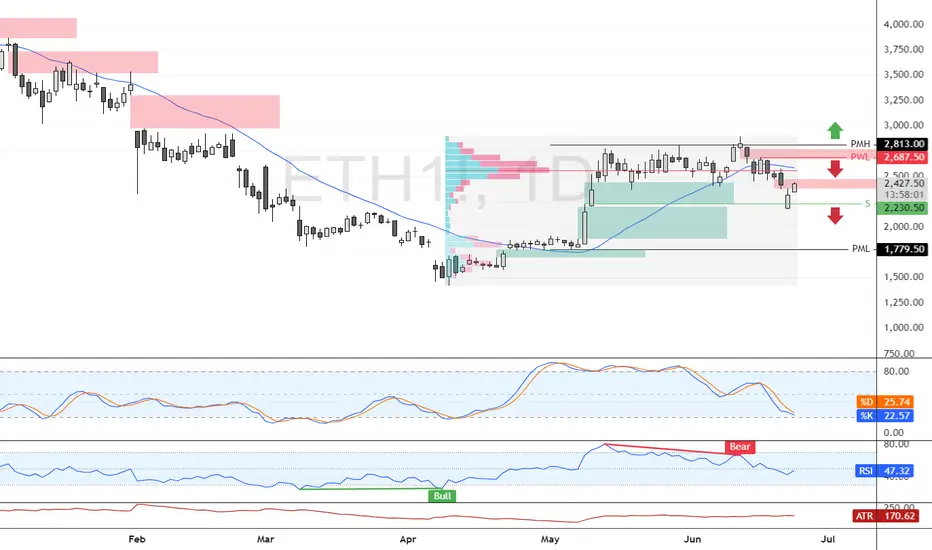
Bearish Wave Builds Below Key ETH Supply ZoneFenzoFx—Ethereum failed to break above $2,813.0 and is now trading around $2,430 after trimming nearly 5.0% of recent losses.
The $2,687.0 area, backed by the 50-period SMA, acts as a premium supply zone. A bearish wave could follow, targeting $1,779.0, supported by prior monthly lows and RSI divergence.
The bearish outlook is invalidated if ETH/USD closes above $2,813.0.
Ethereum / U.S. Dollar 2-Hour Chart (Binance)2-hour price movement of Ethereum (ETH) against the U.S. Dollar (USD) on the Binance exchange. The current price is $2,403.11, reflecting a 0.44% decrease (-$10.64) as of 01:57:20. The chart shows a recent upward trend after a significant drop, with key price levels marked at $2,461.10 (high) and $2,319.52 (low). Time markers range from 15 to 29, with the current time around 01:57:20 on June 24, 2025.

Ethereum/US Dollar 4-Hour Chart (BINANCE)4-hour price movement of Ethereum (ETH) against the US Dollar (USD) on the BINANCE exchange. The current price is $2,211.36, reflecting a decrease of $85.21 (-3.71%). The chart highlights a recent downward trend with a potential support zone between approximately $2,100 and $2,200, followed by a possible upward movement as indicated by the shaded area. The data is captured as of June 23, 2025.

DeGRAM | ETHUSD held the trend line📊 Technical Analysis
● Price just printed a long-tailed rebound on the 4-month purple up-trend and the 2 520-2 560 demand strip, also reclaiming a broken pennant base—confirming a fake breakdown and locking the zone as fresh support.
● A higher-low sequence is compressing against the descending 2 650 trend cap; a 4 h close above it activates the 2 723 horizontal target and projects the channel-median swing toward 2 865.
💡 Fundamental Analysis
● Net staking deposits keep outpacing withdrawals while CME ether futures open-interest hit a six-week high, signalling renewed institutional hedging ahead of the spot-ETF ruling and supporting upside bias.
✨ Summary
Buy 2 540-2 580; clearance of 2 650 aims 2 723, stretch 2 865. Invalidate below 2 450.
-------------------
Share your opinion in the comments and support the idea with like. Thanks for your support!
Ethereum's Monthly High Rejection: Is a Bearish Wave Coming?FenzoFx—Ethereum tested and swept the monthly highs at $2,813 but failed to sustain its bullish momentum. The 1-hour chart formed a bearish fair value gap, signaling increasing selling pressure.
Currently, Ethereum trades slightly below the monthly high at approximately $2,806, with immediate resistance at $2,813. If this level holds, ETH/USD could target the 50.0% retracement zone near $2,640.

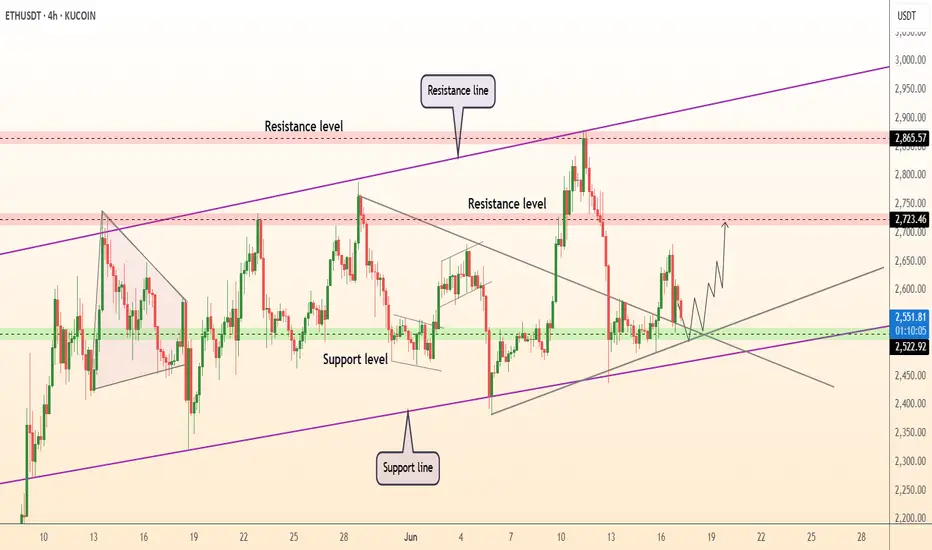
ETHUSD KEY LEVEL.This is the 4 hour chart of ETHUSD.
ETHUSD is currently consolidating in a well defined range.
If the lower boundary of the zone is sustainable ,then we see again higher prices in ETHUSD.
Thank you !!

