ETH trade setup for 15th Nov 2023My setup yesterday was bullish, I only caught a 1:2rr. I didn't see other factors telling me to go bearish.
I was bent on being bullish, so I know and believe, setups can change. So learning to be dynamic is key and not holding to one belief of how the trade should pane out. However, it was a good day.
Today being, 15th Nov 2023, I'll be expecting a bearish scenario as outline on the chart. So I'll be expecting price to enter into the areas highlighted above and also the rectangle above for a reason to go short at specific time.
This is not a trade advice, please dyor
Ethusdanalysis

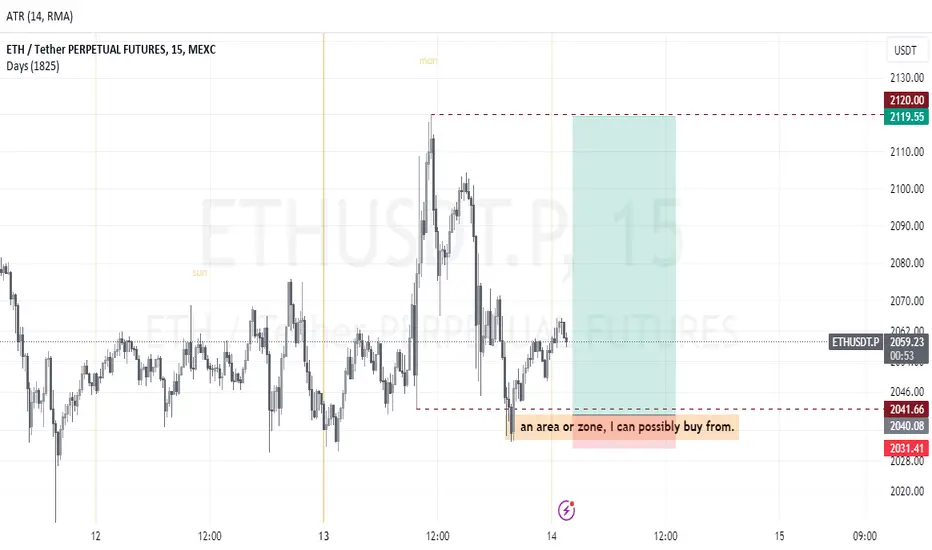
ETH Trade setup for 14th Nov 2023Eth has been bullish compared to BTC, so for me to trade this pair because it refused to make lower low but it also still took out some lows as an inducement to go short however, that's not the actually direction. It's direction is bullish to offset short traders. My possible scenario is for the market to trade into my zone at about 9:30am NY time today, then I can see what price is doing. If there be reasons to go long or short.
ETH: Potential Consolidation Before Targeting $2000ETH might be gearing up for a brief period of consolidation before setting its sights on the $20,000 price mark. This strategic pause can be seen as a part of the natural price journey for Ethereum, allowing it to gather momentum and prepare for the next potential bullish move.

#ETH - thoughts out loud#9Good evening from Ukraine!
Dear colleagues, I am glad to welcome you!
Work plan.
Thank you all for your attention, I wish you success.
Sometimes you win/sometimes you learn.
- thoughts out loud
- thoughts out loud
- thoughts out loud
P.S.
...Think positive

Ethereum's Potential to Reach $2000 TargetEthereum has potential to reach the $2000 target. While it is important to approach such predictions with caution, there are several factors that suggest this milestone could be within reach. This idea aims to provide you with an overview of these factors and encourage you to consider a long position on Ethereum.
1. Market Momentum: Over the past few months, Ethereum has displayed remarkable resilience and has consistently demonstrated an upward trend. Despite occasional volatility, the overall market sentiment towards Ethereum remains positive. This consistent growth is a promising sign for traders who are looking to capitalize on potential long-term gains.
2. Institutional Adoption: Ethereum has gained significant traction among institutional investors, with major financial players showing a growing interest in this digital asset. The increased institutional adoption not only adds credibility to Ethereum but also paves the way for further growth and stability. This trend indicates that Ethereum's potential is being recognized by established financial institutions, which could potentially drive up its value.
3. DeFi and Smart Contracts: Ethereum's blockchain serves as the foundation for a multitude of decentralized applications (dApps) and smart contracts. The explosive growth of the decentralized finance (DeFi) sector has significantly increased the demand for Ethereum, as it remains the preferred platform for most DeFi protocols. As the DeFi space continues to expand and mature, Ethereum is likely to experience increased utility and demand, potentially driving its value higher.
Considering these factors, it is crucial to approach this potential opportunity with a cautious mindset. While Ethereum's growth has been impressive, the cryptocurrency market is inherently volatile, and past performance does not guarantee future results. It is essential to conduct thorough research, assess your risk tolerance, and consider consulting with a financial advisor before making any investment decisions.
If you are interested in exploring a long position on Ethereum, I encourage you to carefully analyze the market, monitor the latest news and developments, and consider setting stop-loss orders to mitigate potential risks. Additionally, staying updated with market trends and being prepared to adapt your strategy accordingly will be key to maximizing your chances of success.
As always, please remember that this idea is not financial advice, and you should conduct your own due diligence before making any investment decisions.

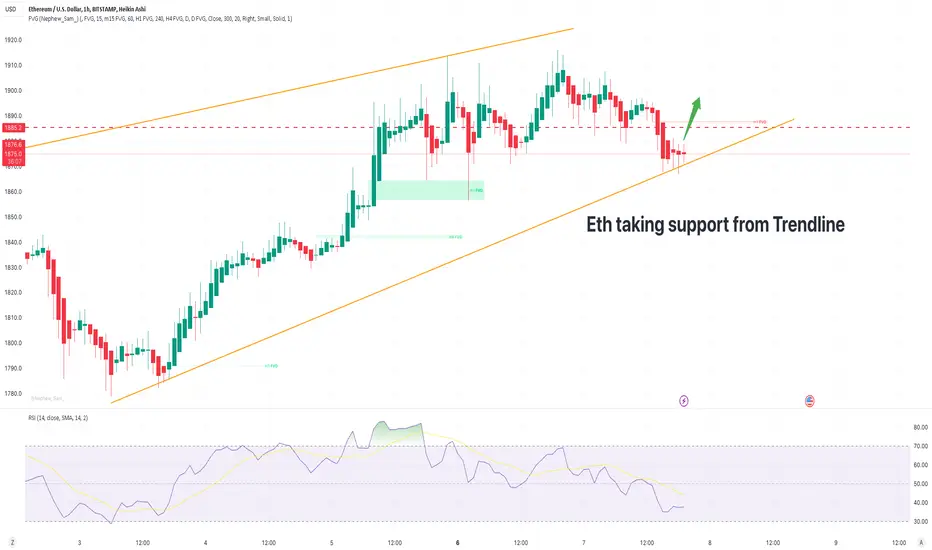
ETHUSD on Trendline SupportEth is on 1hr trendline support, so there is a buy opprtunity.
Manage your risk accordingly.
ETHLeading cryptocurrencies Bitcoin (BTC), Ethereum (ETH) and XRP are showing significant gains, according to data from CoinStats. Today, BTC was up 0.91%, trading at $35,171, with expectations of breaking the $35,612 resistance. If this level is surpassed, BTC is likely to reach $36,000 by the end of this week.
On the other hand, ETH outperformed other cryptocurrencies with a gain of 1.73% and is currently trading at $1,909. If ETH surpasses yesterday's peak, it is predicted to hit the critical $2,000 zone by mid-November.

BTCPossible HTF count if conditions are met. Would be looking for the 3 to top before 1/2ing around SWB:69K

ETHUSD SELL | Day Trading Analysis Hello Traders, here is the full analysis.
Watch strong action at the current levels for SELL . GOOD LUCK! Great SELL opportunity ETHUSD
I still did my best and this is the most likely count for me at the moment.
Support the idea with like and follow my profile TO SEE MORE.
Traders, if you liked this idea or if you have your own opinion about it, write in the comments. I will be glad 🤝
Patience is the If You Have Any Question, Feel Free To Ask 🤗
Just follow chart with idea and analysis and when you are ready come in THE GROVE | VIP GROUP, earn more and safe, wait for the signal at the right moment and make money with us💰


EthereumPair : ETHUSD ( Ethereum / U.S Dollar )
Description :
Bearish Channel as an Corrective Pattern in Short Time Frame and Rejection from the Upper Trend Line or S / R Level. Completed " 1234 - abcd " Impulsive Waves at Fibonacci Level - 38.20%
Entry Precaution :
Wait until it Rejects or Breaks the UTL

#ETHERIUM Trading Strategy!🚀 #ETHEREUM : A Closer Look 📊
Examining two exciting scenarios:
1️⃣ A retest of the Blue MA, potentially shaking out weak hands and paving the way for a push to $2000-$2130.
2️⃣ A successful breakout and retest of the Blue Flag.
In both cases, bullish sentiment prevails. The Blue MA has a strong track record in previous rallies.
Trading Actions:
For spot holders, HODL strong.
Futures traders, consider entering at $1710 for a long position with a target of $2000+ and a stop-loss below $1635.
#Altcoins may offer better risk-reward ratios thanks to ETH.
Remember to DYOR. This isn't financial advice.
Share your thoughts on ETH! 💬
#Crypto

A small dip in ETHEREUM and the a rally towards 3000!!The crypto is seen making impulse waves from June 2022 and has completed a structure of 1-2-I-II till now, meaning it completed the wave II of 3 and started off in the wave III of 3.
The recent oct 2023 rally is the first leg to the bigger III wave that is forming.
It would be a wise to wait for a meaningful retracement to this oct wave for a good entry. The 50% retracement of wave i of wave III of wave 3(i.e. current oct rally) is at 1687 and 61.8% retracement is at 1646. The B wave dip can take the crypto to these levels and that should be considered a good entry to go long towards 3K mark.
Note*- this post is for educational purpose only

ETHUSD Analysis H1Here is my analysis for ETHUSD on H1 using Order Block. The price could go bullish, you can put a pending order on the Order block or find an entry on LTF within OB Zone. Trade Safe!

False breakout in ETH? Time to analyzeDear traders, Ethereum broke out of the 1750 resistance level on
24 October. However, we are seeing the absence of a follow-through
here.
If you notice the last few daily candlesticks, you can see some long wicks
at the top of each candlestick. This indicates that we might have had
a false breakout. If ETH falls back below 1750, expect another drop
to 1540 soon.

ETHUSDT futuresETHUSDT futures, looking for the short on a limit order, I believe price has rallied to some resistance now, we can see some sell. I could be wrong also. DYOR

Ethereum Quietly bounces off key support Ethereum - CRYPTOCAP:ETH
Bitcoin has been stealing the stage but is quietly confident making firm support in the background
Eth has bounced from a long term diagonal support line and currently challenges the 200 week MA
Hopefully we can turn the 200 MA into support
PUKA

Ethereum just getting startedETH 1week is breaking out of the long-term downward trendline ready for more upside Other parameters are reset with room to hold a nice upward move 2000 seems the next logical move for a shakeout

Ethereum bullish divergenceETH 1day shows bullish divergence with price heading up into the downward trendline resistance The double bottom pivot at 1530 was well into the lower levels of the upward facing Regression Chanel with other parameters reset ready for the next run We expect some resistance around the low 1700 area before moving back into the 2000 level for the next washout This area looks a logical exit point for early leveraged traders

ETHUSD Analysis H1Here is my analysis for ETHUSD on H1 using Order Block. The price could go bearish, you can put a pending order on the Order block or find an entry on LTF within OB Zone. Trade Safe!

ETHUSD: $1880 IS THE NEW TARGET! For the short term view, we think price will be bullish up until $1880 region. At that point price will drop for the last time before it the trend changes.

ETHUSD Analysis H1Here is my analysis for ETHUSD on H1 using Order Block. The price could go bullish, you can put a pending order on the Order block or find an entry on LTF within OB Zone. Trade Safe!
