ETHUSDC
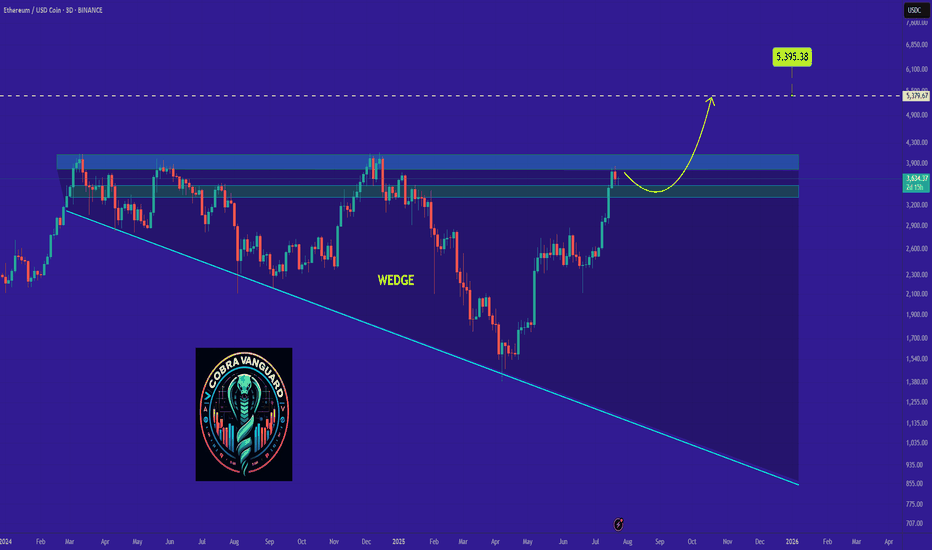
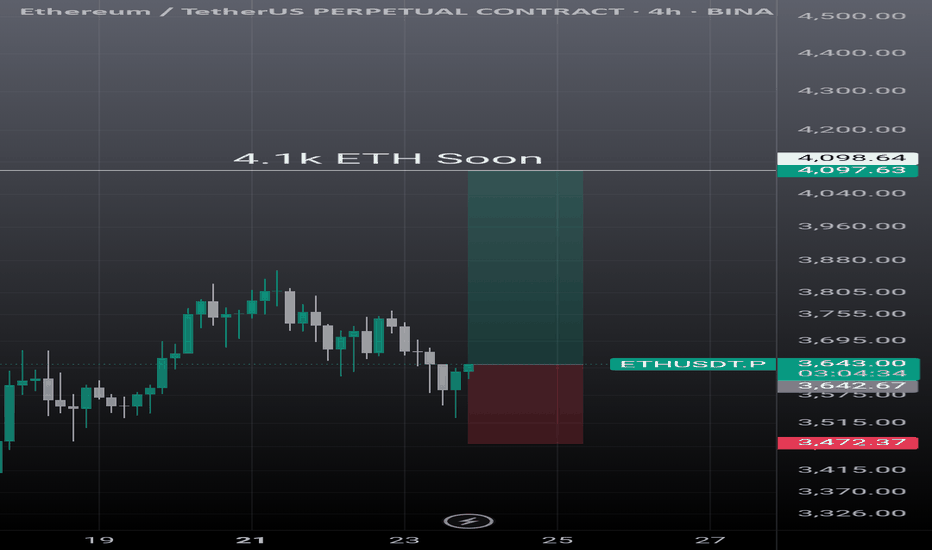
ETH's situation+ Target PredictionThe price has reached the upper boundary of the wedge, which could lead to a slight price drop. We can be hopeful that after breaking out of the wedge, we will see significant price growth.
Give me some energy !!
✨We spend hours finding potential opportunities and writing useful ideas, we would be happy if you support us.
Best regards CobraVanguard.💚
_ _ _ _ __ _ _ _ _ _ _ _ _ _ _ _ _ _ _ _ _ _ _ _ _ _ _ _ _ _ _ _
✅Thank you, and for more ideas, hit ❤️Like❤️ and 🌟Follow🌟!
⚠️Things can change...
The markets are always changing and even with all these signals, the market changes tend to be strong and fast!!
ETH Breaks Key Resistance – $6K Possible if Wedge BreaksETHUSDT has broken out above a key horizontal resistance zone that has historically acted as a strong support and resistance level. This zone, marked in blue, has seen multiple rejections and bounces over the past year, confirming its significance.
The recent breakout above this zone indicates a shift in market structure and suggests growing bullish momentum. The price action shows a clean move above resistance, with potential for a retest before continuing higher. The market is also forming a long-term broadening wedge pattern. The next target lies near the upper resistance of the wedge, around $4,000. If the price breaks above this broadening wedge, it could open the path toward the $6,000 level.
Regards
Hexa
$ETH: The 1-week chart is an absolute disaster!Once again, I want to make it clear: I’m naturally a bull. But I live in Thailand, far from the noise of influencers shouting "buy, buy, buy!" I’ve learned my lesson—when they scream buy, you get rekt. That’s why I rely solely on the charts.
Charts are just mathematics—they don’t lie. So here’s my honest interpretation of what I’m seeing for Ethereum:
🕐 Daily Outlook
Yes, we might see a few nice bounces in the short term. But if your plan is to hold ETH, you should be paying attention to higher timeframes, especially the weekly.
📉 Weekly Chart — It's Ugly
We’re clearly in a descending wedge, and overall, ETH is bearish. Don’t be fooled by the hype or the people trying to take your money.
- RSI is bearish, with a strong bearish divergence still unfolding.
- MACD is on the verge of a bearish crossover, and what’s worse, it’s doing that without even touching the neutral zone—a major red flag.
The last time we saw this setup? November 2021. The price crashed below $1,000.
🔍 Where’s the Support?
This cycle, the support zone looks closer to $1,500, mainly due to institutional interest and the ETF narrative. A full retracement seems unlikely, but technically speaking—it’s still a possibility.
🤔 Why Is This Happening Despite Institutional FOMO?
Here’s the key: ETH has staking, and every month, new CRYPTOCAP:ETH is minted to pay stakers. This creates constant inflation. On top of that, many stakers compound their rewards, accelerating the inflation. And guess what? These same stakers are selling as soon as ETH pumps.
So fundamentally, Ethereum is under pressure because of its own staking mechanics—a system flaw that creates long-term selling pressure.
Do your own research (DYOR). I could be wrong—but at least I’m not trying to sell you a course.
Ethereum Swing Trade: Short Setup with 2.2 R:R PotentialEthereum is approaching a potential breakdown from its current channel. A short swing trade setup with a 2.2 risk-to-reward ratio is forming. Wait for a confirmed break below the channel before entering.
Entry: $2,553
Stop Loss: $2,680
Target: $2,266
This is for educational purposes only.
Be careful with ETH !!!Currently, ETH is forming an ascending triangle, indicating a potential price increase. It is anticipated that the price could rise, aligning with the projected price movement (AB=CD).
However, it is crucial to wait for the triangle to break before taking any action.
Give me some energy !!
✨We spend hours finding potential opportunities and writing useful ideas, we would be happy if you support us.
Best regards CobraVanguard.💚
_ _ _ _ __ _ _ _ _ _ _ _ _ _ _ _ _ _ _ _ _ _ _ _ _ _ _ _ _ _ _ _
✅Thank you, and for more ideas, hit ❤️Like❤️ and 🌟Follow🌟!
⚠️Things can change...
The markets are always changing and even with all these signals, the market changes tend to be strong and fast!!
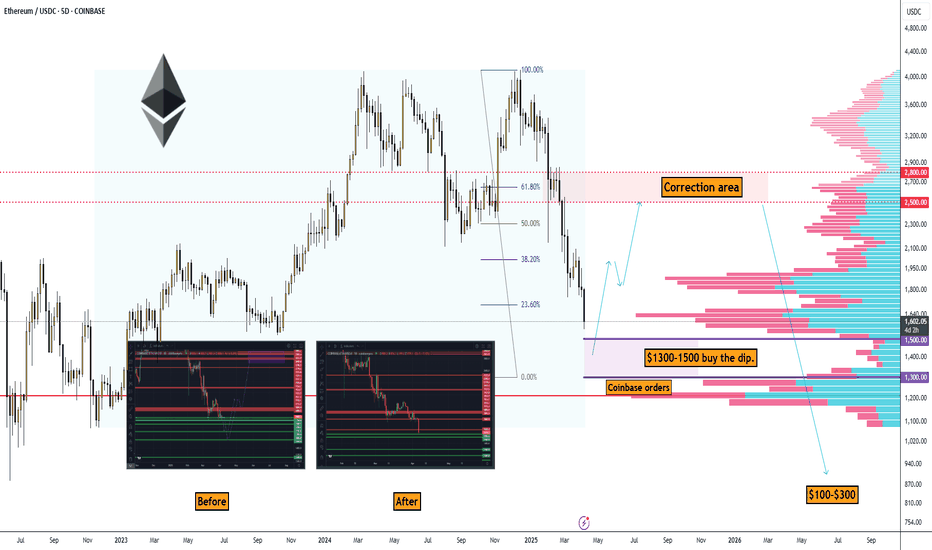
Ethereum: Correction to $1,300–$1,500 and Rise to $2,500–$2,800#Ethereum Price Analysis: Correction to $1,300–$1,500 Before Potential Rise to $2,500–$2,800
Let’s break down why Ethereum (ETH) might correct to the $1,300–$1,500 range and then potentially rise to $2,500–$2,800 (with increased risk beyond that).
Technical Analysis
On the ETH/USDC 5-day timeframe chart from Coinbase, key points confirm a correction to $1,300–$1,500:
1. Correction Target: $1,300–$1,500 ("Coinbase orders")
• Limit orders were placed on Coinbase before the drop.
2. Hyperliquid Liquidation Map
• According to the Hyperliquid Liquidation Map, the liquidation level for long traders is at $1,337.00, within the target zone of $1,300–$1,500.
• A price drop to this level could trigger a cascade of liquidations, and market makers might accumulate positions at the lowest prices, specifically in the liquidation area.
3. Elliott Waves
• We’re completing the 5th wave and starting to form a reversal. This event will roughly coincide with the S&P 500’s reversal.
What Event Could Trigger the Correction?
• An expected Bitcoin correction to $70,000–$76,000 could trigger Ethereum’s drop, as the altcoin market historically follows BTC.
• I’ve previously shared this Bitcoin idea; we’re waiting for it.
Potential Targets for Ethereum Before a Global Downturn
Look for an exit point in this area: $2,500.00–$2,800.00
➖ This is approximately the 61.8% Fibonacci level
➖ A significant area according to the Volume Profile
➖ Large sell orders on Binance at $2,500, $2,800, and $3,000
➖ On Coinbase, they’re getting smarter and splitting orders into 500–600 ETH.
➡️ In Summary for Ethereum
This makes the $1,300–$1,500 range attractive for buying the dip.
ETHUSD Ready for PUMP or what ?Currently, ETH is forming an ascending triangle, indicating a potential price increase. It is anticipated that the price could rise, aligning with the projected price movement (AB=CD).
Give me some energy !!
✨We spend hours finding potential opportunities and writing useful ideas, we would be happy if you support us.
Best regards CobraVanguard.💚
_ _ _ _ __ _ _ _ _ _ _ _ _ _ _ _ _ _ _ _ _ _ _ _ _ _ _ _ _ _ _ _
✅Thank you, and for more ideas, hit ❤️Like❤️ and 🌟Follow🌟!
⚠️Things can change...
The markets are always changing and even with all these signals, the market changes tend to be strong and fast!!
$ETH update, are we at the bottom?We’re getting close.
If you’re still holding AMEX:ETH , you might just need a bit more patience — in a month, we could be heading back up.
Let’s break down the chart, because this is a fascinating setup:
1️⃣ Two similar patterns with three tops and three MACD resets.
2️⃣ AMEX:ETH is in a consolidation zone between $1950 and $1075, right where past rallies have started.
3️⃣ MACD on the weekly is near reset — a bullish reversal could kick in within 2 weeks and last 6+ months.
4️⃣ RSI is at the bottom, aligning perfectly with the MACD: this often signals a bounce.
📉 Yes, one last dip is possible — maybe $1150–$1250 — but I personally think AMEX:ETH will bounce above the previous low.
🚫 Don’t sell the bottom. Capitulating now could mean missing out on the reversal.
📅 Timeline? January was the time to exit. If you’re still in, just hold tight — things might look very different by May and beyond.
⚠️ Disclaimer: This is a chart-based analysis. Macro factors (👋 tariffs!) can shift everything, so stay alert and manage risk.
The current ETH chart, incorporating my 'flash-crash' thesisThis chart illustrates the current ETH pattern, with my 'April flash crash thesis.'
I believe we will see another thrust lower into the marked lower ranges before a spring into the fifth wave. However, the fifth wave will be a "false breakout," as a flash crash in mid to late April is likely to occur, intentionally designed to sweep liquidity by liquidating overleveraged positions and triggering stop losses—only for the market to recover shortly thereafter and continue its breakout to the upside. This breakout will likely push beyond the pattern and take out the "Trump Election Pump" highs.
There could be some opportunities in the next 4 to 6 weeks, but with opportunity comes risk. Always use a proper risk management strategy suited to your skill level and wallet size.
Good luck, and always use a stop loss!
Ethereum: I expect it to reach $1,800-$2,243.Current situation with Ethereum: I expect it to reach $1,800-$2,243 based on Coinbase data.
Not going into too much detail, but in short: the stock market will drop, and Bitcoin and Ethereum will follow.
➖ Please avoid using leverage—the market is highly volatile right now.
ETHEREUM - Time to buy again!In my opinion, Ethereum is really undervalued in terms of price. My price target for Ethereum is $7000. As you can see, the price is in an ascending triangle, This is something that cannot be easily ignored. We can hope that in the year, Ethereum's price could at least double from its current value.
Give me some energy !!
✨We spend hours finding potential opportunities and writing useful ideas, we would be happy if you support us.
Best regards CobraVanguard.💚
_ _ _ _ __ _ _ _ _ _ _ _ _ _ _ _ _ _ _ _ _ _ _ _ _ _ _ _ _ _ _ _
✅Thank you, and for more ideas, hit ❤️Like❤️ and 🌟Follow🌟!
⚠️Things can change...
The markets are always changing and even with all these signals, the market changes tend to be strong and fast!!
ETH - Time to buy again!The price has formed a Triangle on the 4h time frame, and if it breaks out, it can drive the price up to around $3K.
Give me some energy !!
✨We spend hours finding potential opportunities and writing useful ideas, we would be happy if you support us.
Best regards CobraVanguard.💚
_ _ _ _ __ _ _ _ _ _ _ _ _ _ _ _ _ _ _ _ _ _ _ _ _ _ _ _ _ _ _ _
✅Thank you, and for more ideas, hit ❤️Like❤️ and 🌟Follow🌟!
⚠️Things can change...
The markets are always changing and even with all these signals, the market changes tend to be strong and fast!!
Is ETH Done Dropping?A few days ago, the crypto market experienced another brutal sell-off, leaving most traders in despair.
But historically, whales love to shake people out before pushing prices up.
Looking back at past bull runs, it’s common to see a sharp crash forming a bearish pattern, only for the price to suddenly skyrocket—leaving everyone behind.
Will it happen again this time?
I can’t say for sure.
But based on the overall market structure— BINANCE:BTCUSDT , BINANCE:ETHUSDT , CRYPTOCAP:BTC.D , CRYPTOCAP:OTHERS , CRYPTOCAP:TOTAL3 —the bull market still seems intact.
Now, let’s talk about ETH.
The recent crash completely invalidated the inverse head-and-shoulders pattern, and that massive wick just happened to hit the weekly M-top target (light blue line).
Zooming out, the massive symmetrical triangle (yellow lines) from 2022 is still holding.
It looks like the whales intentionally broke below the triangle to create a bearish illusion and scare people into selling.
They did the same thing last August to November—three months of shaking out weak hands at the lower edge of the triangle.
At the time, many turned bearish.
Then, whales pumped ETH back into the triangle and even broke the upper boundary.
So right now, we see similar bearish traps :
An M-top that didn’t break the neckline.
A fake breakdown below the triangle’s lower edge without follow-through.
To me, this seems like another deliberate move to clean up weak hands.
Short-term, we’ve probably already hit the bottom.
From here, we’ll watch how the chart develops.
If you’re looking to enter, now seems like a reasonable time—but make sure you set a strict stop-loss.
🔴 for more future script "guesses" like this!
Where Ethereum Stands and The Best Time to BuyEthereum has essentially ranged the last year with large swings up and down. Major support rests at $2770 and upper resistance at $4700 with a current target of at least $13.6k.
While Ethereum has been ranging it's been falling against Bitcoin and like every bull cycle since 2017, Ethereum will be the last to catch up. But that time to buy is now and we can see major volumes have been hitting the Ethereum maket as eth/btc is in the buy zone below 0.031 with a target of 0.09. If bitcoin holds it's current support and runs to $174k in the coming months that puts Ethreum around $15.6k which is very close to my eth/usd target of $13.6k.
Aave market has 88% of all Ethereum on the platform (1.64M eth or $5.1 Billion) loaned out and sold short. There seem to be online wars of people fighting over why eth isn't on par with bitcoin. Ethereum futures has ATH open interest yet lending rates are near zero. These are all major signs of the end of the eth/btc bear market. We should see eth outperform btc this year. There's not much eth left to be sold short. I've never seen such reckless shorting of a crypto currency, but it's all fuel of the run up.
The last bullish chance of ETHEREUM in Mid term!As you can see, the price is forming two bullish patterns on the 4h timeframe, If my view is correct, ETH will rise to $3700 .
And if this pattern is correct and breaks, higher targets are possible.
Give me some energy !!
✨We spend hours finding potential opportunities and writing useful ideas, we would be happy if you support us.
Best regards CobraVanguard.💚
_ _ _ _ __ _ _ _ _ _ _ _ _ _ _ _ _ _ _ _ _ _ _ _ _ _ _ _ _ _ _ _
✅Thank you, and for more ideas, hit ❤️Like❤️ and 🌟Follow🌟!
⚠️Things can change...
The markets are always changing and even with all these signals, the market changes tend to be strong and fast!!
$ETH is ready to move to the upside.CRYPTOCAP:ETH has been in a consolidation phase since December 16. This period was accompanied by a bearish divergence that appears to have played out. Now, CRYPTOCAP:ETH seems poised to pump again on the daily timeframe.
The correction was moderate, with a decline of -21%.
Several resistance and support levels are marked with my green lines. My refill box at $2900 was not reached, but the bottom at $3100 was successfully touched.
It looks like it's time to long $ETH. Resistance levels are at $3700, $3800, and $4000 on the way up.
Let’s see how it performs.
DYOR!
Falling old year and rising in the new year!Ethereum will start to move in the same vein as Bitcoin , as I wrote earlier. It will manage to unload RSI, come to the key level again and push back from it. I have also published the global chart for Ethereum, there are no changes there.
Horban Brothers.


