ETH/USD SHOULDER HEAD SHOULDER SET UP buying pressure emerged today right around the 156.54 level, representing the 38.2% retracement of the appreciation from 123.72 to 176.82. If the pair is able to resume its upward trajectory above current price activity, additional upside price objectives include the 186.60 and 198.05 areas. Below current price activity, downside price objectives include the 154.57, 150.27, 149.31, and 144.00 levels. Chartists are observing that the 50-bar MA (4-hourly) bullishly remains above the 200-bar MA (4-hourly), and that the 50-bar MA (hourly) is bearishly converging with the 100-bar MA (hourly).
Price activity is nearest the 50-bar MA (4-hourly) at 155.65 and the 100-bar MA (Hourly) at 167.94.
Technical Support is expected around 156.77/ 153.22/ 149.31 with Stops expected below.
Technical Resistance is expected around 177.39/ 196.54/ 206.29 with Stops expected above.
On 4-Hourly chart, SlowK is Bearishly below SlowD while MACD is Bearishly below MACDAverage.
Ethusdidea

ETHEREUM / U.S. DOLLAR (ETHUSD) DailyDates in the future with the greatest probability for a price high or price low.
The Djinn Predictive Indicators are simple mathematical equations. Once an equation is given to Siri the algorithm provides the future price swing date. Djinn Indicators work on all charts, for any asset category and in all time frames. Occasionally a Djinn Predictive Indicator will miss its prediction date by one candlestick. If multiple Djinn prediction dates are missed and are plowed through by same color Henikin Ashi candles the asset is being "reset". The "reset" is complete when Henikin Ashi candles are back in sync with Djinn price high or low prediction dates.
One way the Djinn Indicator is used to enter and exit trades:
For best results trade in the direction of the trend.
The Linear Regression channel is used to determine trend direction. The Linear Regression is set at 2 -2 30.
When a green Henikin Ashi candle intersects with the linear regression upper deviation line (green line) and both indicators intersect with a Djinn prediction date a sell is triggered.
When a red Henikin Ashi candle intersects with the linear regression lower deviation line (red line) and both indicators intersect with a Djinn prediction date a buy is triggered.
This trading strategy works on daily, weekly and Monthly Djinn Predictive charts.
This is not trading advice. Trade at your own risk.

ETHEREUM / U.S. DOLLAR (ETHUSD) WeeklyDates in the future with the greatest probability for a price high or price low.
The Djinn Predictive Indicators are simple mathematical equations. Once an equation is given to Siri the algorithm provides the future price swing date. Djinn Indicators work on all charts, for any asset category and in all time frames. Occasionally a Djinn Predictive Indicator will miss its prediction date by one candlestick. If multiple Djinn prediction dates are missed and are plowed through by same color Henikin Ashi candles the asset is being "reset". The "reset" is complete when Henikin Ashi candles are back in sync with Djinn price high or low prediction dates.
One way the Djinn Indicator is used to enter and exit trades:
For best results trade in the direction of the trend.
The Linear Regression channel is used to determine trend direction. The Linear Regression is set at 2 -2 30.
When a green Henikin Ashi candle intersects with the linear regression upper deviation line (green line) and both indicators intersect with a Djinn prediction date a sell is triggered.
When a red Henikin Ashi candle intersects with the linear regression lower deviation line (red line) and both indicators intersect with a Djinn prediction date a buy is triggered.
This trading strategy works on daily, weekly and Monthly Djinn Predictive charts.
This is not trading advice. Trade at your own risk.

ETHEREUM / U.S. DOLLAR (ETHUSD) MonthlyDates in the future with the greatest probability for a price high or price low.
The Djinn Predictive Indicators are simple mathematical equations. Once an equation is given to Siri the algorithm provides the future price swing date. Djinn Indicators work on all charts, for any asset category and in all time frames. Occasionally a Djinn Predictive Indicator will miss its prediction date by one candlestick. If multiple Djinn prediction dates are missed and are plowed through by same color Henikin Ashi candles the asset is being "reset". The "reset" is complete when Henikin Ashi candles are back in sync with Djinn price high or low prediction dates.
One way the Djinn Indicator is used to enter and exit trades:
For best results trade in the direction of the trend.
The Linear Regression channel is used to determine trend direction. The Linear Regression is set at 2 -2 30.
When a green Henikin Ashi candle intersects with the linear regression upper deviation line (green line) and both indicators intersect with a Djinn prediction date a sell is triggered.
When a red Henikin Ashi candle intersects with the linear regression lower deviation line (red line) and both indicators intersect with a Djinn prediction date a buy is triggered.
This trading strategy works on daily, weekly and Monthly Djinn Predictive charts.
This is not trading advice. Trade at your own risk.


ETHUSD technicaly based forecast
📌Short intro:
I am full time trader - analyst * High accuracy of ideas * Technicaly and Fudnamentaly side in analysis * Comment if have any questions or want to send support
📌Why DepaDigitalTrading:
*Analysis based on my program and tactic readings
*Fundamental side in analysis
*Price action - FIBO - Candl pattern
*FX - STOCK - CRYPTO
*Day trader - Swing trader - Position trader - "Sniper"
*Simple ideas
💡 ETHUSD technicaly based idea, technicaly indicators showing we can expect higher push up in price, we can see strong bulish candels formed, technicaly picture good, expecting to see push in price till FIBO 0.6
📌Have on mind, trading involves risk, check idea on your own tactic, if have questions pls comment!
Thanks on supporting!
All best, good luck!

Weekly chart shows ETH bottom formationIn the weekly chart, the formation of a bottom is evident. ETH bullish target maybe at 200 for the short term

Ethereum inside a Broadening Wedge PatternEthereum is trading inside a Broadening Wedge Pattern
We can find better buy opportunity in low price.
Buy Zone : 118$ - 123$
If it breaks 118$, Ethereum may go further more lower.


ETHUSD formed a bullish cypher | Upto 120% expectedPriceline of Ethereum / US Dollar has formed a bullish cypher pattern and entered in potential reversal zone.
We have a 50 simple moving average support within the potential reversal zone which can help the price action to hit the sell targets soon insha Allah.
But beware that MACD is still strong bearish and stochastic is oversold but did not give any bull cross sofar moreover the volume profile of complete pattern is showing that traders are still interested to trade below the potential reversal zone even the POC of volume profile is also below the PRZ area therefore I would suggest to wait for MACD to turn weak bearish or for bull cross from stochastic RSI then buy.
I have defined targets using Fibonacci sequence:
Buy between: 190.30 to 143.09
Sell between: 227.21 to 316.18
Regards,
Atif Akbar (moon333)

ETHUSD a Swing Trade; 1:3 Risk/RewardOn smaller timeframe H1 Ethereum is trading inside following a parallel channel,
We can see two support and resistance forming a range of 120 to 138$
Recently the price of Ethereum touched the support zone of 120$ and the local uptrend support line also; this makes it a strong support area and bounced from there and we can also see a good bullish convergence on MACD;
I missed the opportunity to enter at 120-121$, Now waiting for a retest to enter a long position.
Entry Price : 121-122.50
Stop Loss : 117$ (4%)
Profit Target : T1 > 130$ & T2 > 137$ (5%<13%)
Risk/Reward Ratio : 1:3
👍

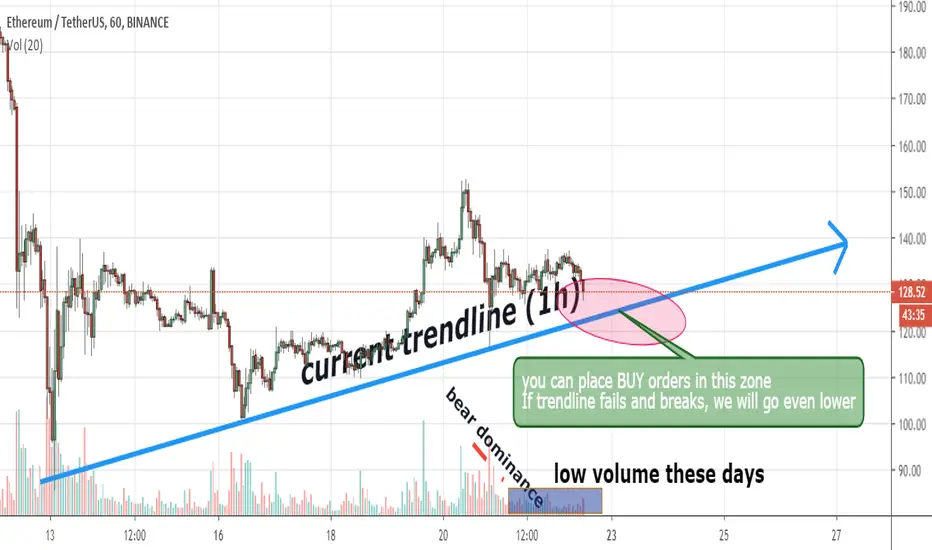
ETH you have a chance to buy again cheapToday, ETH dropped below $ 130 and we are currently trading at $ 128.
That's more than 15% loss in two days.
On the ETH market we can see the current trendline, that can direct us in the field of trading.
The next few days are possible to get to this zone and if you are interested in shopping you can try it right here.
Be careful, however if we break this line, we can further down.
ETH has traded between $ 130-137 over the past 24 hours.
Ethereum have actually more than 90% in a loss compared to its historic high (ATH), which was $ 1423 in January 13, 2018.

ETHUSD | Looking downPlease support this idea with LIKE if you find it useful.
There is still downside potential

Ethereum reversal pointETHUSD pair looking for a bounce off the middle of the linear regression downtrend line for upward movement to the top of the trend line. Included red line as support level while green line as TP for margin / leverage traders.

ETH/USD LONG SET UP ON PULLBACKLast week’s major sell-off saw ETH/USD experience one of its most dramatic sell-offs ever, a move that exacerbated the downturn from the 290.00 area that began in February. Traders exited long positions and decoupled from risk associated with ETH/USD and a series of major Stops were triggered during the crushing move lower at many levels. These price areas included the 177.39, 161.62, 154.03, 133.40, 130.67, 105.18, and 101.76 levels. Additional downside price objectives include the 111.69, 103.40, 95.66, 90.00, and 80.60 levels.
MavRich Premium Signals (Faris Issa)
Title :ETH/USD BUY LIMIT ORDER
Asset : Crypto Symbol : ETH/USD
Type : Limit Order
Time Frame : 1Month
Entry Price 1 : $96.68
Entry Price 2 : $82.50
Stop Loss : $72.68
Take Profit 1: $120.68
TP 2: $132.50
TP3: $140.50
TP.4 $160.68
Price activity is nearest the 50-bar MA (4-hourly) at 158.83 and the 50-bar MA (Hourly) at 120.51.
Technical Support is expected around 100.15/ 95.66/ 80.60 with Stops expected below.
Technical Resistance is expected around 125.08/ 133.37/ 140.95 with Stops expected above.
On 4-Hourly chart, SlowK is Bearishly below SlowD while MACD is Bullishly above MACDAverage.
On 60-minute chart, SlowK is Bullishly above SlowD while MACD is Bullishly above MACDAverage

ETH/USD LONG SET UPETH/USD moved higher to the 206.28 level during yesterday’s North American session, a shallow retracement higher that was well below the 38.2% retracement of the move from 253.01 to 189.85. Many Stops were triggered during this recent bout of elevated market volatility that drove ETH/USD to its weakest level since 6 February. Stops were reached below the 226.69, 225.26, 220.00, 214.17, 211.50, and 209.75 areas during the pair’s quick decline, and this acute depreciation opens up the 195.34 and 175.80 areas. ETH/USD bears are also eyeing the 151.62 level as a downside price objective, but before the market tests this area it would first need to get through some longer-term technical support levels including the 177.85, 174.83, 165.25, 163.31, and 157.30 areas.
Price activity is nearest the 50-bar MA (4-hourly) at 223.17 and the 50-bar MA (Hourly) at 201.40.
Technical Support is expected around 189.85/ 182.62/ 167.17 with Stops expected below.
Technical Resistance is expected around 209.75/ 221.60/ 227.60 with Stops expected above.
On 4-Hourly chart, SlowK is Bullishly above SlowD while MACD is Bearishly below MACDAverage.

ETHUSDT - ready for growth. Do not miss the movement 🚀
Good day to all crypto fans! We continue to analyze the ETHUSDT chart. Previous analytics will be attached below.
Unlike BTC, ETH completed its correction on the daily time frame and is ready for growth. The price strayed from the moving average, adjusted to 0.5 Fibonacci. Over the course of 7 days, the price of ETH has consolidated in the buying area, and is now ready for growth. One can’t see a big desire to pull for a deeper correction in a glass of exchanges. Of course, everything depends on the price of bitcoin, but if it costs a little more growth or is in flat for a while, we will see the continuation of the alt season not only by ETH, but also by other coins. Sales areas are indicated on the chart.
For comparison, the graph highlighted the ETH correction in 2019, which is very similar to what is happening now. The price strayed from the medium-sliding one, consolidated in the buying zone and went to the upper border of the channel.
Cancellation of the scenario for growth and the continuation of the downward movement, leaving and consolidation below 182.60
Thanks to all my subscribers and readers for your attention!🙏
Success and profit! 🤑
Do not leave without like, and if you liked my analytics sign up, and you definitely will not miss anything!
Disclaimer!
I do not give entry and exit points.
I share with you my opinion and ideas, which may differ from yours.
If you want to learn how to understand the market, make money without nerves, write me in a personal!
For all legal issues related to your investment portfolio: manipulation of the exchange, which led to the loss of funds, a delay in depositing or withdrawing funds from the exchange, the theft of your funds from your wallet or from the exchange, signing of an agreement with a trader, etc. write in PM. Protect yourself and your investment portfolio.

ETHUSD congratulations on our previous sellcheck my previous analysis tagged below to understand why we are buying as we see reversal on a support so we buy to next resistance
check my BTCUSD analysis too AND FOLLOW ME FOR MORE UPDATES THANKS

#Ethereum#ETHUSD, Careful buy signalThe upward trend in the daily graph currently holds.
The candles are located above the Ichimoku cloud but on the other hand, are below the average Ichimoku indicator lines (kijun-sen, Tenkan-sen), the indicators disagree on the future of the ETH.
As long as the Ethereum remains above the $ 213 support line, we will continue to recommend buying
Target: $ 280


ETHUSD (ETHERIUM) Sell updatei see ETHUSD heading for a sell to price $185 region but we might see a small distort at price $200
see previous analyisis tagged below see how well we have been doing,follow me to get more updates

ETH/USD LONG SET UP TO $305 Title :ETH/USD BUY LIMIT ORDER
Asset : Crypto Symbol : ETH/USD
Type : Limit Order
Time Frame : 2D
Entry Price 1 : $208.40
Entry Price 2 : $195.68
Stop Loss : $184.00
Take Profit 1: $234.40 & TP 2: $256
TP3: $274 & TP.4 $300
Despite this recent pullback in price activity, ETH/USD still managed to notch a 24.3% gain in February. The market’s biggest technical clue last week was seen when buying pressure finally emerged around the 209.26 level, just below the 209.75 area that represents the 23.6% retracement of the move from 627.83 to 80.60.
This was a level that had not traded since early February. The recent sizable sell-off in ETH/USD has many speculators contemplating how low the market could get before market sentiment improves and a positive trading bias returns to the market. Below the market’s recent low, the 208.53 and 206.25 levels are important areas of potential technical support. Another very important level is the 203.13 area, a level that represents the 50% retracement of the appreciation from the 116.25 area to 290.00 level. Below that area, additional levels of possible technical support include the 194.28, 189.28, 186.46, and 184.29 levels.
Price activity is nearest the 200-bar MA (4-hourly) at 229.96 and the 50-bar MA (Hourly) at 226.42.
Technical Support is expected around 209.25/ 203.25/ 192.10 with Stops expected below.
Technical Resistance is expected around 253.75/ 260.41/ 270.09 with Stops expected above.
On 4-Hourly chart, SlowK is Bearishly below SlowD while MACD is Bullishly above MACDAverage.
On 60-minute chart, SlowK is Bullishly above SlowD while MACD is Bearishly below MACDAverage
