ETH/USDT :: Update the previous idea .ETH/USDT :::
As it was said, the price reached the ceiling of the channel and turned the resistances in front of it into support. Now it is time for it to return to the ceiling of the channel once again to stabilize {this is possible}, but in general, the position is for the price to rise. It has been created properly .
Ethusdlong

#Ethereum - thoughts out loud #4 Good afternoon, dear colleagues!
I am glad to welcome everyone and wish you to get acquainted with my vision of the current situation on this instrument.
I expect purchases to resume in the price range of 1455-1475.
If the instrument shows weakness, I expect further depreciation of the instrument to the price of 1414.
The price has come to a strong resistance level. We are watching the continuation and making successful decisions
Dear colleagues, I sincerely thank you all for your attention and wish success to everyone!
And remember one thing:
"sometimes you win/sometimes you learn"

Ethereum Targets/ZonesNow we've started to see the early breakout from previous call back in early november.
What ive done here is simply overlap fib retrace levels from the previous bull and bear cycle with extension levels. Also bull cycle top with the 1.618 extension level. 2.618 is above 11xxx.

#Ethereum - thoughts out loud #3 Good afternoon, dear colleagues!
I am glad to welcome everyone and wish you to get acquainted with my vision of the current situation on this instrument.
Frankly speaking, there is no desire to describe the detailed situation, I will leave only a possible entry point. The entry point will work itself out in the presence of a strong buyer.
Dear colleagues, I sincerely thank you all for your attention and wish success to everyone!
And remember one thing:
"sometimes you win/sometimes you learn"

ETHVery simple ... Very clear!
Everything is marked on the chart.
This is my personal opinion. Please do not trade based on my analysis and data.

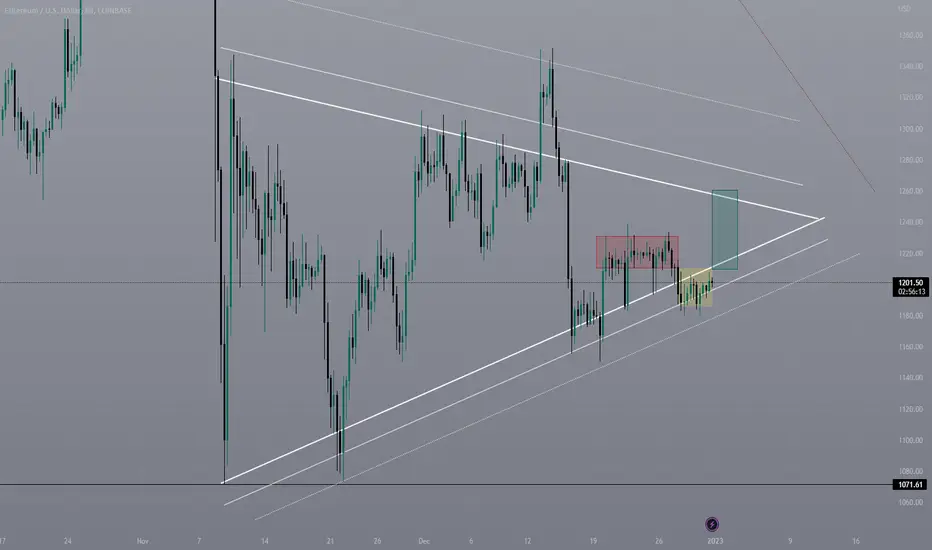
ETH/USDT :: Price increase or decrease ?ETH/USDT :::
The price is close to breaking the resistance line if there is support at this price .
The resistance will be broken and it will go to the ceiling of the channel, but otherwise the resistance will cause the price to fall .
<<< Good luck >>>

Ethereum - thoughts in hearing #1BINANCE:ETHUSDT
Good afternoon, colleagues!
I continue to think about this tool. There is no opportunity to describe the situation for a long time and I will give a more detailed opinion on Monday.
And for this period of time, if the instrument shows weakness in the range of 1261 - 1277, we can consider a scenario with a price decrease. In any case, we will see an impulse in one direction.
Thank you for your attention, I wish you success!
P.S.
All key prices are reflected by markers on the price scale...

ETH - Reached All Targets !BYBIT:ETHUSDT.P
4H time frame
-
Our strategy has been realized and taken all profits with good entry as below.
-
Congrats !

Buy signal for EthereumAccording to my free indicator "moving average sequential strat", Ethereum is a buy. Two days ago it fired off a buy signal. If we combine that with the positive price flip of the Fetch Trends, and we have a high probability that the price will go up.
Get both indicators for free, by clicking on my profile.

ETHUSDT LONGHi, guys.
The Ethereum has broken through a major resistance zone.
It's gonna be a great long RBI.

ETH/Ethereum to 1600Got in on a buy position a couple days ago on Ethereum, with the TP being the previous Major supply level at 1600 - TP set a couple pips before.

Ethereum thoughts in hearing.Good morning, colleagues!
I continue to think about this instrument.
Cryptocurrency markets are having a hard time now, but the hardest times are ahead in my opinion. If we start from what I see on the chart, I can say only one thing that this is not the worst, there will be more, but let's not get ahead of ourselves and thank for what we have.
Back to the chart, the price at the approach to the upper part of the trading range shows weakness, which draws weak players into the game and this is a great opportunity to sell the asset at favorable prices.
Based on the fact that in the price range of 1010 - 1100 there is a lot of floating prescription, we can expect the resumption of acquisitions from here, because in order to go to the top we need fuel at the expense of whom we will go.
Thank you for your attention, I wish you success!
P.S.
All key prices are displayed by markers on the price scale...

EthereumHello Traders,
the chart for BINANCE:ETHUSDT is clear. I expect a movement to descending trendline that's acting like a resistance then to drop around 600 $

ETH - Buying StrategyBYBIT:ETHUSDT.P
4H time frame
-
The original resistance zone was broken and turned into a new support zone.
There is a good entry for long if retested 1239~1228.
Also gain great risk to reward ratio with following strategy.
-
Entry: 1228~1239
TP: 1294.5, 1328
SL: 1211

ETHEREUM - 30MIN LONGHave a nice day dear traders. After a short break we are going to trade again
Currently today we will look at Ethereum on the 30 minute chart where if the candle closes above $1219 today we are heavily
longed up to the zone around $1276 I definitely want to look for long positions here, stay tuned today

ETH/USD Critical Breakout Level of 3 Year Structure!Hello Traders,
Haven't made a post in a year since I called the top of the last bull-run (you can see it in the linked ideas).
This post is an alert to anyone watching the macro of crypto. A confluence area of .786 Fibonacci retrace, 2018/2019 all-time high, a year old supply line breakout, and 3 year old support line is where the asset is currently priced.
As of yesterday, we have broken the supply line to the upside.
Now, to me, this does not mean buy immediately, but it does mean we need to monitor the price action for the next month or so. Any confirmation of a breakout whether that be a backtest or a pump may indicate that the bottom is in.
Price target for next ETH bull-run is $7,000 - $12,000+.
Don't believe me? That's okay, who buys crypto going into a telegraphed recession anyways?
This post is for clout so I can flex on my friends two years down the line at the top of the bull cycle 😁
All the best,
dysonring2050

Power of 3 for Ethereum Based on my analysis I think its likely price is pulled towards untouched liquidity in the $1260s
I also can see there could be a power of three in play here.
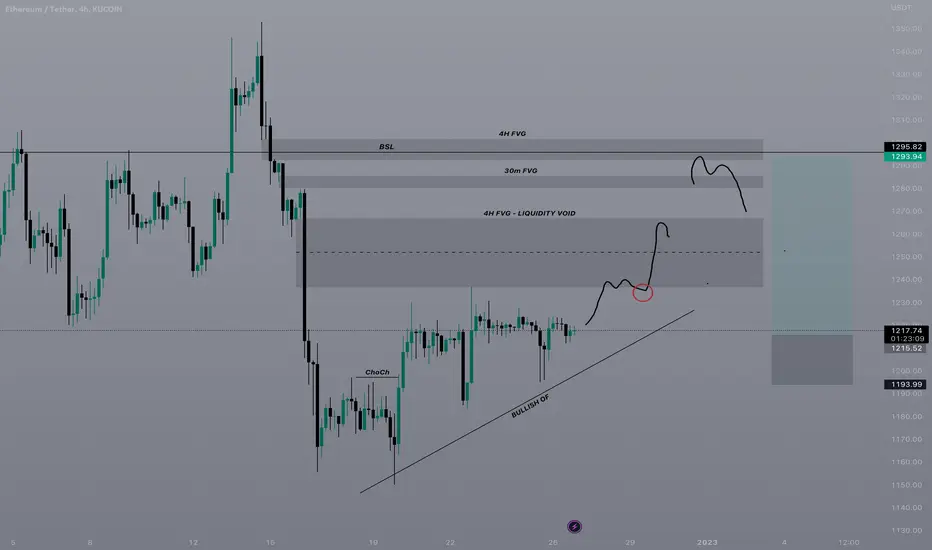
ETH Pump to $1250 LONG I was incorrect with my last idea, I am still new to trading and am still learning new things.
We tested the 4 hour Order Block and rejected it well, with a Change of Character. It is very likely we will change to short term bullish before making any lows.
I think on the higher time frame there is a symmetrical pattern in play and before making and lows or highs we will test the upper end of it.
I am personally trading this with risk management, NFA.

Ethereum LTF Analysis - Pump to $1265-95 Before CapitulationBases on my HTF Analysis and LTF Analysis I reckon we could see a pump up to these levels before making a lower low.
I think this could be a good trade setup with good risk management and sizing.
NFA.
ETH ANALYSIS#ETH UPDATE.
#ETH is currently trading in rising wedge pattern which is generally a bearish pattern .On losing the lower band support we might see eth again testing the blue box support area once again,keep eyes.

ETH/USDTI think ETHUSD first will crash around 600$ and then will pomp strongly.
Tell me what you think.

Eth - intraday tradingDisclaimer: If you think this chart is a mess, you are wrong. Here, we are dealing with lots of fibonacci lines to find confluence at specific zones we want to trade. As we want to maximize our profits, we want to trade at highest possible risk reward ratio. As this is a game of possibilities, our job is to find specific zone with highets probability to make price reaction.
Confluence? Yes, we are looking for that
Fibonaci retreace 170.6%
Fibonacci extension 1.114%
Fibonacci retreace 50%
Yellow trendline
EMA 200 30min timeframe
FVG huge green candle
6 confluences to make a trade. Its never only one thing. 15 min and day is over :)
And if you are asking, is it possible that we miss our trade entry? Yes, many times. But always backtest your strategy and find why did you make a mistake. Your future decisions will be better.
Happy trading :)
Tools:
- Fibonacci retreacement
- Fibonacci extension
- Pitchfork (All types)
- Trend lines
- RSI
- EMA fibonacci numbers
If you take closer look, you can see how price respects the lines. Therefore, if the trade analys is good, we can find a place where the top/bottom of the wick will happen, place an entry buy/sell order and let the magic happen :)

ETH ANALYSIS#ETH UPDATE.
#ETH is currently trading at the resistance area on daily,since eth could not close above the resistance last day we must wait eth to close above the blue box resistance area.On closing above the resistance the next resistance for eth would be pink box area.
