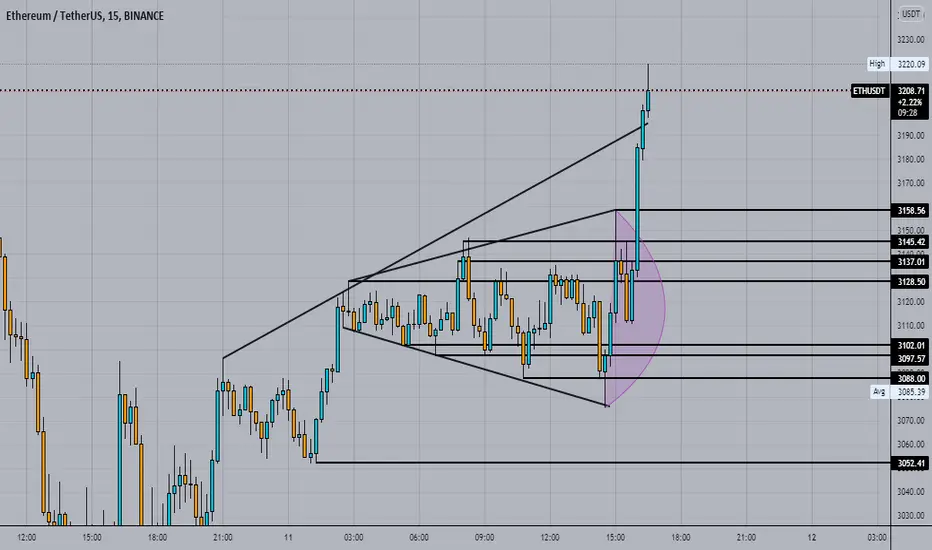
ETHUSDT-LONGBased on technical factors there is a long position in :
ETHUSDT Ethereum
Score 2️⃣
🔵Long Now or set on Key Level 3220.00
🟢Target 1 3400.00
🟢Target 2 3580.00
❌Stop loss 3190.00
#K_Level
Every signal has a score from 1 to 5, so accordingly adjust your risk for each signal. The signals with the score of 5 are the most probable ones.
Please support our activity with your likes and comments.
Ethusdlong

ETH Double BottomDouble Bottom (W) pattern in Ethereum.
ETH is retesting the pattern with bullish flag.

ETH Dump to 2700s (Real Bottom)This fractal is replaying and projecting that we are about to dump down from this W to form the inverse head and shoulders which will actually represent the bottom before the reversal. The 1.618 fib level will predict the bottom which just so happens to be in perfect confluence with the last time we played this pattern out. I'm short from here and will long the quick wick down to the golden pocket just like I did at the bottom of this W

Megaphone pattern ethusdt 15m Chart bullish i Found a Megaphone pattern ETHUSDT 15m Chart
read detail about Megaphone Pattern
A megaphone pattern is a pattern that consists of a minimum of two higher highs and two lower lows. The pattern is generally formed when the market is highly volatile in nature and traders are not confident about the market direction. Normally this pattern is visible when the market is at its top or bottom. The greater the time frame is better the pattern will work.
Megaphone pattern is a pattern that consists of minimum ofo higher highs and two lower lows.
The pattern is generally formed when the market is highly volatile in nature and traders are not confident about the market direction.
Megaphone pattern is known to give multiple trading opportunities to the trader.
This pattern also can be traded when it fails but is necessary to identify the failure perfectly.
Sometimes only pattern is not enough to take best trading decisions you may need multiple indicators to identify better entry and exit points
ETHUSD LONGLooking at BULLISH takeover at major support
Both Daily and Weekly Timeframes confirming.

ETHUSD LONG on bottom outDon't forget to click on the Follow button for more daily detailed analysis, Also if you have any questions, please do ask them!
Here we have our ETHUSD chart.
As of late you will have seen my intraday ETH posts.
After exiting on the long side we are looking to RE long lower down at the current price. This is due to the bottoming out of price and comfortable support on higher TFs.
Exit is noted by the eclipse symbol area.

ETHUSDT Our prediction about ETH
We migh test 3300 again
So i will start buying 10% from now 3780
And my tp is shown here
Or you can wait for 08/01/22
We are long ❤✔

ETHUSD long on fallDon't forget to click on the Follow button for more daily detailed analysis, Also if you have any questions, please do ask them!
Here we have our updated ETHUSD chart.
Recently we have seen a hard and fast fall. We are now long looking for intraday gains.
Prices across the board on cryptocurrencies have been smashed and they are Great for longs.. we want to buy when price is LOW and get out on moves up.
Exit at eclipse symbol.

ETH dip and RE longGood evening Morning and Afternoon Traders..
Here we have our ETHUSD chart. we are looking long on this asset for an intraday trade early this coming week..
On the recent rally we are looking for a pullback before we go long again.
Price target is noted by the eclipse symbols to the long side.

ETHUSDT, We should buy in these zoneHello everybody
According to the chart and previous analysis, the trend of the movement price is upward and we are in correction but the market do the trader bored and this is exactly the market maker want to happen that the trader sell the portfolio of the coin and get out of the market.
Be consicious guys dont sell your asset in these price and hold it the market can change this bored trend to attractive.
The all of the market it depends to the Federal Reserve decision for the rate and after that they tell us what gonna do we can decision and market will do the exactly right way.
In here we shown 2 buy zone area that the price can come and reach to them and after that it can be ready to move upwards from these zone.
You can buy step by step in these zone and be careful guys dont panic sell and the important point is if the price break the key point level powerfully and can close candle below this level we should be worry that time because the trend can change to the downward and this one its not good for the market until there time everything is okey and there is no need to worry.
Good Luck
Abtin
Previous analysis :

Potential Bottom for ETHSo we have this major upsloping trendline that lines up perfectly and has played significant support/resistance in the past and on top of that we're right in the golden pocket if you pull the fib from ATH to 0. Also there's a bullish divergence on the 3 hour on Market Cipher B which is usually a pretty good sign that we're hitting bottom. We may only end up going back up to form the right shoulder of what looks to be a gigantic head and shoulders that's forming but it's possible that we just keep on going. We'll see what happens. I'm opening significant long positions from the bottom of this golden pocket

Ethereum (ETHUSDT) | good area to climb📍Hello traders, Ethereum in daily timeframe , this analysis has been prepared in daily timeframe but has been published for a better view in 2 day timeframe.
Based on the number of waves we had, the main waves 1 and 2 are certainly over, and in the case of wave 3, I must say that it is complete in our opinion.
Let's look at wave 4:
We see wave 4 starting, because wave 3 is in a good position compared to wave 1, and also the price has broken the orange trend line downwards, giving us confirmation for the start of wave 4.
Structurally, wave 4 will not have much depth compared to wave 2, and in terms of time it is too long or too short.
For this reason, we consider the correction of a triangle and from this correction a wave is being formed.
From wave a, we assume that the microwaves a and b are completed and we are now inside wave c, and when the range 3750 is broken down, we will be sure of the beginning of this wave, and we will consider its target as the motion of wave a.
This move took place and the descent formed and now we are waiting for the ascent for wave b.
But if the Fibonacci 0.38 is broken downwards, the movement will continue until the Fibonacci 0.50, which is abnormal in our opinion.
So we give the probability of climbing from this discomfort to around 3900.
Our view is that if the warning range (4500) is broken, the field is analyzed and these waves are part of the 3 main wave.
🙏If you have an idea that helps me provide a better analysis, I will be happy to write in the comments🙏
❤️Please, support this idea with a like and comment!❤️

ETHUSD intraday longdon't forget to click on the follow button for more daily detailed analysis. Please do also ask any questions should you have them,
Here we have our 1H ETHUSD chart.
We are looking long to close out the week.
PA is nice around this area. Looking for gains slightly higher up. EXIT at eclipse symbol.

ETHNot financial advice.
The essence of investing & trading is the intelligent and patient preying on the greed, fear, impatience, addiction and ignorance of the majority. It's definitionally Darwinian.

ETHUSD long PlanAfter the Recent Fall on ETH we are looking long.
Price is low and is looking very much more attractive. we are at Comfortable support on higher TFS and are looking for an intraday move.
Remember, as you will have seen HVA's can move fast which is why it is imperative your risk management is correct. Do not have huge positions. Trade small and trade consistently that is how you make PROFIT.

ETHNot financial advice.
The essence of investing & trading is the intelligent and patient preying on the greed, fear, impatience, addiction and ignorance of the majority. It's definitionally Darwinian.

Dump over? Eth bounce soon?Eth has fallen into major support and almost into the golden pocket of the current trends fibonacci. It may take a week or 3 but I think this is the bounce zone. There may be a wick or two lower but fear is so high (15 currently) I don't think we will spend too much longer here.
Maybe I'm a stupid contrarian or maybe we're establishing higher lows before the next leg in the bull run. Extending cycles, diminishing returns - yes. Bear - no. This kind of extreme fear just makes me more bullish, the FED scared the markets but it won't last forever because the FED isn't ready to give up their profit creation machine of buying debt through one door and selling it through another, they will continue to buy assets and "tapering" will continue to be as scary and unreal as big foot. When sh*t hits the fan we will not be asking "is this a bear market?" - we will know for sure. At least, that's what I believe.
My strategy is simple, buy fear, sell greed. There's more to it but that's it's most simplified form. When the whole world is calling for a market crash and saying "crypto is ded", I think - "not yet" and look for buying opportunities. There's no question that the markets are beyond inflated and the system is beyond screwed but remember "the market can stay irrational longer than you can stay solvent". We're probably not Micheal Burry, able to hold tesla shorts from 730 without concern.
We have to trade the market we have and currently the market is a crazy circus and dumpster fire at times but it's the market we know and love lol. I say all this because I don't want you to see my long theories and think I'm ODed on hopium. I know sh*t is messed up and getting crazier BUT its NOT over.
I believe we'll be rallying by the end of the month in crypto and maybe sooner in the stock market. I put Astro before my name because I study astrology too in conjunction with TA. We're currently in a Venus retrograde period that seems to be really causing a lot of fear, tension and feelings of despair and hopelessness in people and thus the market. She goes direct at the end of the month (the 29th) and will spend weeks conjoined to mars as they move through Capricorn (a sign connected with big business, gov'ts, institutions, banks etc). On the 18th there's a full moon in cancer opposite the planet Pluto (still a planet to me ❤️🩹). I think there could be some major dramatic world events like revolts breaking out in some countries (like is happening in Kazakstan now), possibly some corruption coming to the light between businesses and governments or any number of things that might piss people off on both a micro and macro scale. Its obvious people are getting more and more fed up with the system and the powers that be and THIS will push people INTO the markets.
That combined with the FED being concerned about inflation are ironically BULLISH. The gap between rich and poor will continue to be made greater and greater until a large mass of people stand up against it. I don't think we're at that point yet, we're at the point where people want to take matters into their own hands to bring MORE security. Inflation is robbing savers and many of them are realizing that's true, looking into investing and trying to learn. Crypto is hot and trendy and ETH has the network effect.
I do think the rest of this month could be hard and or boring but we're headed into a bounce IMO. The geo-political landscape is pushing people to figure out alternatives and still less than 5% of the world owns crypto. This is a bit of a rant and I apologize for that but the uptrend has not been broken for eth or the asset class as a whole. As long as the stock market keeps going up, so will crypto. Maybe someday crypto will deviate from the stock market but that's a thought for another time and may never happen. The FED does this same thing where they say they will taper, the markets freak out and they buy the freaking dip. I bet the FED is eating this up and of course it's affecting crypto too because it's the most emotionally volatile asset class.
So when I see 15 on the fear and greed index as ETH falls into it's golden pocket - I get bullish as hell
stay safe and frosty fellow traders and travelers ✌🏻 don't let the man get you 👁

ETHUSD dip and long..Don't forget to click on the follow button for more daily detailed analysis. Also, should you have any questions please do ask them,
Here we have our ETHUSD chart.
We are looking long after a small dip on the SMALLER TF's. This is to get our entry right.
Price action is a great thing when used correctly..
Exit at the eclipse symbol price zone.

Ethereum: Intraday Dip BuyingEthereum - Intraday - We look to Buy at 3712 (stop at 3636.0)
We look to buy dips. Previous support located at 3700. Intraday signals are mildly bullish. Previous support at 3900 now becomes resistance. Further upside is expected although we prefer to set longs at our bespoke support levels at 3700, resulting in improved risk/reward.
Our profit targets will be 3898 and 4090
Resistance: 3900 / 4000 / 4100
Support: 3700 / 3600 / 3500
Disclaimer – Saxo Bank Group. Please be reminded – you alone are responsible for your trading – both gains and losses. There is a very high degree of risk involved in trading. The technical analysis, like any and all indicators, strategies, columns, articles and other features accessible on/though this site (including those from Signal Centre) are for informational purposes only and should not be construed as investment advice by you. Such technical analysis are believed to be obtained from sources believed to be reliable, but not warrant their respective completeness or accuracy, or warrant any results from the use of the information. Your use of the technical analysis, as would also your use of any and all mentioned indicators, strategies, columns, articles and all other features, is entirely at your own risk and it is your sole responsibility to evaluate the accuracy, completeness and usefulness (including suitability) of the information. You should assess the risk of any trade with your financial adviser and make your own independent decision(s) regarding any tradable products which may be the subject matter of the technical analysis or any of the said indicators, strategies, columns, articles and all other features.
Please also be reminded that if despite the above, any of the said technical analysis (or any of the said indicators, strategies, columns, articles and other features accessible on/through this site) is found to be advisory or a recommendation; and not merely informational in nature, the same is in any event provided with the intention of being for general circulation and availability only. As such it is not intended to and does not form part of any offer or recommendation directed at you specifically, or have any regard to the investment objectives, financial situation or needs of yourself or any other specific person. Before committing to a trade or investment therefore, please seek advice from a financial or other professional adviser regarding the suitability of the product for you and (where available) read the relevant product offer/description documents, including the risk disclosures. If you do not wish to seek such financial advice, please still exercise your mind and consider carefully whether the product is suitable for you because you alone remain responsible for your trading – both gains and losses.

ETH Buy at 0.618 retracement.Ethereum - Intraday - We look to Buy at 3661 (stop at 3574)
Daily signals are mildly bullish.
We have a 61.8% Fibonacci pullback level of 3660 from 1706 to 4868.
Buying continued from the 61.8% pullback level of 3660.
Dips continue to attract buyers.
We look to buy dips.
Our profit targets will be 3897 and 3947
Resistance: 3900 / 4000 / 4100
Support: 3760 / 3700 / 3660

Ethereum buy the trend of higher lows.Ethereum - Intraday - We look to Buy at 3861 (stop at 3779)
Daily signals are mildly bullish.
The trend of higher lows is located at 3850.
Dips continue to attract buyers.
We look to buy dips.
Our profit targets will be 4088 and 4148
Resistance: 4080 / 4120 / 4180
Support: 4000 / 3900 / 3800

ETH - I love how it looks right nowShort term ETH looks like it is ready for some upwards movement. At least for some short squeeze or dead cat bounce before another drop (in correlation with BTC dump, if it occur ofcourse).
- back to trendline (dotted trendline untouched since breakout) ✅
- oversold condition on Stoch RSI on 3D & W chart ✅
- back above RSI trendline ✅
- big wicks on W chart for every drop ✅

ETH/USD: Climb Higher Could Spark Risky Speculative WagersETH/USD is trading slightly above the 3800.00 mark as of this writing. In yesterday’s trading, ETH/USD stumbled to nearly the 3715.00 level, before it sparked a reversal higher. However, ETH/USD remains within the lower realms of its one-month range and is still below mid-December trading realms. As the New Year begins its markets trading, speculators will have a difficult technical question to answer regarding their perceptions.
The broad cryptocurrency market remains under pressure when looking at the past week of results. Cryptocurrency is not affected by closures of markets like many financial assets. Speculative wagers continued, and weekend trading has certainly affected Ethereum along with its major counterparts. ETH/USD is in the midst of a rather intriguing value and, if support is challenged below, it could spark nervous sentiment.
The 3800.00 may be thought of as a fake psychological barrier by some technical traders, but if ETH/USD once again falls below this depth it could be a bearish signal. From the 29th of December until yesterday, ETH/USD continued to trade below the 3800.00 in a sustained manner. If the current price shows weakness again, traders may perceive yesterday’s late reversal higher as a temporary move upwards, while suspecting additional selling may be demonstrated.
The level of 3775.00 should be watched by traders. Some aggressive sellers may decide this ratio is take profit vicinity if they are shorting ETH/USD, but to do that they would need to be using a conservative amount of leverage to make sure that trading moves in the wrong direction short term does not knock them out of the game. Resistance levels above around the 3840.00 to 3850.00 levels could prove to be difficult for ETH/USD to penetrate. And until ETH/USD moves above the 3900.00 level and maintains value above this juncture, the cryptocurrency could be perceived as remaining within a bearish mode.
Speculators should be careful with ETH/USD as the potential for additional volume creeps into the market, if institutional traders do decide to get involved. Stop loss and take profit ratios should be considered wisely, because volatility may grow near term. The broad cryptocurrency market continues to display signs of selling pressure and ETH/USD has not escaped this shadow. Traders should not be overly ambitious and if their wagers are profitable, cashing in winning positions would likely be a good decision if they are produced.
Ethereum Short-Term Outlook
Current Resistance: 3847.00
Current Support: 3774.00
High Target: 3910.00
Low Target: 3694.00
