ETHUSD moving upDon't forget to click on the follow button for more daily detailed analysis and Please ask any questions should you have them!
Here we have our ETHUSD chart.
WE looked long previously and escaped at our targets. We are still looking long with further room to go.
Alike to BTC market sentiment is reasonable and will help move our trades.
Use correct RM on HVA's they can move FAST.
Ethusdlong

ETHUSD to riseDon't forget to click on the follow button and ask any questions should you have them!
Alike to BTC we are looking long after last night's fall. This is because price fell to KEY technical zones. We like trade in line with markets.. This means getting IN when prices are low enough..
Times like these create great opportunity to join the NEW trend.
Price direction is noted by directional arrows.

ETHUSD: Don't Miss the Impulse 🚀If we can breach this main supply we could have a strong run-up towards the seller stops.
Price has done what it needed to trap and create liquidity.
Do you think this bull run has potential? 🐂
Traders, if you have your own opinion about this idea, write in the comments section, I always reply. 💬
🚨 RISK DISCLAIMER:
Trading Crypto, Futures, Forex, CFDs, and Stocks involves a risk of loss.
Please consider carefully if such trading is appropriate for you.
Past performance is not indicative of future results.
Always limit your leverage and use a tight stop loss.
--------------------------------------------------------------------------------------------------------
Please like, subscribe, and share this idea with others! ⬇️
--------------------------------------------------------------------------------------------------------

ETH STILL WITHIN BULLISH CHANNELEthereum has not broken its trend. Price action is still within the Ascending Triangle channel. Chart shows a healthy sign for a reversal back upward if support holds.

ETHThere is divergence and the price is on the important area, another thing is ETHBTC had completely pullback, i show you ETHBTC in the my next analysis. another important thing is the
dark blue line on the top is the most important line for ETH and be careful about that

ETH/USD: The Corrective Move reacher an Interesting Level!Hello, everybody, and welcome to my TradingView’s profile, my name is Gianni and today I’m going to analyse the ETH/USD , translating the market information by using a full technical analysis on different time frames, giving you a personal opinion about the next most likely market movement and helping you to spot and manage market opportunities.
My ideas are for those who are interested in improving their financial education and for those who are looking for new trading opportunities, according with their own strategies.
Daily timeframe:
4 hours timeframe:
The market is currently in a corrective move and reached an interesting key level just around the 0.50/0.61% of Fibonacci retracement.
The corrective move formed a clear descending channel with a trading activity balanced between the higher and lower value of the channel, usually a sign the trend is not really strong.
A future price action on the higher value would give us a good possibility or trend change to the upside.
When, where and why would I step into the market?
Before entering the market, I would be sure that the price will completely leave the current descending channel, changing its perspective from bearish to bullish.
At the moment I will not take any action on this market but I will definitely keep an eye on it.
However, the market could still continue its movement to the downside for a while, keeping the price inside the channel. This scenario would invalidate this trade idea.
If you enjoy this trade idea, please support my work with a thumb up and don’t forget to follow my profile for more detailed market analyses!
Trade safe and responsibly,
Gianni
DISCLAIMER
Please note the views are not investment advice and should be used only for educational purpose

ETH going LongDon't forget to click on the follow button and ask any Qs should you have them!
Here we have our ETHUSD chart..
we are looking long at some reasonable support and confluence with our MA's and other TECHs.
This trade is likely to be INTRADAY.
Exit is noted by our Directional arrow.

ETHUSD Still on Track for 8 - 15K FinishUsing this cool indicator we can see the comparable points to the prior bull run ETH
We are nearly at this cycles top
Bars pattern is placed just to show potential price movement in future

ETHUSD to riseDon't forget to click on the follow button for more daily detailed analysis.
On the recent fall we are looking LONG on ETHUSD. There is good room for an intraday long.
Price target is noted.

ETHUSD - Long Trade Idea - to 4030.60ETHUSD, 15m Buy
Entry - 3830.60
Stop Loss - 3800.60 (30 pips)
Take Profit - 4030.60 (200 pips)

ETH Turning PointBased on Market Cipher B on the weekly and the fact that we tapped the golden pocket down here and we held this bottom trendline, it appears to me that we have found bottom. Both the VWOP and the RSI on Market Cipher have started hooking upwards with this new weekly candle and things are starting to look up again. Our last confirmation will be the coveted green dot, however I wouldn't wait for it to put a long in or you'll probably miss a lot of the move. I have limit orders set all the way down into the 3600s to back up my long position in case we do happen to find some more downwards movement, however I expect this area to ultimately hold as our next local bottom/beginning of the next impulsive wave upwards

ETH/USD: Starting a new channel! Hello, everybody, and welcome to my TradingView’s profile, my name is Gianni and today I’m going to analyse the ETH/USD , translating the market information by using a full technical analysis on different time frames, giving you a personal opinion about the next most likely market movement and helping you to spot and manage market opportunities.
My ideas are for those who are interested in improving their financial education and for those who are looking for new trading opportunities, according with their own strategies.
Monthly timeframe:
Weekly timeframe:
Daily timeframe:
4 hours timeframe:
The market left the previous channel and it seems it’s starting moving inside a new ascending channel.
The chart is clearly showing the main trading activity on the higher value of the channel, typical during an uptrend, so there are good probabilities to see a trend continuation to the upside.
When, where and why would I step into the market?
Before entering with a long position on this trade, I would patiently wait the price going back to the lower value of the channel, getting a confirmation as a rejection on the dynamic trendline.
A strong rejection, would be a clue of good demand on that level, and I will be looking then for a good entry point with a RRR of 1:2 or greater.
My SL would be just below the potential low on the bottom of the channel and I will manually deal with my TP with a target just around the higher line of the channel.
If you enjoy this trade idea, please support my work with a thumb up and don’t forget to follow my profile for more detailed market analyses!
Trade safe and responsibly,
Gianni
DISCLAIMER
Please note the views are not investment advice and should be used only for educational purpose

Eth , Altscoin Leader .On my vision ,
Eth still have one leg up .
5th wave targeting ATH As shown on chart
SL : 3470$

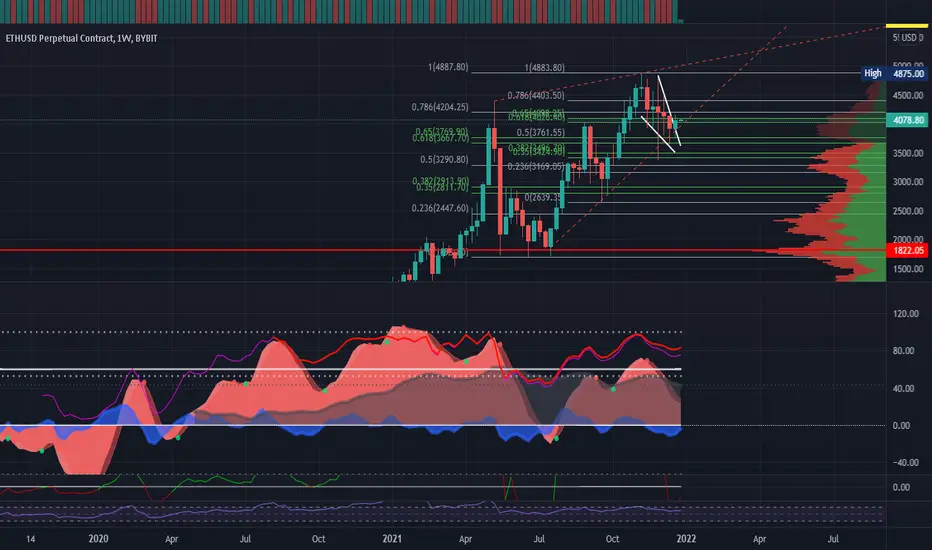
ETHUSD Bullish FlagETHUSD is creating a bullish flag which should push price toward $4225 zone.
I am not a financial advisor. This is not financial advice. This is for educational purposes only.

ETHUSD to go longDon't forget to click on the follow button for more daily detailed analysis. Also, should you have any questions, please do ask them!
Similarly to BTC we are looking for an intraday fall so we can go Long at some great support + Key MA’s.
Alike to our BTC chart if you want a good price with lower risk.. Wait a little and lower your trade size.
Make sure your RM is correct when dealing with HVA’s or it can get nasty.. This means you do not HAVE to buy/sell everything all at once.
Price direction is shown by our arrows.

ETHEREUM LONGS into ATH'S📉📉📉Expect bullish price action above ATH's as price has a lot of liquidity to take out, if we consolidate with bullish candlestick momentum above 4000$ than this means we go for ATH's if not i will switch my bias.
What do you think ? Comment below..

ETHUSD - Long Trade Idea - go to 4200ETHUSD, 15m Buy
Entry - 4020.00
Stop Loss - 3990.00 (30 pips)
Take Profit - 4200.00 (180 pips)

ETHUSD-BUY strategyWe have been ranging, and if one studies the GANN support and we are positive stochastic, the risk reward for buying is better.
Buy current $ 3,920 for a move to $ 4,250. with a stop-loss $ 3,800 below.

Eth and the 8kBeautiful weekly setup. It's time for eth to go to 8k.
GO WISE!
Both awesome coins. BINANCE:ETHUSDT

Long $ETHUSD based on Elliott Wave TheoryHello, friends! I would like to briefly talk to you regarding Elliott Wave Theory and how we can use it to our advantage.
Brief history and intro:
Ralph Nelson Elliott concluded that the movement of the market could be predicted by observing and identifying a repetitive pattern of waves. Elliott first published his theory in the book titled The Wave Principle in 1938. Elliott was able to analyze markets in greater depth, identifying the specific characteristics of wave patterns and making detailed market predictions based on the patterns.
Basic Principles Elliott Wave Theory:
Movement in the direction of the trend is unfolding in 5 waves (called motive wave) while any correction against the trend is in three waves (called corrective wave). The movement in the direction of the trend is labeled as 1, 2, 3, 4, and 5. The three-wave correction is labeled as a, b, and c. These patterns can be seen in long-term as well as short-term charts.
An example:
Elliott Waves are like a piece of broccoli, where the smaller piece, if broken off from the bigger piece, does, in fact, look like the big piece.
Market prices alternate between an impulsive, or motive phase, and a corrective phase on all time scales of trend. Impulses are always subdivided into a set of 5 lower-degree waves, alternating again between motive and corrective character, so that waves 1, 3, and 5 are impulses, and waves 2 and 4 are smaller retraces of waves 1 and 3. Corrective waves subdivide into 3 smaller-degree waves, denoted as ABC. Corrective waves start with a five-wave counter-trend impulse (wave A), a retrace (wave B), and another impulse (wave C). The 3 waves A, B, and C make up a larger degree corrective wave (2). An impulse-wave formation, followed by a corrective wave, forms an Elliott wave degree consisting of trends and countertrends. In a bear market, the dominant trend is downward, so the pattern is reversed—five waves down and three up.
Elliott identified nine degrees of waves, which he labeled as follows, from largest to smallest:
-Grand Super Cycle
-Super Cycle
-Cycle
-Primary
-Intermediate
-Minor
-Minute
-Minuette
-Sub-Minuette
Since Elliott waves are fractal, wave degrees theoretically expand ever-larger and ever-smaller beyond those listed above. Simply because the market is a fractal does not make the market easily predictable. Scientists recognize a tree as a fractal, but that doesn’t mean anyone can predict the path of each of its branches.
Now that being said we can conclude that ETH has completed supercycle and intermediate wave 2. The next wave will be wave 3.
Wave 3 must be an impulse wave, cannot be the shortest of 1,3 & 5. Wave three is usually the largest and most powerful wave in a trend. Prices rise quickly, corrections are short-lived and shallow.
Wave 3 rally picks up steam and takes the top of Wave 1. As soon as the Wave 1 high is exceeded, the stops are taken out.
Keep top resistances in mind.
This is not financial advice, always do your own research before investing in any stocks or cryptocurrencies.

ETHUSD turning longFor more daily detailed analysis, don’t forget to click on the follow button. Also, please ask any questions you may have and I will be happy to answer them.
Similarly to BTC we are looking for an intraday fall so we can go Long at some great support + Key MA’s. This is important as an aspect in getting a good entry. Price points must have exactly that.. a point!
Use correct RM when dealing with HVA assets. This is important because you can have larger swings than regular assets you are trading.

ETHUSDETHUSD seems to have reached the bottom of the uptrend. If the day does not close below 3700, it will continue to rise. The RSI is in the direction of the daily bearish breakout. Closing above 4200 usd brings 5800usd. Bulky buy-side positions pave the way for the uptrend.
