Ethereum Price Remains Drab Under $3,000 Risking Major Dip
Ethereum aggressively fights to step above $3,000 a cloud of doubt reigns at its ability to overcome congestion at $3,200.
A dwindling on-chain activity is a bearish sign for Ethereum, implying that bulls may not have the power to sustain an uptrend.
Ethereum bulls have been pushing for action above $3,000, but all attempts made toward $3,200 have resulted in futility. The flagship smart contracts cryptocurrency token had retreated to a September low of $2,650 more than a week, but collectively, little progress has been made since then.
Meanwhile, some selected altcoins seem to be ignoring the mundane price action across the crypto market. Binance Coin leads the recovery in the top ten with an 11.6% gain over the last 24 hours, with Avalanche coming second with a 6.1% upswing. The market is mixed red and green across the board, whereby bulls will likely emerge intraday winners throughout the trading on Thursday.
Ethereum Could Fallback Before Heading For A Significant Swing To $4,000
The gigantic smart contract token is experiencing a lot of trouble gaining traction above $3,000. Although the short-term technical outlook appears ripe for a breakout above this level, it is not guaranteed that Ether will make it past $3,200 and sustain an uptrend at least to the supply zone in red around $3,600.
According to the 12-hour chart, Ethereum is locked within the confines of a descending parallel channel. Its key downside is supported by the 200 Simple Moving Average (SMA), which rests in the demand zone highlighted in green. The channels’ middle boundary also contributes to securing this anchor zone.
A break above the upper boundary would boost Ether above the $3,000, but the token needs to push past $3,200 to affirm the uptrend to $3,600. However, the 50 SMA has recently crossed below the 100 SMA; an index considered bearish despite not being as strong as a death cross pattern. The last time this technical outlook occurred was on June 4, and Ether subsequently dropped by 41%. Hence the magnitude of its effect on the price cannot be overemphasized.
Meanwhile, Ethereum’s on-chain activity has been dwindling over the last 30 days, and this is taking a toll on the price performance. Data by Santiment shows the network growth at roughly 80,000 new addresses per day, down from a 30-day high of nearly 110,000.
Suppose this metric continues to drop in the coming days, investors should anticipate a difficult recovery phase and perhaps the possibility of Ether sinking to $2,400, where it is likely to be attractive to more bulls.
Ethereum Key Intraday Levels
Spot rate:
Trend: Short-term bullish bias
Volatility: Low
Support: The 200 SMA and $2,650
Resistance: $3,200 and $3,600
Ethusdlong

ETH / Whole Market BreakoutETH is about to take off to the upside along with the rest of the market in order to complete this smaller inverse head & shoulders and an ugly cup and handle on the more macro scale. The overall target would put us somewhere around $7k. We will blast through current all-time highs and make our blow-off top for the cycle. I've been predicting this move & pattern for a long time now but now it's actually coming to life! Check out the monster bullish divergence on the 6 hour and 8 hour - on such high time frames it becomes extremely obvious that a large move is imminent

ETH is trying to get back on trackETH is currently very difficult to analyze, the market shows a lot of volatility and the trend can change very quickly, but there is nothing to worry about because for LONG, ETH is still a great investment

ETH Bullish 📈Ethereum is currently trading within the range seen in the bottom and top white lines, which are the support and resistance.
We also have an uptrend as seen per the blue line indicating a sort of ascending triangle.
In most cases ascending triangles are bullish, however for us we still need to come down to the support to confirm it as a proper support.
Once we do we should bounce and go back to the resistance.

ETH Buy a break setup.Ethereum - Intraday - We look to Buy a break of 3181 (stop at 3088)
Daily signals are bullish.
Pivot resistance is at 3175.
A break of 3180 is needed to confirm follow through bullish momentum.
The bias is to break to the upside.
Prices have reacted from 2650.
Our profit targets will be 3448 and 3498
Resistance: 3100 / 3180 / 3300
Support: 3050 / 3000 / 2950

ETH/USD Falling Wedge BreakoutWe had a nice break from this falling wedge and we are forming a pretty large W / potential inverse head and shoulders. Indicators are looking pumpy and we already got a pump from the macro golden pocket down around $2750 (exactly as I had predicted, by the way). Short term target is $3,680ish


Cleaner ETH Chart - Ready for TakeoffSeeing big Bullish divergence/green trigger waves printing even on the 6 hour. Expecting that we W out of this dump and head way back up

ETH USD Trigger Wave TakeoffBullish divergence and perfect trigger waves printing on all higher time frames. We're about to see a whole lot of green

ETHUSD buy setup for longplace a buy limit order on 2850 and 2nd entry 2775 with a stop loss of 2720,
take profit 1 2950, take profit 2 3025,
good luck all
use 3% fund max for long call

Eth may be moon right nowafter 2 day price bitcoin price is dropping. Today, we can see how eth is bounce from the support. on top of that, eth still need to break above 3300 in other to be moon. It can be in consolidation and start growing slowly from here. however, if bitcoin still above 30,000. Then, eth will still at up trend.

ETH Needs This Crucial Level Ahead Of Approach To $4,000
Ethereum is doddering at $3,100 after failing to break the resistance at $3,200.
The MACD may call more buyers into the market if Ether confirms a break above $3,200, a move that could bolster ETH toward $4,000.
Ethereum moved with its peers on Thursday and managed to reclaim the ground above $3,000. As reported earlier this week, the prominent smart contracts token had plunged to $2,650 amid a highly volatile cryptocurrency market. Ether also extended the bullish leg above $3,100 but stopped before brushing shoulders with $3,200.
Bitcoin has also been lethargic in its recovery after testing support at $40,000 this week. The largest cryptocurrency closed the gap to $44,000 but is yet to confirm a breakout above $45,000.
Ethereum Must Close Above $3,200 To Validate Upswing To $4,000
The resistance at $3,200 has been a daunting task for the bulls, resulting in a correction toward $3,000. Meanwhile, Ether is teetering at $3,100 at writing as bulls fight to shake off the engulfing selling pressure.
Bulls must confirm a break above $3,200 to add credibility to the optimistic narrative eyeing $4,000. Realize that the 50-day Simple Moving Average (SMA) could make it difficult for buyers to achieve their goals quickly. Moreover, the supply zone in red will also hinder ETH from breaking through and lead to another round of losses.
The daily chart reveals that the Moving Average Convergence Divergence (MACD) has wallowed in bearish signals since September 7. This technical index afforms the general lethargic picture as it stays in the negative region under the mean line.
Traders should lookout for a buy signal in the coming session or days to ascertain the validity of the uptrend. All the sake, trading above $3,200 would hasten the occurrence of the bullish call.
On the downside, overhead pressure will soar if Ethereum losses support at $3,000. Investors are likely to sell in masses amid panic that the demand in green could give in to the pressure this time around. It is worth mentioning that the 100-day SMA has cemented the buyer congestion zone while the 200-day SMA currently holds at $2,612.
Ethereum Intraday Levels
Spot rate: 3,098
Trend: Bearish bias
Volatility: Low
Support: $3,000 and $2,650
Resistance: $3,200 and $3,600

ETH/USDT long trade set upAs per chart analysis of ETH/USDT, you can take a long entry at $ 3088.40. Exit point & SL also mentioned in the chart. But at first do your own research.

ETHUSD IdeaG'day, The Next Crypto Millionaire
Today I am gonna analyse ETHUSD (Ethereum).
Based on current market conditions, its clearly showing that an uptrend rally formed after completing the correction market structure. The yellow box I personally, considered as a Critical zone for market direction confirmations, either price actions direction will be fulfilled.
For now, I am expecting price heading for swap zone/supply zone before big traders conducting profit-taking. This is normally happening for day traders taking profit on every position, pushing the price for consolidations structure before continuing rally by targeting previous high.
From a fundamental perspective, I am expecting ETHUSD to reach the $5000/ETH price tag. This prediction is based on upcoming ETH 2.0 blockchains implementations to reduce the transaction fee which is also known as Gas Fee / Network Fee. Which is currently, too expensive for traders specially Staker Investor.
Let's see what gonna happens next. Stay Tune...

eth update : What's next ?Hi friends ,
eth broke the resistance we need now to break the trend as a confirmation to go long .
best level to buy now : 3000$ / 29009 / 2800$ or after we break the trend line .
what do you think about that ?

ETHUSD // 2600&2700
Expected to 2600/2700
Burada yer alan yatırım bilgi, yorum vs. yatırım danışmanlığı kapsamında değildir. Burada yer alan ve hiçbir şekilde yönlendirici nitelikte olmayan içerik, yorum ve tavsiyeler ise genel niteliktedir. Burada yer alan bilgilere dayanılarak yatırım kararı verilmesi beklentilerinize uygun sonuçlar doğurmayabilir.

ETHUSD Growth LocationWe can be seen to entering the best possible entry territory for ETHUSD (green circle)
This is second to the entry at the aqua circle
We sell when Ethereum enters the overbought zone in the red
This leaves the price at around ~8000USD
Similarities can also be seen on the MACD, with two peaks

ETH (LONG)ETH reversed from Fibonacci Golden Ratio (61.8%) and will increase if break the specified resistance zone
ETH Slides To $2,650 For The First Time Since Early August
Ethereum shakes off weak hands from the market following the freefall to $2,650.
The 100-day SMA plays a crucial role, ensuring that ETH does not extend the bearish leg to $2,400.
The cryptocurrency market is experiencing a downtrend run amid heightened volatility. Investors have been cautiously bullish, especially with the stock market bleeding in the wake of Evergrade’s, a Chinese property behemoth saga.
Ethereum continues with its bearish stretch from the previous week, where it was rejected at $3,679 (data from Coinbase). Most enthusiasts and crypto analysts pointed to $3,000 as the ultimate support. However, over the last 24 hours, Ether made its way to $2,650, levels not seen since early August.
Where Is Ethereum Price Headed?
The gigantic smart contract token is trading at $2,875 on Wednesday and toward the end of the Asian session. Overhead pressure shot up significantly after Ether lost the support at the red zone on the daily chart.
Nonetheless, the 100-day Simple Moving Average (SMA) came in handy, preventing bears from doing more damage. With this support in place, Ethereum has started looking toward recovery above $3,000.
It is worth mentioning that if recovery to $3,000 fails, bears may attempt another takeover, this time targeting the green zone near $2,400. The 200-day SMA will also be in line to provide Ethereum with cushioning.
The second-largest cryptocurrency would likely dance between the red and the green zones in the coming sessions. Traders can watch out for action past the 50-day SMA to ascertain the validity of the uptrend to $3,600 and later to $4,000.
According to the Relative Strength Index (RSI), buyers are gradually regaining control. The uptrend’s strength will soar as the RSI lifts toward the midline and the overbought area.
On the downside, holding above the green zone is particularly crucial for Ethereum because immense sell orders could be triggered as panic selling grips investors. If it fails to hold, we can expect ETH to make a comeback at $2,000.
Ethereum Intraday Levels
Spot rate: $2,868
Trend: Minor bullish bias
Volatility: Low
Support: The 100-day SMA and $2,400
Resistance: $$3,200 and the 50-day SMA

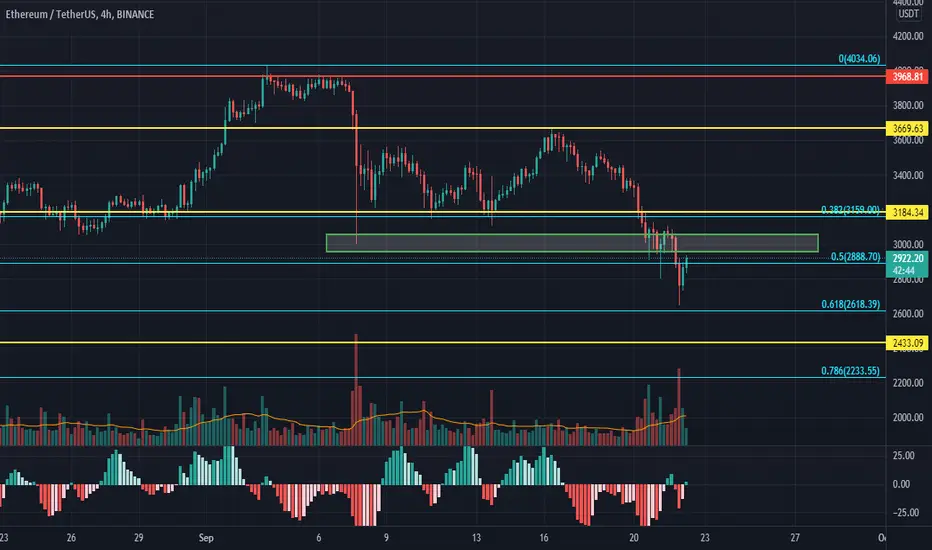
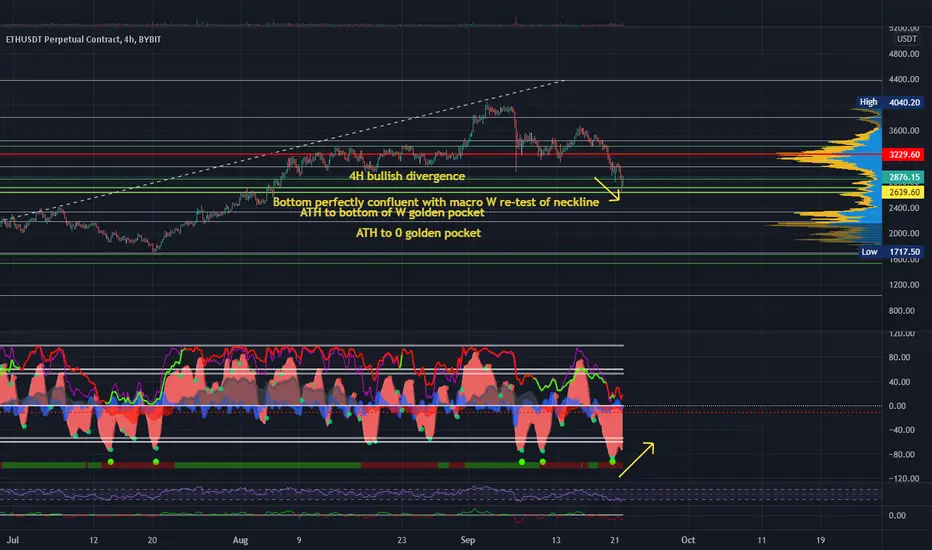
ETH/USD & Whole Crypto Market BlastoffHere are 4 or 5 good reasons why I believe we are about to blast off and this dip was to form the "handle" on an ugly looking cup and handle. We bottomed out perfectly at the neckline of the macro W, flawless re-test. That also happens to be the 0.382 golden pocket if you pull a fib from the ATH to the bottom of the W, as well as the 0.682 golden pocket if you pull the fib from the ATH to 0. On top of that we are seeing massive bullish divergences on large time frames, even the 6 hour is showing bullish divergence right now which is super powerful. Call me a moonboy but I'm expecting a huge pump from here
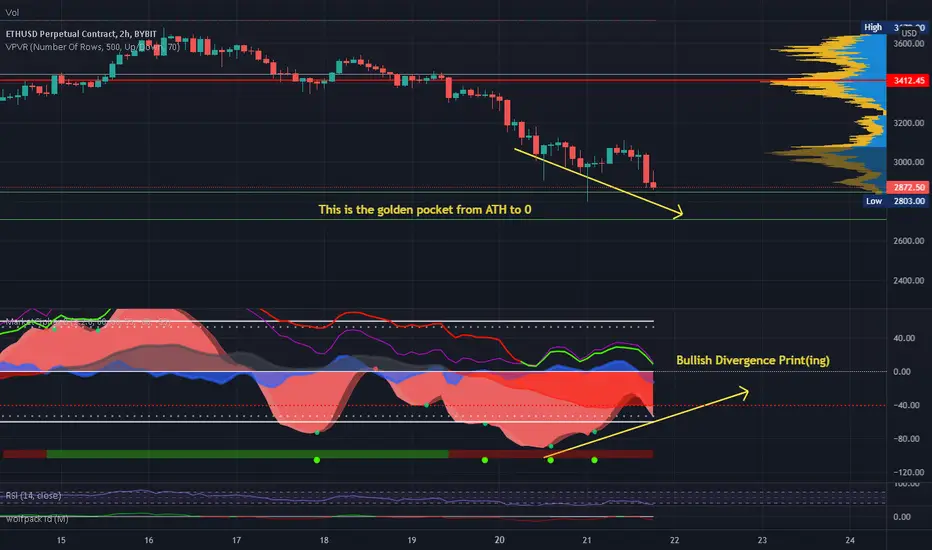
ETH/USD Get Your Swing Longs InWe have arrived at the golden pocket from the All-Time High to 0 and the larger time frames (1 hour, 2 hour, etc) are starting to print bottoms and bullish divergence. Looking for a nice rebound in this area
ETHUSD Daily MA formationI have sketched out how I think the moving averages will develop in the coming days/weeks
I believe this drop is just a fake and a sharp recovery is in order
Having the MA's layered 50,100,200 allows for easy upward movement

ETHUSDT Next Bull run!!ETHUSDT (1D Chart) Technical analysis
ETH/USDT(1D Chart) Currently trading at $3060
Buy level : Above $2969
Stop loss: Below $2610
TP1: $3380
TP2: $3775
TP3: $4185
TP4: $4500
Max Leverage 2x
Always keep Stop loss
Follow Our Tradingview Account for More Technical Analysis Updates, | Like, Share and Comment Your thoughts.
