Ethusdlong

ETHUSD - Long Trade Idea - 3700 targetETHUSD, 1h, Buy
Entry - 3500.00
Stop Loss - 3475.00 (25 pips)
Take Profit - 3700.00 (200 pips)
the descending trend was broken.. looks like beginn to go up.. lets see what happen..keep sl and tp always!!!!

ETH GONNA PUMP eth will be 6k after break out
its cup and handle pattern dude!
lets go to the moon...

ETH double tapETH has become a little bit slower and is not moving as fast as many expect. Good opportunity here. ETH has broken out the double bottom pattern. I am planning to DCA in till the support ~ 3500. Target is going to be 3850 (10% profit). My stop loss is going to be set at 3400.

ETH/USD Golden Cross Daily Time FrameETH/USD Golden Cross Daily Time Frame.
50 MA Red
200 MA Yellow
The golden cross on the daily time frame usually indicated a bullish run for weeks to months on end. Ethereum seems to have reached its Golden Cross a lot earlier than BTC/USD being that it has higher volatility than BTC. ETH in 4 years time can easily 3-4x your holdings though not financial advice. Price remains strong support above 50MA which is a good indicator to make my bets into ETH. If price breaks below 50MA and 200 MA we can expect a one year long bear market. Yellow candle is a bullish candle indicator where buy should occur. Everything is a probability play. You don't need to play every hand you get in Poker. Just pick the best spots/hands. I will be accumulating in the red and sideways movement. As long as supports hold.

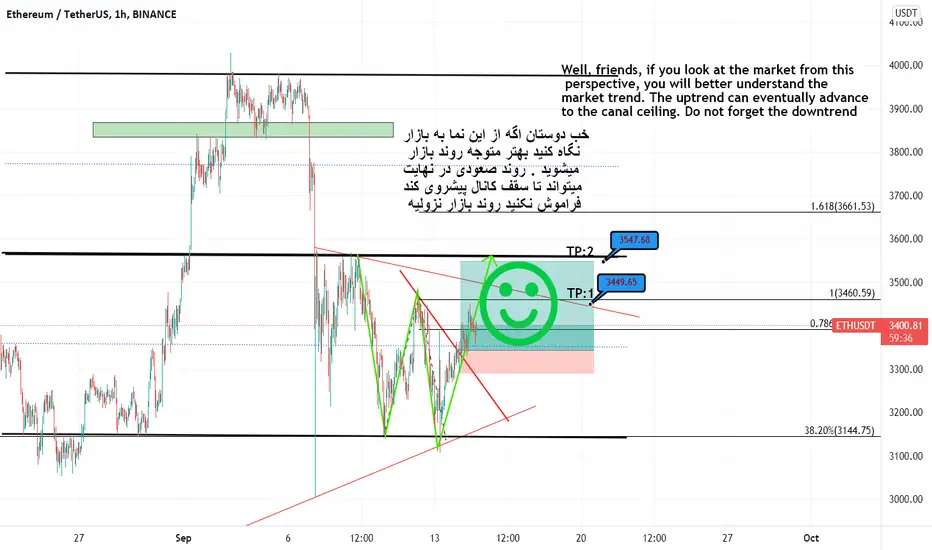
ethusdt/long/positionBINANCE:ETHUSDT
Well, friends, if you look at the market from this
perspective, you will better understand the market trend.
The uptrend can eventually advance to
the canal ceiling. Do not forget the downtrend
ETH Is One Crucial Bump Away From Exploding To $4,000
Ethereum rebounds from $3,000 to above $3,400 but faces intense resistance between $3,500 and $3,600.
The IOMAP model reinforces the resistance between $3,500 and $3,600 from an on-chain perspective.
Ethereum has, in the last one week, focused on securing higher support, especially one that is strong enough to prevent losses from stretching below $3,000. Prior, the pioneer smart contracts cryptocurrency had made tremendous progress from July lows of $1,700 to touching $4,000.
As Bitcoin tumbled from $54,000 in the first week of September, Ethereum saw its boat start to sink. Various tentative support areas at $3,600 and $3,400 did little to halt the downswing, which resulted in declines near $3,300.
Ethereum Bulls Not Ready To Give Up Mission To $4,000
The 50-day Simple Moving Average (SMA) put up a strong barrier, allowing buyers to feel the support. This increased investor confidence, and Ether recoiled above $3,400. However, another hurdle has become apparent at $3,500 and $3,600, delaying the expected recovery to $4,000.
Ethereum must close the day above this barrier to validate action to $4,000. Moreover, more buyers will come into the market as Ether makes haste toward $4,000.
Meanwhile, the Relative Strength Index (RSI) shows that ETH may settle for sideways trading as it levels at the midline. Nonetheless, nothing in the volatile cryptocurrency market is cast in stone. Hence it is essential to watch out for the direction of the RSI moving forward.
IntoTheBlock’s IOMAP model brings to light a massive resistance, running from $3,512 to $3,614. This region is currently preventing bulls from achieving their goal to trade around $4,000.
Nearly 316,000 addresses bought 8.21 million ETH in this range and will try to break even as Ethereum rises, a move likely to dampen the buying pressure. However, slicing through the same barrier would bolster Ethereum significantly upward as buyers take on $4,000.
On the downside, Ethereum sits on top of relatively weak support areas, but the model brings our attention to the area running from $3,304 to $3,405. Here, 1.28 million addresses scooped up 4.5 million ETH. If they hold steady, Ethereum may have the chance to close the gap to $4,000, but losses will soar if broken and perhaps explore areas under $3,000.
Ethereum Intraday Levels
Spot rate: $3,400
Trend: Sideways
Volatility: Low
Resistance: $3,500 to $3,600
Support: $3,300 to $3,400

ETHUSDT(4h Chart) - Descending ChannelETHUSDT (4h Chart) Technical analysis
ETH/USDT(4h Chart) Currently trading at $3349
Buy level : Buy after Breakout
Stop loss: Below $3141
TP1: $3483
TP2: $3564
TP3: $3704
TP4: $3845
Max Leverage 3x
Always keep Stop loss
Follow Our Tradingview Account for More Technical Analysis Updates, | Like, Share and Comment Your thoughts.

ethusdt/long/positionBINANCE:ETHUSDT
To open a position, wait for the price to reject its
leading resistance and then expect the price
to advance to the level of Fibonacci 1

Ethereum is holding his trendline.. for now!Good Morning friends :)
Today we take a look at ETHUSD.
The current formation is verry critical. Bitcoin is in a verry dangerous position too right now and if we lose our trendlines, we could see some nasty dumbs in the market.
I safe my profit for now, until we build a higher high.
Fundamentally Ethereum is verry strong right now. the whole NFT thing is all around the internet right now. But if everybody is making money with something the bubble is about to pop.
Remember the time BTC hits new ath and everybody is fomo in it.
From time to time, the rich people take profit and buy low again.
Always have the liquidty to do so.
Have a nice day :)
See you in the next one

ETHUSD - Long Trade Idea - go to 3900
ETHUSD , 5m - Buy
Entry - 3752.00
Stop Loss - 3722.00 (30 pips)
Take Profit - 3902.00 (150 pips)
looks like a bull flag .. probably if broke the resistance go up to 4000s

ETH/LONG/positionBINANCE:ETHUSDT
You can enter the long position right now or
wait until the opposite trend line is broken. The ma
rket will not have a strong climb. Do not forget capital management.


Ethereum has a lot of room to move ETHUSDA massive support is evident
This will most likely hodl with the reset test
Lead to bullish continuation and further testing ATH's for ETHUSD


ETHUSD - $5000 IncomingCOINBASE:ETHUSD
The next leg up and we shall hit $5k+
exactly $5120 is 1.618 fib level - very easy to long now.
TA: It hit the most recent and strong support 3 times if the see the current purple line price is around that area only.
Consolidated and we are ready for a the pump now. A few more days and we shall see $5k+

ETH. The bull planGreetings traders! After the big dump, unraveling the correction has been a challenge however I feel it has made a case for completion! If we are going to move in a short C wave as per the larger bull count, then we can expect 5 waves down seeking the C wave to finish correction and wave 2 of a higher degree. The length of the next move is critical and a pivot and hold around the confluence levels between the length of A and the 61.8% retracement of the whole rally in the mid $2500's could lead to a substantial rally! Good luck!

ETH ANALYSIS WHATS NEXT !!?Eth is quick analysis for better understanding ETH is now consolidating in upside pattern if breaks out this then we can see bullish trend in ETH

ETHUSD Idea / ForecastThis is how i see price following this large falling wick playing out
A large drop then leading to a slow yet inevitable rise
Still bullish

Will ETH follow SOL?It can be seen on the 50,100 and 200MA that a very similar pattern has emerged between SOL and ETHUSD
ETH may be on a crash course towards the moon
aim for 8K

Is Ethereum aiming for a new ATH?Ethereum has seen a good recovery over the past 6 to 7 weeks. After creating an ATH, it dipped hard retracing more than 50%. But, then we've seen adoption, institutional interest, and the latest developments which helped ETH price to again bounce back to the current levels.
It's trading at around $3940, at the time of writing and is holding the support level at $3826 very well. If it's unable to hold this support level, it might retest the $3000 area before making an upward move.
It looks like an easy path for it to see a new ATH if it manages to break the immediate resistance level at about $4000.
RSI has again visited the overbought zone, which shows strength and is a good sign to see an upward move.
A good place to open a long position would be during the retest of the support level or the breakout of the immediate resistance level.
Please do your own research before opening any trade, and use a proper risk management strategy to minimize the chances of any losses.
Do let us know in the comment section about your thoughts on this analysis.
Follow us for more ideas, scripts, and educational analysis.
Happy Trading!

Bullish Divergence in Ethereum* RSI on Ethereum appears with Bullish divergence.
* RSI divergence occurs when there is no longer the same momentum between the price and the RSI indicator.

₿ ETHUSDT 1D ₿ : 08.Sep.2021 (Update)Hey Guys , How Are you Today , Well As we can see, after the fall in the price, it has hit a strong supportive X-point, we expect the price to fluctuate in the same range and if it loses this support, it will fall to lower levels. I will update the alternative scenario if this analysis fails.
⚠️ This Analysis will be updated ...
👤 Arman Shaban : @Ar_M_An_4
📅 08.Sep.2021
⚠️(DYOR)
