ETH to $3700 Before a Major Bounce?Ethereum has been showing signs of exhaustion after its recent rally. I'm watching the $3700 level closely — it's a key support zone that has acted as both resistance and support in the past.
🟦 If ETH pulls back to this area, I expect it to find strong buying interest, potentially leading to a significant bounce and continuation of the bullish trend.
📌 Scenario I'm Watching:
🔻 Pullback to the $3700 support zone
📉 Shakeout or stop hunt below previous lows
💚 Followed by a strong bullish reversal — possible move toward $4000+
Why $3700?
Confluence of previous highs/lows
Psychological round number
Potential liquidity pocket
Not Financial Advice!
This is a scenario I'm tracking, not a guarantee. As always, wait for confirmation (e.g. bullish engulfing, RSI divergence, volume spike) before jumping in.
📉 If $3700 fails decisively, I'll reassess — next support likely around $3550–3600.
Ethusdshort

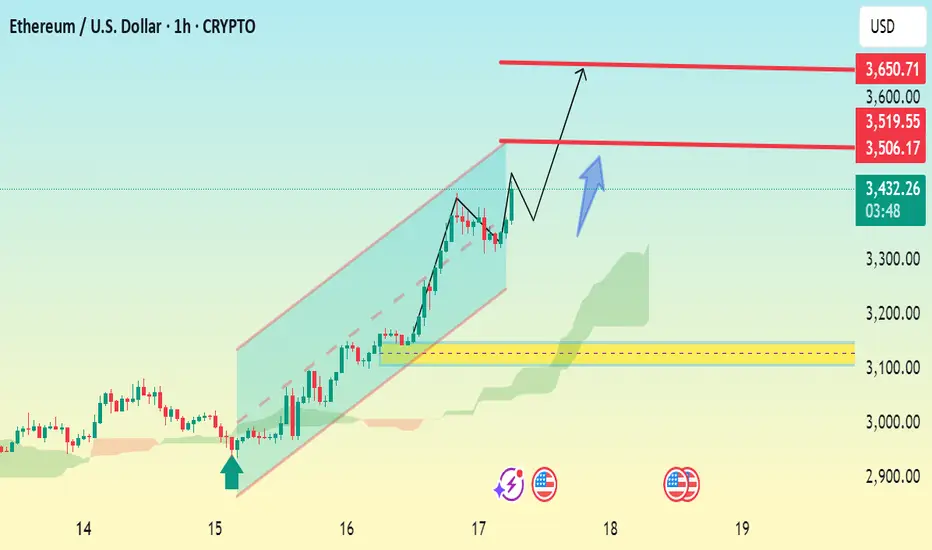
ETHUSD 1h Bullish Reversal SetupChart Analysis Summary:
Current Price:
$3,429.21 (at the time of the screenshot)
Trend:
Strong uptrend within a bullish ascending channel.
Price has been respecting the trendline and moving upward steadily.
Key Chart Patterns & Tools:
Ascending Channel: ETH is trading within an upward sloping channel, suggesting bullish momentum.
Ichimoku Cloud (green): Price is trading well above the cloud, reinforcing bullish sentiment.
Breakout Structure: The chart shows a small consolidation/pullback with a projected bullish breakout.
📈 Key Levels:
Type Price Level (USD) Notes
Current 3,429.21 Live price
Resistance 1 3,506.17 Minor resistance
Resistance 2 3,519.55 Immediate breakout target
Final Target 3,650.71 Major resistance and potential price objective
🧭 Price Action Forecast:
If ETH holds above $3,429 and breaks above $3,519.55, the path toward $3,650 remains open.
A small pullback (as indicated by the blue arrow) is expected before continuation.
As long as price remains within or near the ascending channel, the bullish scenario .
✅ Bullish Confirmation:
Break and retest of $3,519.55.
Continued support above the Ichimoku cloud.
Holding the trendline from the ascending channel.
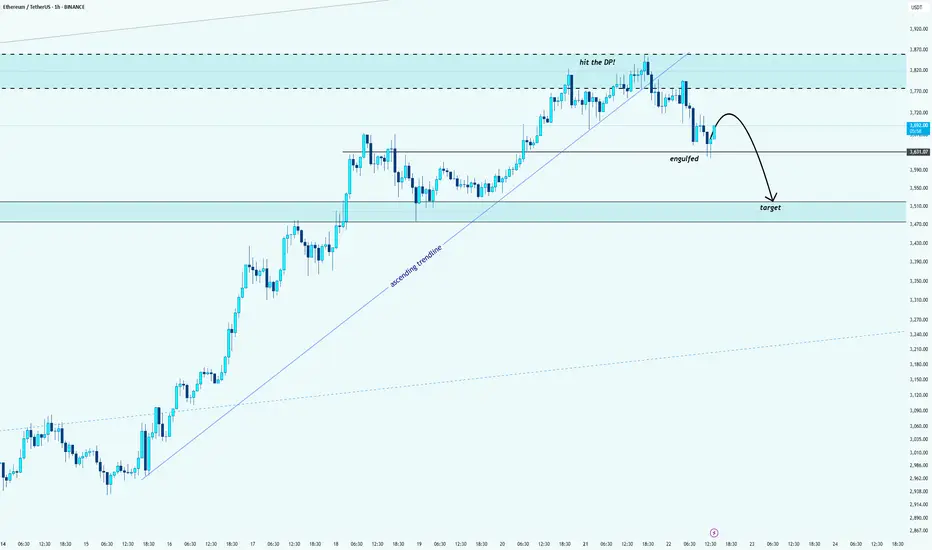
ETH/USDT: Bearish Reversal After Hitting the Decision PointHello guys!
After a strong rally, ETH finally hit the Decision Point (DP) zone marked above. Like what I said:
And we’ve already seen signs of rejection from that level.
🔹 The ascending trendline is broken
🔹 A key support got engulfed
🔹 Price is now forming a bearish structure
The target zone is mapped out around $3,500 – $3,470, where previous demand sits.
We might see a small pullback before continuation, but overall momentum is shifting downward.
Wait for confirmations and protect your capital
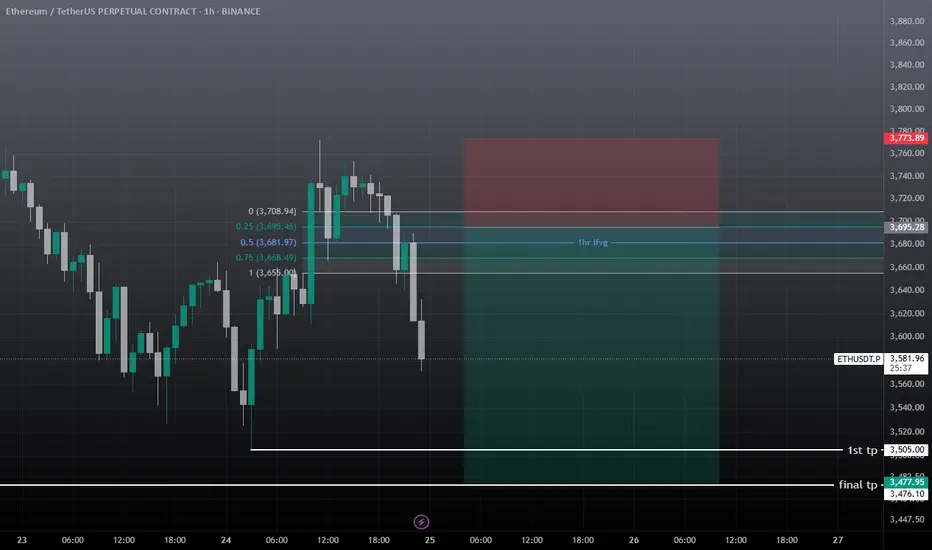
eth usdt short setupEth showing some correction towards 3.4-3.2k , I'm not bearish but alts needs some correction before another mini leg-up, must use sl, take some entry at 3681 and other on 3695. If tp hits first then ignore it.
ETHUSD - Decision TimeWhat do make of the current situation?
What if you are long?
Here's what to expect:
a) support at the U-MLH, further advancing up to the WL
b) open & close within the Fork. If so, there's a 95% Chance of price dumping down to the Centerline.
Taking 50% off the table is never bad.
50% money in the pocket if price falls down to the Centerline.
Or if it advances up to the WL, you still have 50% that generates profits.
Either way, you have a winner on your hands.
Don't let it dig into a Looser!

ETHUSD - Stretched price. Pullback to CL likelyPrice tagged the U-MLH, the stretch level.
Think of it like the 2nd STDV.
Now think Mean Reversion.
With such a stretch, price has a high chance to revert to the mean - down to the Centerline (CL).
What is this information good for?
a) take profit (...or 50% partial)
b) short on intrady signs
But if it is open and close above the U-MLH, then there's a good chance that price is advancing to the Warning Line, the extension of the Center to U-MLH.
Let's observe what happens.

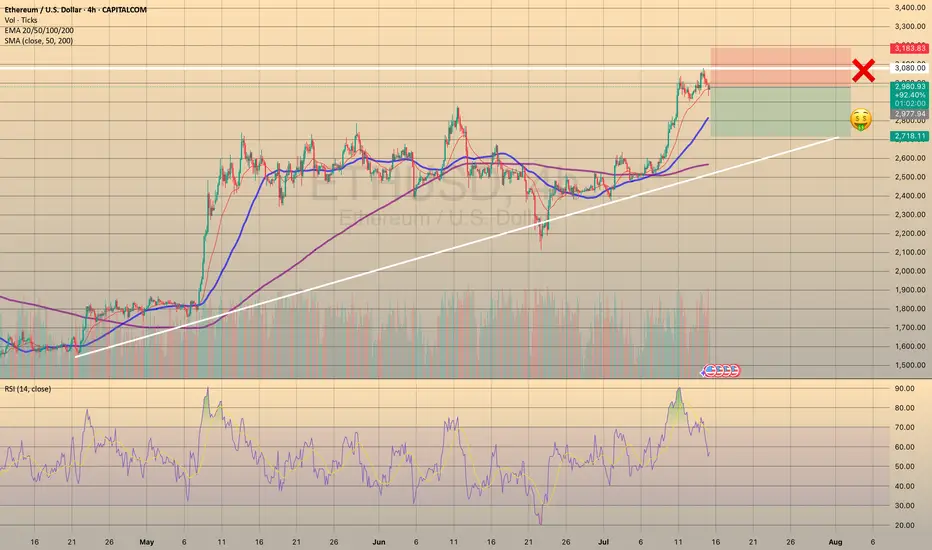
ETHUSD REACHED NEW HIGH - SHORT OPPORTUNITY
TRADING IDEA - ETHUSD REACHED NEW HIGH - SHORT OPPORTUNITY📉
The same as BTCUSD, ETHUSD has reached a new maximum at 3.083.52. After that the asset went sideways, waiting for some impulse. I see strong divergence on 4h timeframe on RSI and expect a decline within next 24-48 hours. Basically, it is the same story here as with the bitcoin, cause the nature of the recent hike is also the same. So, I put a
🔽 a market sell order at 2977.94 with
❌a stop loss at 3183.83 and
🤑a take profit at 2718.11
It is a counter-trend trade, so it's a bit more risky than usual.
Trade cautiously! Preserve your deposits!
ETHUSD h4 next move downThe resistance at 1.36554 may be weak due to:
Multiple taps already
Reduced seller interest
A breakout above this zone could trigger short covering → sharp rally
✅ 2. Higher Low Structure
Recent low at 1.35475 held strong
Current consolidation appears like a bullish flag or accumulation range
Could indicate continuation, not rejection
✅ 3. Fakeout Reversal Setup
If price dips into the support at 1.35475 again, it might:
Trap breakout traders
Reverse and form a new impulse leg upward
Target = 1.3700–1.3750 zone

"Bearish Reversal Opportunity Following Supply Zone Rejection"1. Double Top Formation (Resistance Level Identified)
The chart displays a clear double top structure at the 2,760–2,800 USDT level.
This level has acted as a strong supply zone (highlighted in red), where price previously reversed, indicating heavy selling interest.
Current price action has retested this resistance zone and shown signs of rejection.
2. Liquidity Sweeps & False Breakouts
On the left side of the chart, an aggressive downward wick (marked with a blue arrow) suggests a liquidity sweep below a key low before strong bullish momentum returned.
This type of price action indicates smart money involvement, designed to remove weak hands before pushing price higher.
3. Accumulation Phases (Sideways Consolidation)
Multiple accumulation ranges are highlighted with blue rectangles.
These ranges show horizontal consolidation, where price builds up energy before breakout.
The most recent breakout led to a vertical rally toward the resistance zone, signaling an end of the accumulation and a start of distribution.
4. Double Bottom Support Structure
Identified near the 2,480 level, marked by red circles.
This level has historically acted as demand/support, evidenced by multiple bounces from this price zone.
Now highlighted with a grey zone, it is projected to act as the next key support area.
5. Bearish Projection
A large black arrow suggests a forecasted bearish move from the current high (~2,800) back to the support zone (~2,480).
This aligns with the idea of a mean reversion or pullback after a strong bullish impulse.
---
Conclusion & Trade Idea:
🔻 Bias: Bearish (Short-term)
The chart presents a classic reversal pattern with a double top at a well-defined supply zone.
Entry could be considered after confirmation of rejection from this level.
🧠 Trade Plan Suggestion:
Entry: Short near 2,780–2,800 after bearish confirmation (e.g., bearish engulfing candle or break of structure).
Target: 2,480 (support zone).
Stop Loss: Above 2,820 (recent high).
Risk-Reward: Approximately 1:2.5 or better depending on execution.

ETHUSDT.P H1 : Short-Term CorrectionBy analyzing the 1-hour timeframe, we can see that the price may drop from the 2780–2820 zone down to 2600

SHORT ON ETHEREUM ETH/USDEthereum has created a lower high after a triple top and is currently looking very bearish.
Huge imbalance to the downside to be filled.
I will be selling eth to the next demand level looking to catch over 500-600 points.

My first recording for ETHUSD - FxDollars - {25/05/2025}Educational Analysis says that ETHUSD may give countertrend opportunities from this range, according to my technical analysis.
Broker - bitstamp
So, my analysis is based on a top-down approach from weekly to trend range to internal trend range.
So my analysis comprises of two structures: 1) Break of structure on weekly range and 2) Trading Range to fill the remaining fair value gap
Let's see what this pair brings to the table for us in the future.
Please check the comment section to see how this turned out.
DISCLAIMER:-
This is not an entry signal. THIS IS FOR EDUCATIONAL PURPOSES ONLY.
I HAVE NO CONCERNS WITH YOUR PROFIT OR LOSS,
Happy Trading, Fx Dollars.

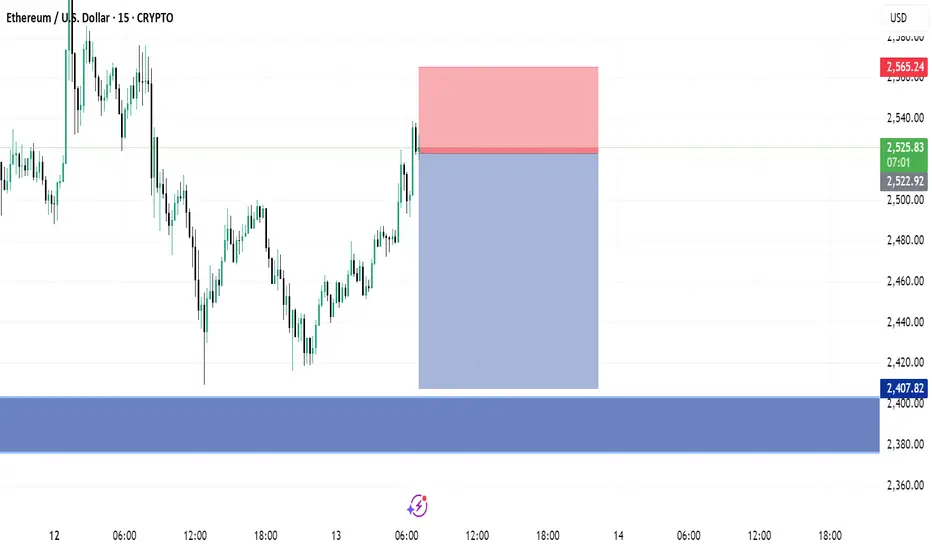
ETH/USD Bearish Reversal Setup – Targeting $1,470 After ResistanPair: Ethereum / U.S. Dollar (ETH/USD)
Exchange: Coinbase
Timeframe: 15 minutes
Indicators:
EMA 30 (red line): ~1635.82
EMA 200 (blue line): ~1585.79
🟣 Key Levels & Zones
Resistance Zone (Purple Rectangle Top): Around $1,647 – previously tested and rejected.
Support Zone (Purple Rectangle Bottom): Around $1,470 – marked as the "EATARGET POINT".
Current Price: ~$1,645
📉 Bearish Breakdown Setup
Chart Pattern: There’s a potential double top or distribution zone forming near the resistance.
Projection: The price is expected to break below the smaller support zone and drop to the target zone around $1,470.67, representing an 11.13% drop.
Measured Move Tool: Indicates a bearish price target if the price breaks down from the current consolidation.
✅ Confluence
Price is currently hovering under resistance.
EMAs show short-term bullish momentum but could flatten if breakdown confirms.
Support near $1,635 is being tested – a break below could trigger the expected drop.
⚠️ Trading Implications
Short Setup: A trader might look to enter short around $1,647 if breakdown confirmation occurs.
Stop Loss: Just above the resistance zone (~$1,650+).
Take Profit: Near $1,470 zone.


ETH Chart - SECRET in the INVERTETH is losing ground quickly after a nasty bearish pattern formed in the weekly.
The bearish M-pattern we're currently observing in the macro timeframe:
We know this is a bearish patter, not only because we've seen it many times before but also because it is the opposite of the W-Bottom. (we can actually confirm this by flipping the chart):
In this case, the bullish confirmation would have been a support retest of the neckline:
And so, if we flip it again back to the original view - the opposite can be true. As we get rejected on the resistance line, an even lower price is likely:
____________________
BINANCE:ETHUSDT

BTCUSD:Wait for a rebound before going shortThe fluctuations are not big now, judging from the structure of the 30M icon. The probability of rebounding and then falling later is relatively high. My trading idea is to wait for the rebound to go short. The short orders entered near 88K yesterday are now generally profitable. They can be closed first and then entered after the rebound to prevent the price from rising directly.
Losing profits is a trivial matter, but turning from profit to loss would be very uneconomical.

ETHUSD Market Analysis: Technical Indicators and Bearish SentimeAs of now, ETHUSD has dropped to $1,961, registering a daily decline of $94.9. Earlier, it exhibited robust upward momentum, surging past the $2,000 threshold. However, it has since experienced a pronounced downturn.
In terms of technical analysis, although the MACD doesn't clearly indicate a trend, its histogram has transitioned from positive to negative and is shrinking, suggesting that bullish strength is waning. The KDJ indicator, with a reading of 90, is in overbought territory. The 4 - hour candlestick chart reveals a substantial price drop relative to earlier levels. Even though the last candlestick is bullish, the overall market sentiment remains bearish.
Recently, trading volume has dwindled. The phenomenon of prices rising while volume falls indicates a significant weakening of upward momentum.
The market may be influenced by profit - taking from the previous rally, which has triggered a selling frenzy. Moreover, external factors like macroeconomic conditions and regulatory policies could also be at play. If key support levels, such as $1,874, fail to be reclaimed, bears are likely to retain their dominance. Investors should vigilantly monitor these support levels and prudently adjust their investment strategies.
ETHUSD
sell@1980-2000
tp:1900
buy@1850-1870
1930-1950
I will share trading signals every day. All the signals have been accurate for a whole month in a row. If you also need them, please click on the link below the article to obtain them.

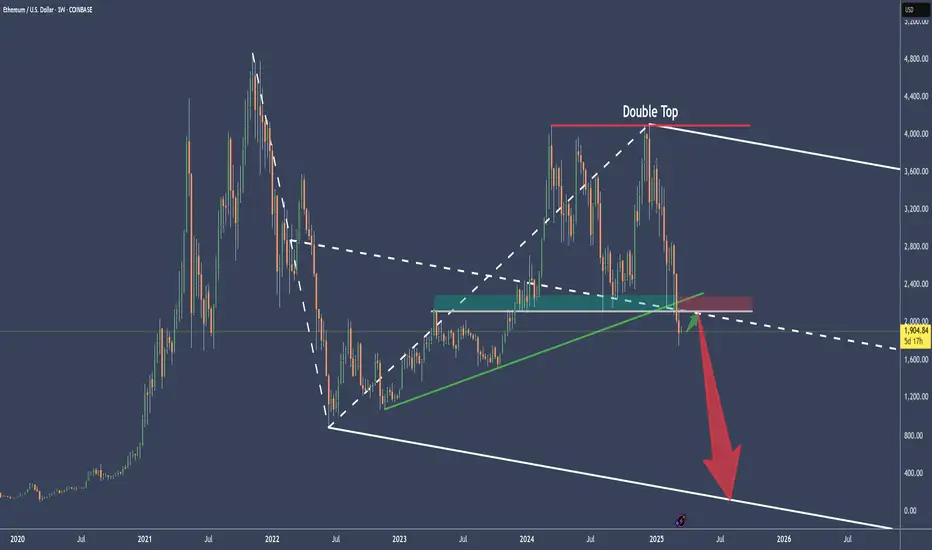
ETHUSD Cracked the longterm supportFirst there was the Double-Top.
Then there was no higher close above the last 2 highs, pressing ETHUSD brutally down to fullfill the Medianlines Rule to reach the Center-Line over 80% of times.
Then price not only reached the Center-Line by breaking through the slanted green support, but also cracked through the weekly horizontal Base (grey) which acted as the last support Bastion.
There are two scenarios possible.
a) a pullback, jump above the CL and we will see a moonshot.
or
b) price is retracing the Center-Line as it does most of the time after it's break, and then continues to the downside. Target would be the Lower-Medianline-Parallel.
The Forecast of ETHUSD TrendETH is currently hovering around $1,900. There is obvious resistance at $1,920 above, and $1,870 below is a key support level. If it breaks through the resistance, it is expected to reach for $2,000; if it falls below the support, it may drop to $1,850.
ETHUSD
sell@1920-1940
buy@1850-1870
I have been engaged in the trading field for nine years.
Up to now, the profit I have made has exceeded one million US dollars.
If you want to obtain professional guidance on trading trend analysis, trading strategy formulation, and risk management, please click on my profile.

ETH/USD "Ethereum" Crypto Market Heist Plan on Bearish Side🌟Hi! Hola! Ola! Bonjour! Hallo!🌟
Dear Money Makers & Robbers, 🤑 💰
Based on 🔥Thief Trading style technical analysis🔥, here is our master plan to heist the ETH/USD "Ethereum" Crypto market. Please adhere to the strategy I've outlined in the chart, which emphasizes short entry. Our aim is the high-risk Green Zone. Risky level, oversold market, consolidation, trend reversal, trap at the level where traders and bullish robbers are stronger. 👀 So Be Careful, wealthy and safe trade.💪🏆🎉
Entry 📉 : You can enter a short trade at any point,
however I advise placing sell limit orders within a 15 or 30 minute timeframe. Entry from the most recent or closest high level should be in retest.
Stop Loss 🛑: Using the 4H period, the recent / nearest high level.
Goal 🎯: 3000.0
Scalpers, take note : only scalp on the Short side. If you have a lot of money, you can go straight away; if not, you can join swing traders and carry out the robbery plan. Use trailing SL to safeguard your money 💰.
Warning⚠️ : Our heist strategy is incompatible with Fundamental Analysis news 📰 🗞️. We'll wreck our plan by smashing the Stop Loss 🚫🚏. Avoid entering the market right after the news release.
Take advantage of the target and get away 🎯 Swing Traders Please reserve the half amount of money and watch for the next dynamic level or order block breakout. Once it is resolved, we can go on to the next new target in our heist plan.
💖Supporting our robbery plan will enable us to effortlessly make and steal money 💰💵 Tell your friends, Colleagues and family to follow, like, and share. Boost the strength of our robbery team. Every day in this market make money with ease by using the Thief Trading Style.🏆💪🤝❤️🎉🚀
I'll see you soon with another heist plan, so stay tuned 🫂

#ETHUSD 4HETHUSD (4H Timeframe) Analysis
Market Structure:
Double Top Pattern: A classic reversal pattern has formed, with the price testing a key resistance level twice and failing to break higher, signaling potential bearish pressure.
Forecast:
Sell Opportunity: The formation of the double top suggests a possible reversal, with a move to the downside expected once the price confirms a break below the neckline.
Key Levels to Watch:
Entry Zone: Upon the break below the neckline of the double top pattern or after a retest of the neckline as resistance.
- **Risk Management:**
- **Stop Loss:** Placed above the recent high or the top of the double top pattern to manage risk.
Take Profit Zones: Target the next support levels or Fibonacci retracement zones for potential downside movement.
Market Sentiment:
Bearish Bias: A double top typically signals a reversal from an uptrend to a downtrend, with increased selling pressure expected once the neckline is broken.

ETHUSD double top ETHUSD double top
ETHUSD has nicely drawn a double top with a target at $3,000 where I will reopen positions closed at $3,800
