SHORT PLAN for Ethereum upcoming upgradeBYBIT:ETHUSDT.P
4h time frame
-
Ethereum's Shanghai upgrade is imminent.
Also, we can notice there is a potential double top structure forming.
Try to short it if break down that uptrend line.
Ethusdshort

💥 ETHUSD 4H-TIMEFRAME ANALYSIS💥 ETHUSD 4H-TIMEFRAME ANALYSIS
💗Hello ladies and gentlemen
This is my new idea for 💥ETHUSDT ETHBUSD
I hope my idea is clear
Support me by like and share thank you
Stay Safe💯💲💲💲
Good luck💰😍

$ETH short next 4hThis is my analysis and idea only. Do not take this as financial advice, and please do not base any trades based on this chart, or any content I post. These are my thoughts only. Operating in crypto is dangerous and can quickly stack up big losses. Always study, and do your due diligence.

📈Ethereum prediction during FOMC decision📉BINANCE:ETHUSDT
BITSTAMP:ETHUSD
Hey everyone, first take a look at my previous analysis and positions.
2 scenarios for the Ethereum
Price targets ----> 1-2-3 are on the chart.
For long targets ----> checkout previous idea.
Don't forget to risk-free your position.
Please share ideas and leave a comment,
let me know what's your idea.
CrazyS✌

Bullish Reversal for ETHUSDPrice has made a bearish divergence. if the price breaks the neckline it will be trend reversal. Double top has formed as a clear indicator of trend reversal.

Ethereum ( ETHUSDT ) Dump AheadI think Ethereum ( ETHUSDT) has two scenarios ahead :
1- Dumping from 1800~1840 to 1370-1400 zone area
2- Continuing the increasing trend and stopping in the range of 2010-2090 dollars, the price starts falling towards the price of 1160-1200 zone area
I use martingale strategy for this setup
Good Luck
Be nice...
Can't believe we have to spell this out, but yes, please treat others how you'd like to be treated yourself. Be respectful, kind, tolerant, and constructive, even when you disagree. There's no room for negativity, swearing, trolling, or conflict here: it's a waste of time and the hallmark of an idiot.

SHORT ETHUSD IDEA TO:1601.12Shorted from 1692.27
Stop loss at : 1700.00
Target area: 1601.12
looking to go back the a congestion area previously made from a channel breakout

Trading Range ETHUSDThe trade plan is discueesd in chart.You can either play in Range but buy at S1 Or Sell at R1. Incase it breaks S1 and S2 your Sell stop will triger and vice versa.

#ETHUSD - Swing Down to Recent Lows Before Moving Up Again?Looks like #ETHEREUM is about to to clear some smiles from the bulls as it descends around 30% to meet recent support levels.
There'll be a few swings in this descent where shorter term traders could bag multiple profits up and down, but our forecast for the next month or two most definitely red!
_________
What Do You Think?
If you enjoyed or agree with this idea - drop us a comment, like & follow! 😀
Ideas by theCrypster meet the guidance notes and disclaimer as mentioned below and within our website. See Signature for more info! ✌️
🔥🔥🔥
Crypto Tipster v2
theCrypster
🔥🔥🔥

ETHUSD💥1H-TIMEFRAME ANALYSISETHUSD💥1H-TIMEFRAME ANALYSIS
💗Hello ladies and gentlemen
This is my new idea for 💥Ethereum
I hope my idea is clear
Support me by like and share thank you
Stay Safe💯💲💲💲
Good luck💰😍

ETHUSD top-down analysisHello traders, this is a complete multiple timeframe analysis of this pair. We see could find significant trading opportunities as per analysis upon price action confirmation we may take this trade. Smash the like button if you find value in this analysis and drop a comment if you have any questions or let me know which pair to cover in my next analysis.

#ETHUSD - Price Dropping to Meet at Multiple Levels of SupportThe last few weeks have been super for us at theCrypster. #ETHEREUM has been equally kind, with a near 25% gain locked in and now showing signs of a healthy Short to be had too.
After a short period of consolidation at the current price range we've received a Sell signal from CTv2 and can see the price dropping to meet both a layer of support at $1350 and an ascending trend line simultaneously.
If you enjoyed or agree with this idea - drop us a comment, like & follow! :)

ETH - Selling StrategyBYBIT:ETHUSDT.P
1hour time frame
-
ETH is building a potential double top here.
According to the demand zone, we can set strategy as below.
-
Entry: 1660
TP: 1585, 1557
SL: 1696

Ethereum Short Opportunity: ETH/USDBased on the technical analysis of ETH/USD chart, I am taking a short trade with entry at 1690$. My target price is 1580$ and stop loss is set at 1795$. This trade idea is based on chart patterns and recent price action, traders are advised to consider their own research and risk management strategies before taking any trades.

Ethereum's game changer moment 1.1.2023March 2020 to Jan 2023 support trend-line confirmed recently with another bounce of higher lows.
Highlighted on chart previous times we've had the support tested since March 2020, rally which followed was aggressive and substantial.
1) August 2020 to April 2021 - $4,054 gain per coin, 1012% increase.
2) June to August 2022 - $1,100 gain per coin, 120% increase.
3) October to November 2022 - $588 gain per coin, 53% increase.
Most recently support was tested December 20th and since gained about $50 per coin from the low, confirming the big picture support to be relevant.
Connecting highs since the ATH November 2021 at $4,800 per coin show resistance to be around $1,426.
Connecting lows since the low of $93 per coin back March 2020 show support to be around $1,050.
The pattern which is formed is a big triangle consolidation of 3 years - Price currently trades very close to the apex and there could be a breakout above or below mentioned levels within the next quarter.
In my opinion, there's higher potential is for a break up considering higher lows were kept for the entire 3 year period, even through the panic selling caused by FTX and other industry shacking events.
-------------------------------------------------------------------------------------------------------------------
I encourage you to do your own research, make your own judgement and take cautious decisions keeping in mind trading is speculative and can be unpredictable.
-------------------------------------------------------------------------------------------------------------------

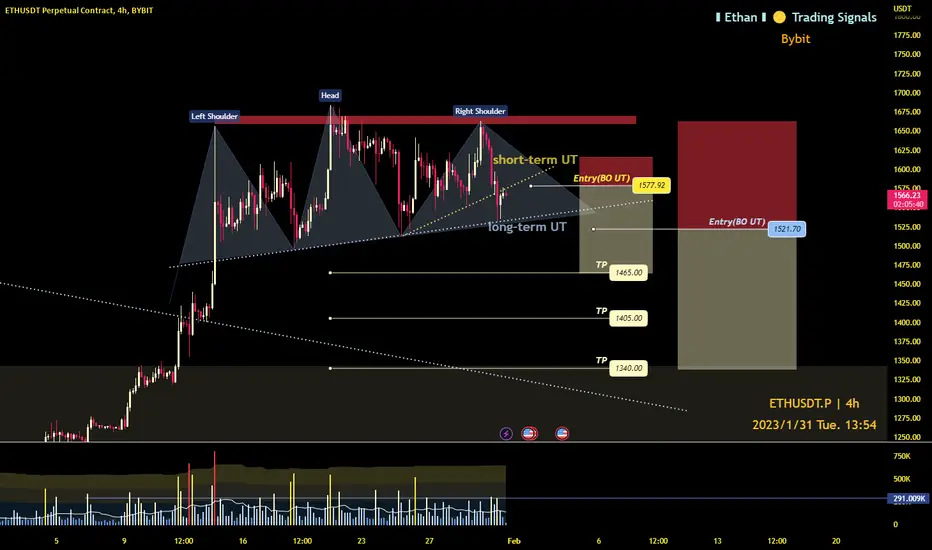
ETH - 2 Selling StrategiesBYBIT:ETHUSDT.P
4H time frame
-
ETH forms a potential HS
According two uptrend(UT) lines, there are 2 opportunities to open short.
-
1.
Entry: if getting resistance from short-term uptrend again(~1577)
TP: 1465 or reach lower uptrend
SL: 1615
2.
Entry: BO the long-term UT (~1521)
TP: 1405, 1340
SL: High of right shoulder (~1663)
-
Notice: All price are set from the predicted trend, can set it more accurate based on the actual trend/pattern after opening short
Ethereum ETH is crashing right now!Hello, my dear friends!
Today I am crazy man because there is a third analysis today. I know that a lot of traders suppose that Ethereum is the strong asset, but I want to tell you that current crash is still not over and we can see today the massive triggering of the short signals. First of all I want to warn you that I am not going to open short on ETH using the setup above because I have the short trade on Bitcoin.
4h time frame of the BINANCE:ETHUSDT chart is showing us that the key down fractal has been broken below the Williams Alligator indicator’s red line. The price was $1554 . If you have already executed the short trade your stop loss should be placed at $1663 .
I consider the potential target inside the Fibonacci golden pocket zone at $1380 . When the price will reach this price I am going to watch out the market carefully to execute the long trade on the potential reversal setup.
Best regards, Ivan
________________________________________________________________________________________________
If you like my trade ideas, please smash the boost button to stimulate me make more quality analytics!

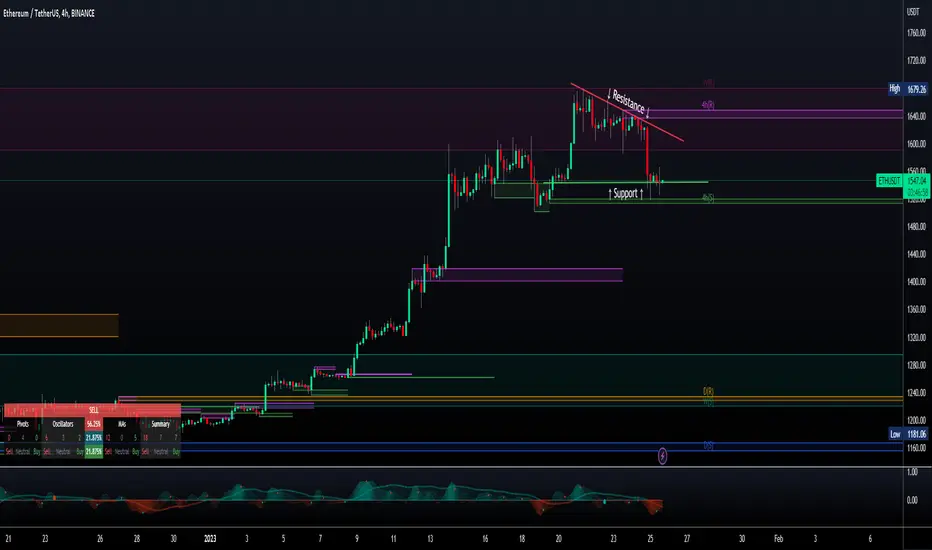
#ETH/USD : Descending TriangleIt looks like a descending triangle is distinguished. Once price breaks through the support, the resulting move could predict the more likely potential of falling prices. It is possible that a rangebound towards 1500 will form while lower than 1540.
Ethereum to stall at current highs?Ethereum - 24h expiry - We look to Sell at 1579 (stop at 1618)
A Doji style candle has been posted from the high.
The bearish engulfing candle on the 4 hour chart is negative for sentiment.
We look for a temporary move higher.
Bespoke resistance is located at 1580.
Rallies should be capped by yesterday's high.
Our profit targets will be 1481 and 1461
Resistance: 1550 / 1580 / 1606
Support: 1515 / 1500 / 1480
Please be advised that the information presented on TradingView is provided to Vantage (‘Vantage Global Limited’, ‘we’) by a third-party provider (‘Signal Centre’). Please be reminded that you are solely responsible for the trading decisions on your account. There is a very high degree of risk involved in trading. Any information and/or content is intended entirely for research, educational and informational purposes only and does not constitute investment or consultation advice or investment strategy. The information is not tailored to the investment needs of any specific person and therefore does not involve a consideration of any of the investment objectives, financial situation or needs of any viewer that may receive it. Kindly also note that past performance is not a reliable indicator of future results. Actual results may differ materially from those anticipated in forward-looking or past performance statements. We assume no liability as to the accuracy or completeness of any of the information and/or content provided herein and the Company cannot be held responsible for any omission, mistake nor for any loss or damage including without limitation to any loss of profit which may arise from reliance on any information supplied by Signal Centre.

ETHUSD💥4H-TIMEFRAME ANALYSISETHUSD💥4H-TIMEFRAME ANALYSIS
💗Hello ladies and gentlemen
This is my new idea for 💥ETHEREUM
I hope my idea is clear
Support me by like and share thank you
Stay Safe💯💲💲💲
Good luck💰😍

ETH Drop to $1430* before going Higher or LowerI reckon this is in play for Ethereum.
Here are my reasons:
1. BTC & ETH are at strong resistances.
2. Perfect retest of H8 OB for ETH.
3. Lots of Selling Pressure.
4. SPX is at a strong resistance, likely to drop.
5. DXY showing inverse head and shoulders reversal pattern at resistance.
6. Price likes to test main diagonal resistances before making the next move. This is for a liquidity grab to fuel the next move.
I am shorting to these levels. NFA
Risk Management is important.

ETH - 2 Selling Strategies from AC BYBIT:ETHUSDT.P
1H time frame
-
After breaking out downtrend on 1 Day time frame . ETH is forming an ascending channel on 1H .
With this bearish pattern, we can set two different trading strategies as below.
-
1.
Entry: if getting resistance form upper trend again(~1605)
TP: 1525 or reach lower uptrend
SL: previous high(~1615)
2.
Entry: BO the AC(~1540)
TP: 1400, 1350
SL: if go back to the AC(~1560)
-
Notice: All price are set from the predicted trend, can set it more accurate based on the actual trend/pattern after opening short

ETHEREUM WYCKOFF UPDATES
Perfect Ideas on my previous.. did you catch?
Now im watching on LPSY moves. the drop base drop.
Thanks to all who follow, if you like my ideas give a like or comment for it.
Trade only base on your own decissions.
Check me out I give free journal and analysis daily.
