ETHEREUM Perhaps the easiest long out there.Ethereum (ETHUSD) is consolidating just above the Buy Zone of the Mayer Multiple Bands (MMBs) where it rebounded on its April bottom.
Throughout its historic price action, every time it hit this Zone and rebounded, it reached at least the bottom of its Mean MM zone (red Zone).
As a result, $4000 towards the end of the year may be the easiest Target in the market right now.
-------------------------------------------------------------------------------
** Please LIKE 👍, FOLLOW ✅, SHARE 🙌 and COMMENT ✍ if you enjoy this idea! Also share your ideas and charts in the comments section below! This is best way to keep it relevant, support us, keep the content here free and allow the idea to reach as many people as possible. **
-------------------------------------------------------------------------------
💸💸💸💸💸💸
👇 👇 👇 👇 👇 👇
Ethusdsignals

ETHEREUM Massive rally up ahead.Ethereum (ETHUSD) is trading on its 1M MA50, having recovered half of the Trade War losses. Still underperforming against most of its peers but as we've entered the 2nd half of the year, the traditional Bull Cycle rally is up ahead. We expect at least a 0.5 Fibonacci level test of the Channel Up, targeting 7500.
-------------------------------------------------------------------------------
** Please LIKE 👍, FOLLOW ✅, SHARE 🙌 and COMMENT ✍ if you enjoy this idea! Also share your ideas and charts in the comments section below! This is best way to keep it relevant, support us, keep the content here free and allow the idea to reach as many people as possible. **
-------------------------------------------------------------------------------
💸💸💸💸💸💸
👇 👇 👇 👇 👇 👇

ETHEREUM Battling to hold its 1D MA50.Ethereum (ETHUSD) has been trading within a 5-week Channel Up pattern and in the past 2 days almost tested its 1D MA50 (blue trend-line). So far this is holding, showcasing the strong presence of buyers in that price region, which also happens to be the bottom of that Channel Up.
Ahead of a 1D Golden Cross that may potentially be formed in a week or so, this is the strongest buy signal we get since the April 09 bottom. Given also that the price is trading close to the 0.5 Fibonacci retracement level from the December 16 2024 High, the upside potential is significant. The obvious medium-term Target is that High at 4100.
-------------------------------------------------------------------------------
** Please LIKE 👍, FOLLOW ✅, SHARE 🙌 and COMMENT ✍ if you enjoy this idea! Also share your ideas and charts in the comments section below! This is best way to keep it relevant, support us, keep the content here free and allow the idea to reach as many people as possible. **
-------------------------------------------------------------------------------
💸💸💸💸💸💸
👇 👇 👇 👇 👇 👇

ETHEREUM This Megaphone emerged on all previous Cycles.Ethereum (ETHUSD) is showing incredible strength at the moment as it broke above its 1W MA50 (blue trend-line) and its goal now will be to close the week above it.
This resembles May 2020 and January 2017 when again the price was struggling to break above its 1W MA50, all within a similar Megaphone pattern, and eventually succeeding. The similarities among those 3 patterns so far are striking despite being formed on different Cycles.
As you can see, we are currently on the 0.618 Fibonacci level of the Megaphone, which is exactly where ETH was during the other 2 Cycles when it tested the 1W MA50 and broke out. Once the 1W MA50 turned into Support, the market never looked back and initiated the parabolic rallies of 2020/ 2021 and 2017.
Based on that, we expect ETH to test the 1.5 Fibonacci extension, around $7000.
-------------------------------------------------------------------------------
** Please LIKE 👍, FOLLOW ✅, SHARE 🙌 and COMMENT ✍ if you enjoy this idea! Also share your ideas and charts in the comments section below! This is best way to keep it relevant, support us, keep the content here free and allow the idea to reach as many people as possible. **
-------------------------------------------------------------------------------
💸💸💸💸💸💸
👇 👇 👇 👇 👇 👇

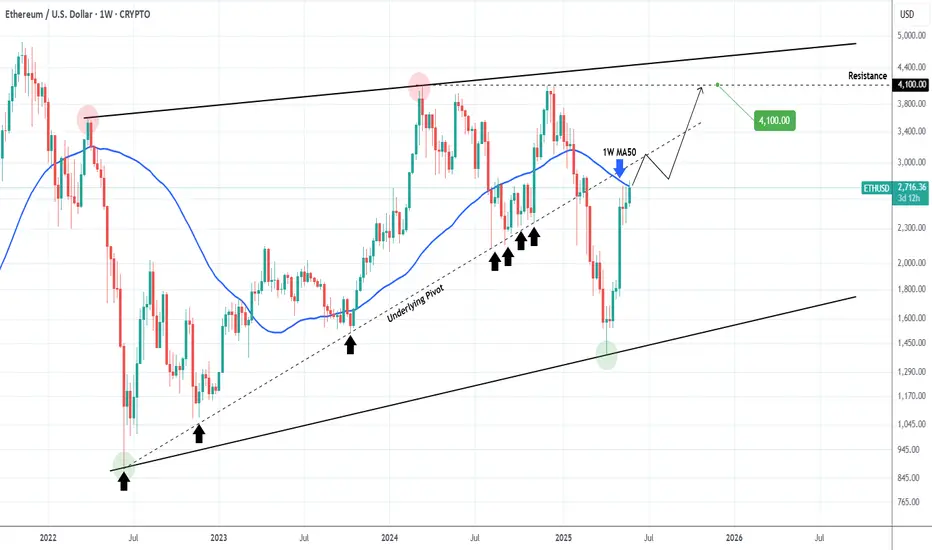
ETHEREUM Break above this level and things get real interesting!Ethereum (ETHUSD) broke above its 1W MA50 (blue trend-line) this week and will attempt to close the week above it to confirm the official restoration of the long-term bullish trend.
Regardless of that, there is another hidden trend-line that may dictate the pace of that potential bullish break-out and is no other than the underlying Pivot trend-line that started on the June 13 2022 market bottom and acted as Higher Lows up until February's Tariff fueled correction.
As a result, this is now posing as a Resistance and a break above it should technically deliver rallies similar to the Bullish Legs of 2023 - 2024.
Our 4100 Target remains intact.
-------------------------------------------------------------------------------
** Please LIKE 👍, FOLLOW ✅, SHARE 🙌 and COMMENT ✍ if you enjoy this idea! Also share your ideas and charts in the comments section below! This is best way to keep it relevant, support us, keep the content here free and allow the idea to reach as many people as possible. **
-------------------------------------------------------------------------------
💸💸💸💸💸💸
👇 👇 👇 👇 👇 👇
ETH/USD – Key Support Holding, Eyes on 3000 for Upside TargetEthereum is maintaining a strong bullish structure within a clearly defined ascending channel. Recent price action shows a successful retest of the lower channel boundary and the horizontal support zone around 2477 – 2450.
🔹 Support & Trendline Confluence:
The support zone at 2477–2450 is aligned with the lower boundary of the rising channel.
Multiple successful retests of this trendline indicate strong demand in this area.
🔹 Bullish Scenario:
As long as the 2477–2450 support zone holds, ETH/USD has a good chance to resume its upward move.
The next target for bulls is the 161.8% Fibonacci extension level at 2997.24, which coincides with the upper channel boundary.
📌 Plan:
Long positions are favored as long as price holds above 2450.
Targeting 2997, with intermediate steps of confirming higher lows.
📉 Invalidation:
A break and daily close below 2450 would invalidate this bullish scenario and suggest further downside.
This is a classic “buy-the-dip” scenario within an established uptrend, offering a favorable risk/reward opportunity.

ETHEREUM Massive rejection on the 1W MA50. Will it break?Ethereum (ETHUSD) has seen its strongest 1-month rise in recent times since the April 07 rebound and last week that stopped and got rejected exactly on the 1W MA50 (blue trend-line). This rebound is technically the new Bullish Leg of the multi-year Rising Wedge.
The 1W MA50 turned into a Resistance when it last broke on the week of January 27 2025, so almost 4 months ago. Once it breaks and closes a 1W candle above it, we can continue to expect the bullish trend to continue by at least as much as the rise below it (that happened in late 2024).
Technically for now, if it breaks, the upside is limited by the 4100 Resistance, so that will be our Target in that event.
-------------------------------------------------------------------------------
** Please LIKE 👍, FOLLOW ✅, SHARE 🙌 and COMMENT ✍ if you enjoy this idea! Also share your ideas and charts in the comments section below! This is best way to keep it relevant, support us, keep the content here free and allow the idea to reach as many people as possible. **
-------------------------------------------------------------------------------
💸💸💸💸💸💸
👇 👇 👇 👇 👇 👇

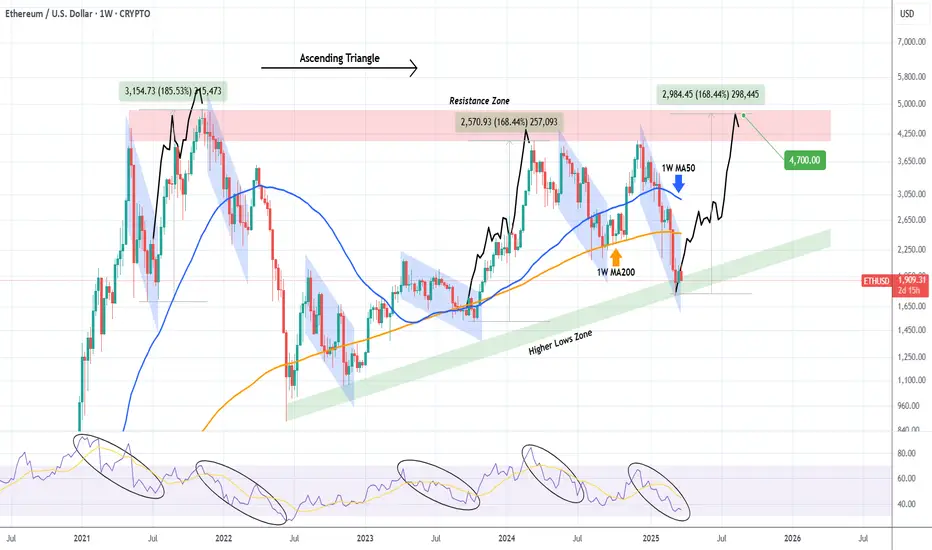
ETHEREUM Ascending Triangle bottomed and is targeting $4700.Ethereum (ETHUSD) hit 2 weeks ago the bottom (Higher Lows Zone) of its 4-year Ascending Triangle pattern, following the recent 3-month correction. That correction has technically been the pattern's Bearish Leg and during those 4 years we've had another 5 similar to this, all with the exception of one, producing a Higher High.
This is actually more similar to the October 09 2023 and June 21 2021 bottoms, so at worst we should get a +168.44% rally from here that will interestingly enough test the Triangle's top (Resistance Zone) a $4700.
-------------------------------------------------------------------------------
** Please LIKE 👍, FOLLOW ✅, SHARE 🙌 and COMMENT ✍ if you enjoy this idea! Also share your ideas and charts in the comments section below! This is best way to keep it relevant, support us, keep the content here free and allow the idea to reach as many people as possible. **
-------------------------------------------------------------------------------
💸💸💸💸💸💸
👇 👇 👇 👇 👇 👇
ETHEREUM Megaphone bottom like March 2020Ethereum (ETHUSD) is currently on the first week of rebound after 3 straight red weeks when it was unable to break above the 1W MA50 (blue trend-line). This is taking place on a Lower Lows trend-line, technically the bottom of a 1-year Megaphone since the March 11 2024 High.
The market is no stranger to long-term Megaphone consolidation periods like that as last time we saw this was on the June 2019 - March 2020 Megaphone, which eventually broke upwards after the brutal COVID crash Bearish Leg that touched bottom. This is quite similar to the current Bearish since late December. Notice how perfectly aligned the Fibonacci retracement levels are.
Based on this, we expect at least a 1.5 Fibonacci extension test at $6000 before this Cycle tops at the end of the year.
-------------------------------------------------------------------------------
** Please LIKE 👍, FOLLOW ✅, SHARE 🙌 and COMMENT ✍ if you enjoy this idea! Also share your ideas and charts in the comments section below! This is best way to keep it relevant, support us, keep the content here free and allow the idea to reach as many people as possible. **
-------------------------------------------------------------------------------
💸💸💸💸💸💸
👇 👇 👇 👇 👇 👇

ETHEREUM (ETHUSD): Bullish Continuation Confirmed
I think that ETHEREUM is going to rise.
A double bottom pattern formation on a key daily/intraday support
and a bullish breakout of its neckline show a strong buying interest.
The market is going to reach 2495 level soon.
❤️Please, support my work with like, thank you!❤️

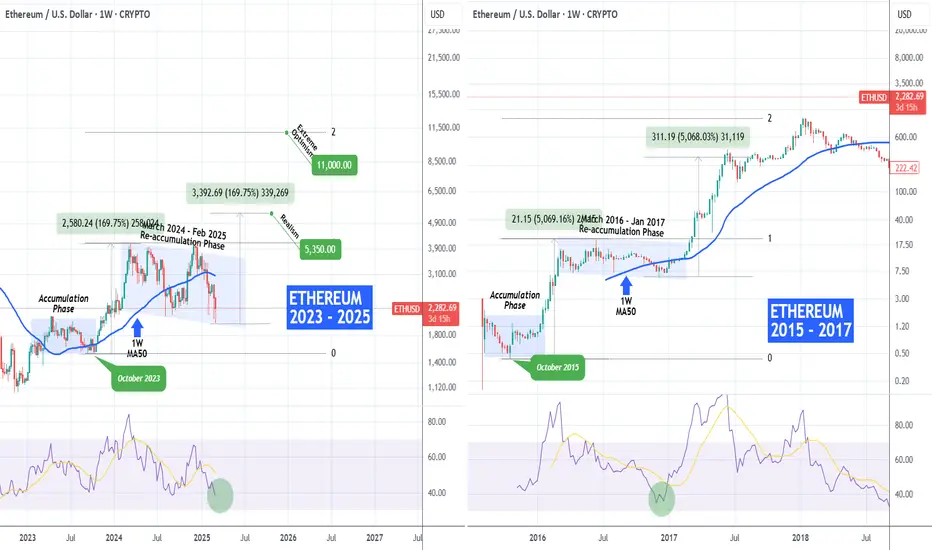
ETHEREUM Is a massive rally about to begin?Ethereum (ETHUSD) started the week lower but is attempting a closing near last week's candle close. Still below its 1W MA50 (blue trend-line) but the practically ranged price action of the past 12 months (March 2024 - Feb 2025) may be a Re-accumulation Phase similar to ETH's first Cycle when between March 2016 - Jan 2017 it consolidated but then started a massive rally until the end of the year.
As you can see, the two fractals are fairly similar, both starting with an initial Accumulation Phase. In the 2015 - 2017 Bull Cycle, the rally that followed the October 2015 Low was fairly symmetrical (+5069%) with the rally that followed the Re-accumulation Phase's bottom. The Cycle Top was priced higher on the 2.0 Fibonacci extension.
If ETH keeps replicating this past fractal, we can expect a more realistic Target at $5350 (+169.75% rise) and an extremely optimistic at $11000 (Fib 2.0 extension).
-------------------------------------------------------------------------------
** Please LIKE 👍, FOLLOW ✅, SHARE 🙌 and COMMENT ✍ if you enjoy this idea! Also share your ideas and charts in the comments section below! This is best way to keep it relevant, support us, keep the content here free and allow the idea to reach as many people as possible. **
-------------------------------------------------------------------------------
💸💸💸💸💸💸
👇 👇 👇 👇 👇 👇
ETHEREUM trapped between MAs but preparing a massive surge.Ethereum (ETHUSD) has been trading since the start of the year within the 1D MA50 (blue trend-line) and 1D MA200 (orange trend-line). Despite this technical 'trap', there are two bullish patterns that outweigh this range and those are primarily the Channel Up since the July 18 2022 market bottom and in the last 10 months an Inverse Head and Shoulders (IH&S) pattern.
The latter is in the process of forming the Right Shoulder and as long as the 1D MA200 holds, it should complete it within 6 weeks maximum. On top of that, we have a recently formed 1D Golden Cross and in terms of 1W RSI, we are on similar grounds as January 2024.
On all cases, a strong rally followed in the form of the Channel's Bullish Leg. Assuming it follows the technical target of the IH&S, we are expecting a peak on the 2.0 Fibonacci extension at $7400.
-------------------------------------------------------------------------------
** Please LIKE 👍, FOLLOW ✅, SHARE 🙌 and COMMENT ✍ if you enjoy this idea! Also share your ideas and charts in the comments section below! This is best way to keep it relevant, support us, keep the content here free and allow the idea to reach as many people as possible. **
-------------------------------------------------------------------------------
💸💸💸💸💸💸
👇 👇 👇 👇 👇 👇

ETHEREUM The Parabolic Rally to $10k has started!Ethereum (ETHUSD) is having a strong recovery rebound this week after marginally breaking below the 1W MA50 (blue trend-line) earlier. This indicates enormous buying pressure on the Bull Cycles first core Support level (the second being the 1M MA50 (red trend-line) which supported twice last Aug/Sep).
In comparative terms, relative to ETH's previous Bull Cycle, we are around the October 2020 levels, which was the last consolidation before the Cycle's main Parabolic Rally started. This is also evident on the 1W RSI fractals among the two. The rally exceeded by a small margin the 1.5 Fibonacci extension and formed the Cycle Top.
As a result, we expect ETH to hit at least the $10k level before this Cycle tops towards the end of the year. Technically, we should see the 1W MA50 support until the end.
-------------------------------------------------------------------------------
** Please LIKE 👍, FOLLOW ✅, SHARE 🙌 and COMMENT ✍ if you enjoy this idea! Also share your ideas and charts in the comments section below! This is best way to keep it relevant, support us, keep the content here free and allow the idea to reach as many people as possible. **
-------------------------------------------------------------------------------
💸💸💸💸💸💸
👇 👇 👇 👇 👇 👇

ETHEREUM (ETHUSD): Bullish Continuation Confirmed
It looks like ETH is going to continue growing.
I see a strong bullish signal on a daily:
a breakout of a neckline of an ascending triangle pattern.
Next resistances: 3790 / 4000
❤️Please, support my work with like, thank you!❤️

ETHEREUM Is this the parabolic rally to $11500?Ethereum (ETHUSD) gave us the perfect bottom buy entry on its 1M MA50 (red trend-line) last time we gave a signal on it (September 03, see chart below):
As you see this time on the 1W time-frame, following the last week the price saw the strongest weekly candle rise of the whole Bull Cycle, breaking and closing above its 1W MA50 (blue trend-line) for the first time since July 29 2024.
On top of that, the 1W MACD completed last week a Bullish Cross, the first since October 30 2023 (i.e. a year ago). That Cross was the final buy signal confirmation of the very aggressive multi-month rally that topped in March 2024. As a result, the current Bullish Cross should also be treated the signal we've been waiting to confirm the new Bullish Leg.
This time however, we are at this stage of the Bull Cycle where 4 years ago during the previous one, ETH started its Parabolic Rally, the most aggressive part of the Cycle. As you can see, in November 2020 the price was also above the 1W MA50, the 0.5 Fib and past a 1W MACD Bullish Cross. Also 1000 days have past since the previous Cycle Top, similar to this time also.
The rally that started then (Nov 2020) peaked marginally above the 1.5 Fibonacci extension, forming a top of the Higher Highs trend-line. As a result, we can expect ETH to target a new Cycle Top at $11500 (Fib 1.5 ext).
-------------------------------------------------------------------------------
** Please LIKE 👍, FOLLOW ✅, SHARE 🙌 and COMMENT ✍ if you enjoy this idea! Also share your ideas and charts in the comments section below! This is best way to keep it relevant, support us, keep the content here free and allow the idea to reach as many people as possible. **
-------------------------------------------------------------------------------
💸💸💸💸💸💸
👇 👇 👇 👇 👇 👇

ETHEREUM Closed August above 1M MA50, keeping bullish case aliveEthereum (ETHUSD) may have completed three straight red months (1M candles) but despite the recent correction, managed to close August above the 1M MA50 (blue trend-line), in spite of touching it earlier within the month.
This is a key Support level as it also held during the August - October 2023 bottom formation, initiating the multi-month rally up until March 2024. This makes it a long-term Support and as long as it is holding, it is keeping ETH within bullish territory.
At the same time, the price also held the 0.5 Fibonacci retracement level from the Cycle bottom. The last time that happened was during the previous Cycle in September - October 2020. After it held, this kick-started the Cycle's Parabolic Rally to just above the 1.5 Fibonacci extension level.
As a result, as long as the 1M MA50 is holding, we can expect the next High to be as high as 11500, even though 8k would seem more reasonable in terms of market cap and thus feasible as a long-term Target.
-------------------------------------------------------------------------------
** Please LIKE 👍, FOLLOW ✅, SHARE 🙌 and COMMENT ✍ if you enjoy this idea! Also share your ideas and charts in the comments section below! This is best way to keep it relevant, support us, keep the content here free and allow the idea to reach as many people as possible. **
-------------------------------------------------------------------------------
💸💸💸💸💸💸
👇 👇 👇 👇 👇 👇

ETHEREUM ETFs are live! Is a new era of growth emerging?United States Ether exchange-traded funds (ETFs) posted net inflows of $106.6 million on their first day of trading. Ethereum (ETHUSD) saw the massive inflows led by BlackRock, Bitwise and Fidelity overcome the outflows from Grayscale and that may have set the tone of a new ear of growth for the market.
Much like Bitcoin's ETF launch back in January, ETH may see a similar rally that can finally take it past its All Time High (ATH). As you can see on this 1W time-frame chart, the post BTC ETD approval rally on January led to March's High. Another such Leg can see ETH past $5000 by September.
Apart from the undoubtedly great ETF news, this chart shows Ethereum's cyclical behavior, and as you can see, relative to the previous Cycle, its upside potential rests a little above the 1.5 Fibonacci extension level. That was the spot where the November 2021 ATH was priced. Our long-term Target range remains $10000 - $12000.
-------------------------------------------------------------------------------
** Please LIKE 👍, FOLLOW ✅, SHARE 🙌 and COMMENT ✍ if you enjoy this idea! Also share your ideas and charts in the comments section below! This is best way to keep it relevant, support us, keep the content here free and allow the idea to reach as many people as possible. **
-------------------------------------------------------------------------------
💸💸💸💸💸💸
👇 👇 👇 👇 👇 👇

ETHUSDT BUY ANALYSIS Here on ETHUSDT price has been moving down and has made a correction at support level of 3,710.86 so is like to move up for the level has been respected very so going for LONG is needed and targeting profits should be around 3,777.59

ETHEREUM Will an ETF approval cause a massive rally?Exactly a month ago (April 22, see chart below), we called for Ethereum's (ETHUSD) bottom and gave a medium-term buy signal:
With the SEC facing deadlines on May 23 and May 24 to decide on spot Ethereum ETF applications by Vaneck and Ark Invest, we might be in front of a massive rally. Even from a technical point of view, the historic Cycle performance of Ethereum suggests that currently we might be getting off a similar consolidation to August - October 2020.
Observe how the 1W RSI is making a bullish reversal after having pulled-back from a marginal Channel Up break-out. At the same time, the 1W LMACD is about to make the exact same Bullish Cross it did on the week of November 09 2020, when again it started to break above that consolidation.
What followed these events back then was a massive rally that peaked marginally above the 1.5 Fibonacci extension level. As a result, we remain bullish long-term, expecting a strong rise until the end of the year, targeting $12000 (Fibonacci 1.5 ext).
-------------------------------------------------------------------------------
** Please LIKE 👍, FOLLOW ✅, SHARE 🙌 and COMMENT ✍ if you enjoy this idea! Also share your ideas and charts in the comments section below! This is best way to keep it relevant, support us, keep the content here free and allow the idea to reach as many people as possible. **
-------------------------------------------------------------------------------
💸💸💸💸💸💸
👇 👇 👇 👇 👇 👇

ETHUSD BUY MORE FROM BUYING ZONE !!HELLO TRADERS!!
ETHUSD now trading above the strong support zone and it has already tested it can move easily till 3000$ if it hold the support zone its is trading in a bullish trend and we can say it will continue till design levels this week FOMC meeting also coming the decision of US interest rates can create a volatility in the markets our risk reward ratio is great in this trading idea do a proper analysis before any trade share your thoughts with us it help traders community STAY TUNED ! for more updates

ETHEREUM Massive support cluster on this Bull Flag. Target 10k??Ethereum (ETHUSD) traded exactly the way we wanted it last time we looked at it (January 09, see chart below)
At the moment, the price is trading below the 1D MA50 (blue trend-line), having recovered the 1D MA100 (green trend-line) on what was a bottom on the 6-month Bullish Megaphone. This Higher Low was almost priced on the 0.382 Fibonacci level.
That is similar to the June 15 2023 Bullish Megaphone Higher Low on the 0.382, which as it held the 1D MA200 (orange trend-line), it pushed the price to a rebound. However the 1D MA200 was broken (closed a 1D candle below) after and ETH had to find Support on the 0.5 Fib before it started the current Megaphone. The peak came almost on the -1.00 Fibonacci extension.
As a result, as long as Ethereum keeps the 1D MA200 intact, we are bullish. If it closes even a single candle under the 1D MA200, we will wait for a comfortable buy on the 0.5 Fib (2500). On both cases, the Target is $10000 (Fib -1.00 extension).
-------------------------------------------------------------------------------
** Please LIKE 👍, FOLLOW ✅, SHARE 🙌 and COMMENT ✍ if you enjoy this idea! Also share your ideas and charts in the comments section below! This is best way to keep it relevant, support us, keep the content here free and allow the idea to reach as many people as possible. **
-------------------------------------------------------------------------------
💸💸💸💸💸💸
👇 👇 👇 👇 👇 👇

Eth established strong floor. Rise to 4k next?Like the entire crypto market, BITSTAMP:ETHUSD has initiated a much-needed correction since mid-March.
After an initial dive to the 3k zone, Ethereum recovered and made a local high at 3.6k. Subsequently, another drop occurred, but bulls held strong at the 3.2k zone, establishing a solid floor.
At the time of writing, the price is near 3.4k, and bulls appear to be in control. I anticipate a continuation to the upside, with a new test of the 4k resistance level.
I will maintain my bullish stance as long as the price remains above 3.2k in terms of daily closing.

ETCUSD new rally starting towards $50.Ethereum Classic (ETCUSD) has started to rise again, so far being on the 2nd straight green 1D candle, without breaking the key 1D MA100 (green trend-line), which has been supporting since essentially the October 23 2023 break-out.
As long as this holds and ETC keeps closing the 1D candles above the 1D MA100, we expect a new cyclical rally to start within the Fibonacci Channel Up. The last one was +83.17% from its Higher Low, so a repeat would give us $49.00 by May.
-------------------------------------------------------------------------------
** Please LIKE 👍, FOLLOW ✅, SHARE 🙌 and COMMENT ✍ if you enjoy this idea! Also share your ideas and charts in the comments section below! This is best way to keep it relevant, support us, keep the content here free and allow the idea to reach as many people as possible. **
-------------------------------------------------------------------------------
💸💸💸💸💸💸
👇 👇 👇 👇 👇 👇
