The Unicorn Breakout Part II – Ethereum at $4K, Queen of Crypto🦄👑 The Unicorn Breakout Part II – Ethereum at $4K, Queen of Crypto 📈♟
I’ve had a lot of conversations these past months.
Some friends told me ETH had no power, no influence.
One even called it the “bitch coin.”
Others insisted it lacked dynamics, that it was doomed to trail behind Bitcoin forever.
But the chart… the chart said otherwise.
That’s why, as a trader, so often I close my ears and follow the chart.
📜 The Recap
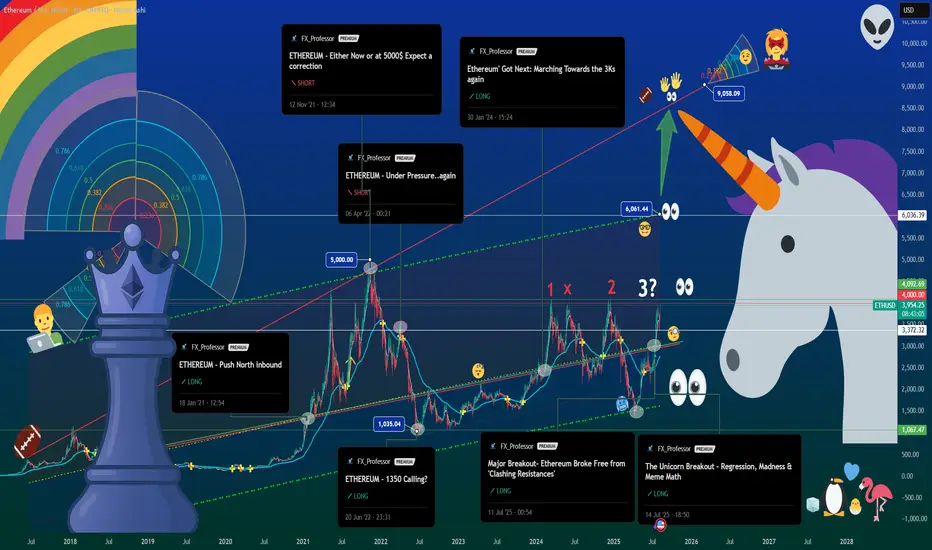
From “Push North” in 2021, to the “1-2-X” setup, and the July Unicorn prophecy, ETH has kept its dance inside the quadratic regression channel for over 7 years.
In Part I, we called $4,000 the first milestone. Now, it’s reality.
♟ Bitcoin is King, Ethereum is Queen
With recent leadership changes bringing renewed energy and sharper marketing, plus the Petra upgrade quietly powering under the hood, ETH is stepping into the place it deserves. The queen is the most powerful piece on the chessboard — and in this market, Ethereum is moving exactly like one.
📊 What’s Different This Time
-Network activity is pushing toward record levels.
-Transaction counts are surging, signaling deeper engagement.
-The ETH vs BTC conversation is back, and capital rotation is happening in real time.
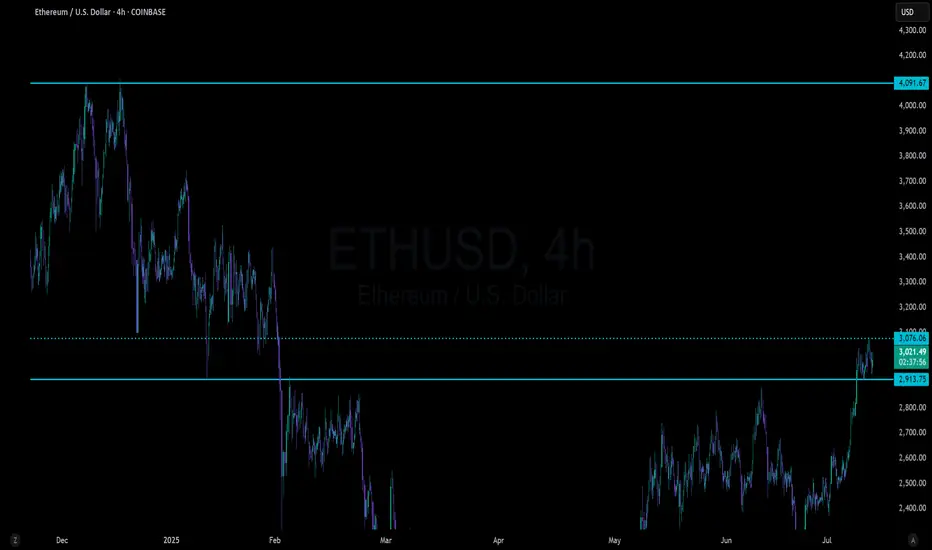
🛠 Levels I’m Watching:
$4,092 – Current resistance zone.
$6,034 – Mid-regression line, the next battleground.
$8,674 – Unicorn Zone. Euphoric breakout territory.
$3,372 – Short-term support. Below here, $2,912 is on deck.
💙 The Human Note
This run is proof: conviction matters. Sometimes the crowd is wrong, the noise is deafening, and the chart is the only friend that tells the truth.
Trade with discipline, but live with intention. Spend time with those you love. Build things worth remembering. And when you play the game, know when to move your queen.
The Unicorn has hit $4K. The Queen has entered the center.
Next move? Checkmate at $6K? We’ll see.
One Love ,
The FX PROFESSOR 💙
Disclosure: I am happy to be part of the Trade Nation's Influencer program and receive a monthly fee for using their TradingView charts in my analysis. Awesome broker, where the trader really comes first! 🌟🤝📈
ETHUSDT
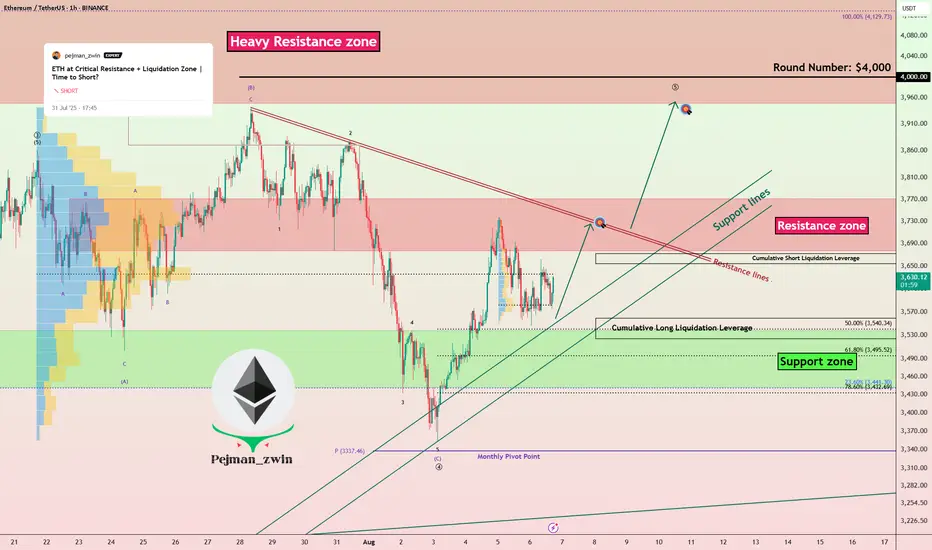
Ethereum Ready to Attack Resistances — Time to Long ETH?Ethereum ( BINANCE:ETHUSDT ) fell to the Support zone($3,538-$3,442) and Support lines as I expected in the previous idea .
Ethereum is currently trading near the Support zone($3,538-$3,442) , Support lines , and Cumulative Long Liquidation Leverage($3,559-$3,524) .
In terms of Elliott Wave theory , it seems that Ethereum has completed the main wave 4 . The main wave 4 has an Expanding Flat structure(ABC/3-3-5) . To confirm the main wave 4, we must wait for the Resistance zone($3,771-$3,677) and Resistance lines to be broken.
I expect Ethereum to trend higher in the coming hours and attack the Resistance lines and Resistance zone($3,771-$3,677) .
Cumulative Short Liquidation Leverage: $3,672-$3,645
Note: Stop Loss: $3,450 =Worst
Please respect each other's ideas and express them politely if you agree or disagree.
Ethereum Analyze (ETHUSDT), 1-hour time frame.
Be sure to follow the updated ideas.
Do not forget to put a Stop loss for your positions (For every position you want to open).
Please follow your strategy and updates; this is just my Idea, and I will gladly see your ideas in this post.
Please do not forget the ✅' like '✅ button 🙏😊 & Share it with your friends; thanks, and Trade safe.
Ethereum vs Small Cap. & The 2025-26 Cryptocurrency Bull MarketThe last three days ended up being a very nice flush, a strong one but the action quickly recovered above the 18-May low.
Ethereum was trading above $2,300 since mid-May and always stayed above this level. It broke suddenly below, out of nowhere, but the action is bullish again. We can say that this was a stop-loss hunt event, a bear-trap and nothing more or else we would see a continuation of the bearish action rather than a strong inverse reaction, a bullish jump.
It is not only Ethereum of course that is experiencing this type of bullish action, some altcoins are going nuts. Really crazy right now producing so much momentum that people are still wondering if the market is going down... Or is it going up?
It is obviously up, just look at the 7-April low.
Ethereum hit a low of $1,385 on 7-April. The higher low yesterday ended at $2,111.
You see what I mean?
The market is ultra-bullish because the last low is so far away. It is impossible that it will be tested even less possible for it to break. Ok, so a market shakeout we agree but now that the shakeout is complete what is supposed to happen next?
Watch the smaller altcoins.
Thank you for reading.
Namaste.
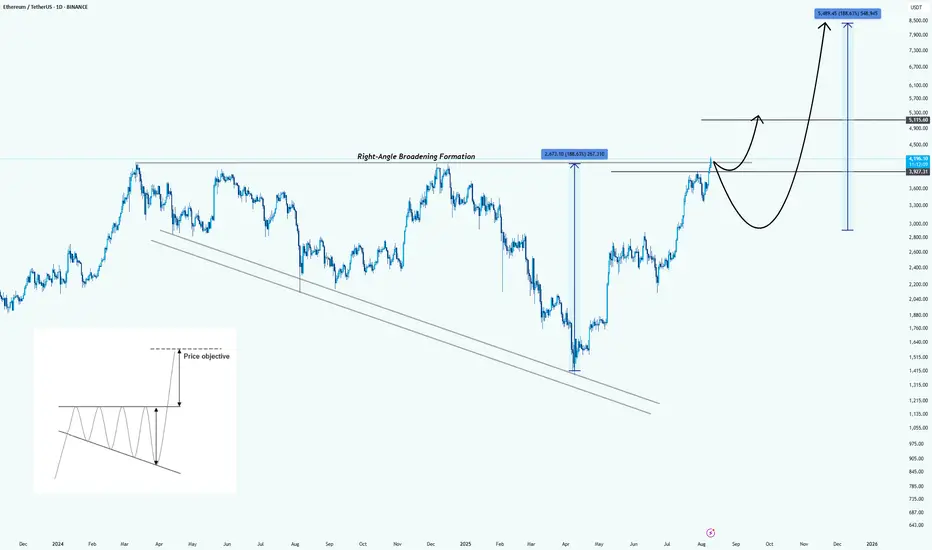
Ethereum: Formed a Right-Angle Broadening FormationHello guys!
Pattern Identified:
This is a Right-Angle Broadening Formation (characterized by a flat resistance level at the top (around $4,200 – $4,300) and a rising lower trendline). It shows increasingly volatile swings upward while repeatedly testing the same ceiling.
Technical Implication:
RABFs are typically bullish continuation patterns. The flat top acts as a breakout trigger, while the rising base indicates consistently higher lows and aggressive buyer support.
Price Objective:
According to the pattern’s measured move principle, the breakout target is projected by the vertical height of the formation, added to the breakout point:
Height : $2,070
Breakout point : $4,300
Target : $6,370 (first objective)
Extended bullish run could reach $8,500 if momentum sustains.
Key Levels:
Resistance: $4,200 – $4,300 (breakout trigger)
Support: $3,700, then $3,200
First measured target: $6,370
Extended target: $8,500
Bullish Scenario:
Strong daily close above $4,300 with volume could kickstart a rapid move toward the first target, possibly with only a brief consolidation at $5,100 before continuation.
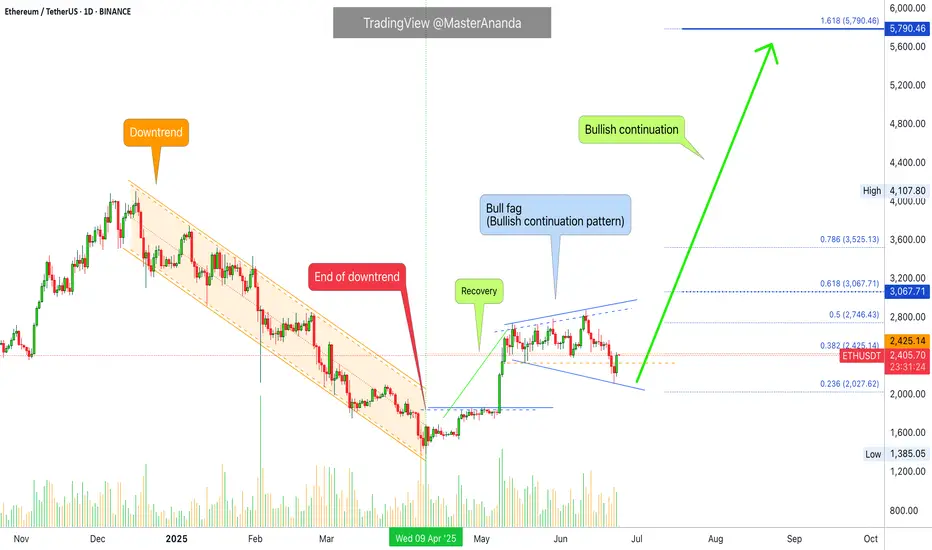
ETH all time high or reverse????Ethereum has returned to the top after a long time and is on the verge of breaking the top, but in my opinion this will not happen. Of course, it is possible to see new prices, but then it will enter a correction and this will happen in the next move that will start in the future.
So we should wait for a very good entry with a cheap and lower price.
Stay with me and boost me after introducing me to your friends.
Here I go long on Ethereum at $4,000Here I go long on Ethereum at $4,000
time to make Ethereum great again By borrowing more tethers and placing market orders triggering Ethereum supply shock
right now.
borrowing and placing market orders starting at $4,000.
tether's reserves are hitting Ethereum hard through me here now.
I think I'm triggering the major Ethereum supply shock here now.
THE MAJOR ETHEREUM SUPLLY SHOCK IS HAPPENING HERE NOW.
Cut the random guesses and hopes and just let the pro do it AT THE RIGHT TIME.
MEGA
I wanna make ethereum great again and it's going to be today and it's going to be now. And old btc prices will become new eth prices
Now Ethereum run is officially confirmed by the same director that triggered bitcoin and ripple supply shock.The Martin Scorcese of the market.
birdman sharkman
CASH MONEY HEROES
when i hit ni* hit me full of that caaaash
more money than I seen in a garbage caaan
stunna island money and the power
That's how we do it make it rain make it shower
ETH | NEW ATH or DUMP ?Ethereum recently peaked at $3900. And allthough this is not a new ATH (close by a few hundred dollars), it is a local high for the year.
My last update was on an inverse Head and Shoulders pattern on ETH, which has since increased over 50%:
(The original idea here:)
The question now, is what's next for ETH - further increase, or are the increases over for the near term and is a correction more likely?
I'm going to say that the increases for ETH are over for now. This is because we correction is most definitely due after such a large increase in a fairly short timeframe. I'm not saying we're heading into a full out bearish cycle, but a 20-25% correction would be most normal at this point.
Additionally, XRP has also made it's peak and lost the high, now trading just under $3. This is a strong sign that the alts have likely already rallied, since XRP used to be the last to increase (if it increased at all, historically. (Thanks Jedd).
I was very lucky to call that top here:
Either way, buyers may use this correction to scoop up on smaller alts over the next few weeks. This ultimately depends on whether the market has ONE MORE pump, and if the correction will bounce back from a 20-25% pullback.
_________________
BINANCE:ETHUSDT

Ethereum Hits a New All-Time High? Altcoins Bull MarketEthereum just hit its highest price since December 2024. Here is the thing, first XRP moves forward and we know the rest of the market will do the same. We saw this happen with Bitcoin Cash, it just kept on moving straight up and with this we knew the rest of the market to do the same. Then we have Litecoin and now Ethereum keeps on going higher. What one does, the rest follows.
Crypto will continue to grow; the altcoins will continue to grow and because the altcoins are growing Bitcoin will also continue growing. The altcoins growing and moving forward confirms that Bitcoin's top is not in, far from this being the case. So, Ether will continue to grow, Bitcoin will continue to grow and the smaller altcoins will follow.
Watch Solana go next and Dogecoin. Litecoin will be big of course. If you buy Litecoin now below $200, you will do good when Litecoin trades at $1,000 plus. The thing is that the next advance will change everything with the ETFs. Each time there is a bear market there is a crash and flush you can always buy again at market bottoms and lows. When a Crypto gets ETFs, corrections will not be the same. Demand will be too strong and we will experience long-term growth. Something like how Bitcoin is behaving now but also on some major altcoins. There will continue to be and appear new variations across the market. The altcoins will separate into different groups and cycles. The broader market cycle will continue to evolve. Things will never stay the same. Change is the only constant.
Namaste.

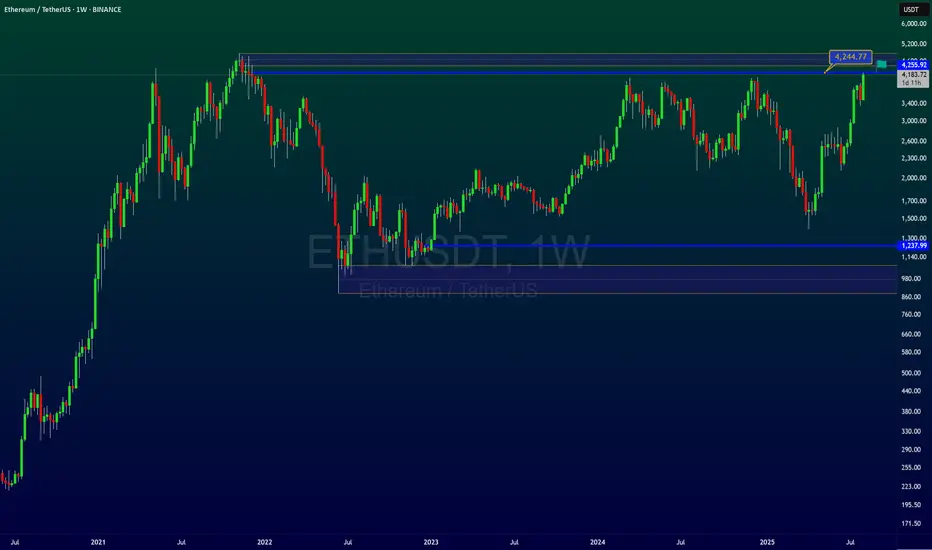
ETH/USDT — Resistance Around $4.0k: Breakout or Rejection?Summary
The weekly chart shows Ethereum testing a multi-year horizontal resistance zone around $3.9k–$4.1k, a level repeatedly tested since 2021. The measured move on the chart projects a potential target of $4,868 — about +$868 or ~21–22% upside — if a confirmed breakout occurs on the weekly timeframe.
---
Technical Analysis (based on chart)
Timeframe: Weekly (1W). The current test is highly significant due to the higher timeframe, with medium- to long-term implications.
Key Levels:
Major resistance zone: ≈ $3,950 – $4,100 (yellow line).
Breakout target: $4,868 (≈ +$868 or ~+21–22% from the breakout zone).
First support if rejected: ≈ $3,300 – $3,600. Stronger support at $2,100 – $2,750.
Price Action: Price has made multiple peaks at this zone (multiple tops), signaling strong supply. However, recent higher lows suggest growing bullish momentum — if a breakout occurs.
Pattern: Multi-year horizontal resistance. Possible outcomes:
Rejection: Acts as a triple-top / horizontal supply zone.
Breakout: Transitions into a range breakout setup with measured target.
---
Bullish Scenario (confirmation needed)
1. Confirmation signal: Weekly close above $4.0k zone with strong follow-through in the next week.
2. Entry strategies:
Conservative: Wait for a retest (resistance → support) before entering, with stop below retest (~$3.7k).
Aggressive: Enter on breakout, stop below breakout candle low.
3. Target: First target ~$4,868 (measured move). If momentum persists, higher targets may be reached.
4. Invalidation: Weekly close back below $3.7k–3.8k after breakout.
---
Bearish Scenario (if rejection occurs)
1. Confirmation signal: Bearish rejection candle (pin bar / engulfing) on weekly + no breakout close.
2. Entry strategies: Short or take profit on longs after confirmed rejection; ideally backed by bearish follow-through next week.
3. Target downside: First support $3.3k–3.6k; stronger drop could retest $2.1k–2.8k zone.
4. Invalidation: Weekly close back above $4.1k with strong bullish volume.
---
Risk Management & Notes
Weekly close is key — avoid reacting solely to intraday wicks.
Volume matters: No volume = higher risk of false breakout.
Position sizing: Keep risk controlled (e.g., 1–2% per trade), stops in logical zones.
Multi-timeframe check: Use daily chart for precise entries and watch for orderflow/news catalysts.
---
Pattern Notes
Multiple Tops / Horizontal Supply: Sellers have consistently defended this level.
Ascending pressure: Higher lows into resistance can increase breakout probability.
Measured Move: Distance from breakout zone to target is about $868 — matching the chart’s projection.
---
Hashtags
#ETH #ETHUSDT #Ethereum #Crypto #Breakout #Resistance #WeeklyChart #CryptoAnalysis #TechnicalAnalysis

The key is whether the price can hold above 3900.73-4107.80
Hello, fellow traders!
Follow us to get the latest information quickly.
Have a great day.
-------------------------------------
(ETHUSDT 1D chart)
This period of volatility is expected to last from around August 6th to 14th (maximum from August 5th to 15th).
The key question is whether the price can find support and rise above the 3900.73-4107.80 range after this period of volatility.
The next period of volatility is expected to occur around August 28th, so we need to see if the price can hold until then.
If the price declines, we need to check for support around the HA-High ~ DOM (60) range of 3708.87-3762.33.
If not, there's a chance it could fall below 3265.0-3321.30.
-
(1M Chart)
The TC (Trend Check) indicator has risen above 0, suggesting a high possibility of further upside.
Therefore, the key point to watch is whether it can rise above the 4630.26-4868.0 range.
For an uptrend to continue,
- The StochRSI indicator must remain upward with K > D.
(If possible, it's best to avoid K entering the overbought zone.)
- The On-Board Volume (OBV) indicator of the Low Line ~ High Line channel must remain upward.
(If possible, it's best to maintain OBV > OBVEMA.)
- The TC (Trend Check) indicator must remain upward.
(If possible, it should remain above 0.)
If the above conditions are met, the uptrend is likely to continue.
To sustain an uptrend by breaking above key support and resistance levels,
- The StochRSI indicator must remain below the overbought zone and remain above D.
- The On-Board Volume (OBV) indicator of the Low Line ~ High Line channel must rise above the High Line and remain upward.
- The TC (Trend Check) indicator must remain upward. (If possible, it should remain above the 0 point.)
When the above conditions are met, there is a high probability that the price will rise after breaking above important support and resistance levels.
-
Thank you for reading to the end.
I wish you successful trading.
--------------------------------------------------
- Here's an explanation of the big picture.
(3-year bull market, 1-year bear market pattern)
I will explain more in detail when the bear market begins.
------------------------------------------------------

$ETH - New monthly Signal! Been focusing heavily on CRYPTOCAP:ETH lately — price action remains clean, easy to read, and primed for a push into new highs.
By now, most of you should already have a solid position in $Ethereum. We’ve been calling some great entry spots, and if you’re still indecisive… this might be your last real chance.
The $3,400 zone held strong, and in my opinion, that’s the low for the next couple of months. We’ve also just triggered a fresh monthly signal inside this massive multi-month consolidation. If you’re expecting lower prices, you might be waiting a long, long time.
I’ve been eyeing the possibility of $10K since last month’s breakout opened the gate. Keeping our analysis grounded, $7K is the realistic target we should see this year — maybe even within the next two months.
Until the signal expires or the target is hit… keep holding.

ETHUSDTBearish RSI divergence at $4,280 suggests weakening momentum. Possible correction toward $3,981 → $3,786 → $3,373. Liquidity around $3,000 could attract price before the next leg. I expect a pullback before any strong bullish continuation.
BINANCE:ETHUSDT.P

$ETH - Rising WedgeCRYPTOCAP:ETH | 4h
Price remains within the ascending wedge on the 4h chart, showing a triple tap on the trendline.
On lower timeframes, watching 3880 as local support for a possible bounce.
Upside levels to monitor are 4120–4215 for potential rejection, though an ideal pullback would see the lower trendline tested at 3770–3680.

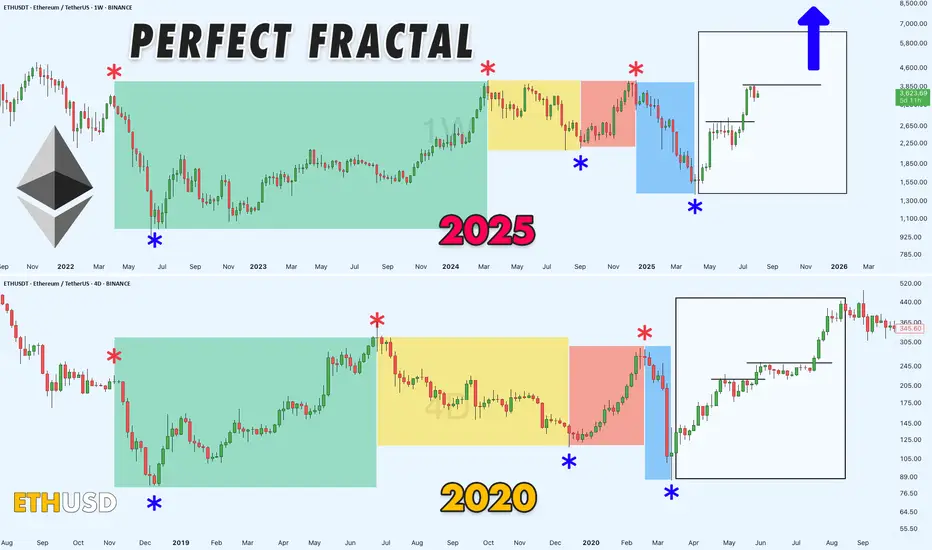
Haven't Posted in a Bit, Here's a Solid Chart for You All!Alright, been a while, but here's the deal: still no altseason in sight.
Meanwhile, ETHUSDT dropping some serious hints of a wild bull run on this fractal chart. It s got that 2020 vibe, though the timing s a tad off especially when you factor in Bitcoin s cycles.
Gonna be a blast watching this play out!
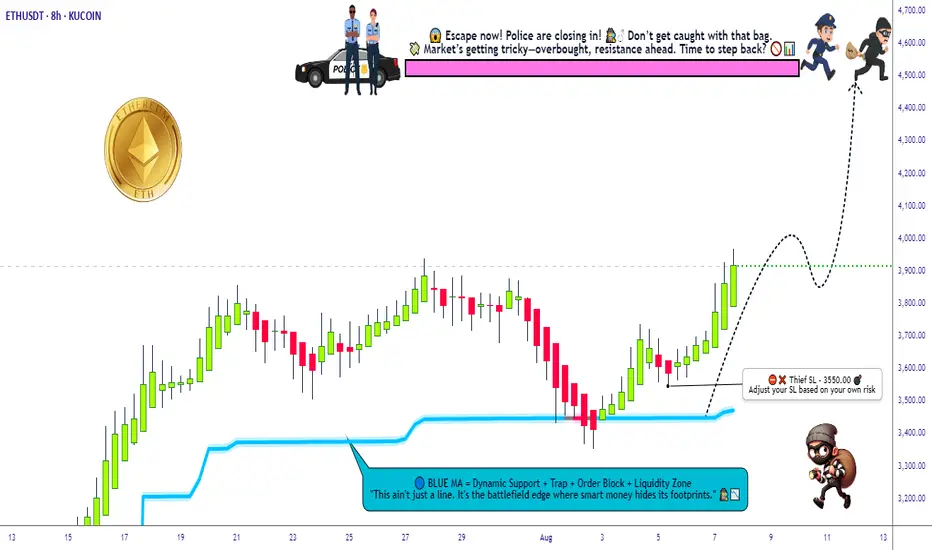
ETH/USDT Grid Plan » Bullish Loadout » Stealing the Top🚨ETH/USDT Crypto Heist Plan 🔓💰
Asset: ETH/USDT "Ethereum vs Tether"
Plan: 🟢 Bullish – Multi-Layered Entry Grid
Strategy: Thief-style limit orders (GRID / DCA stacking)
Entry: Any Dip is a Heist Opportunity 💸
Stop Loss: 🔻 3550.00
Target: 🎯 4500.00
👋 Hey Thieves & Money Makers!
Get your gear ready – it's time to loot the Ethereum Vault 💎🚀
🔥Thief Trader's ETH/USDT Master Robbery Blueprint🔥
This ain’t your average plan — we break in with layered entries, lock in on breakout volatility, and ride the bullish train to the moon 🌕.
💼 Entry Strategy:
No need to overthink. Any dip = loot zone!
Stack multiple limit orders like a pro (15M–1H level).
We're playing the grid game. The more dips, the bigger the stash! 🧱🪙
🚨 Stop Loss:
Set SL at 🔻3550 or under recent swing lows.
Adjust by risk appetite and how many entries you stack.
Thieves don’t chase – they calculate risk.
🎯 Target Zone:
We're eyeing the 4500 mark. But remember – exit before the vault shuts if momentum slows. 🏃♂️💨💰
🔁 Scalpers Alert:
Only long. Only bullish. Only profit. 🧲💥
Stack it, trail it, and let it run with a sniper's precision. 🎯🧠
📊 Market Context:
ETH bulls gaining control post-accumulation.
Strong on-chain metrics, solid macro tailwinds.
Bears trapped in the shadows – we move in daylight. 🐂🆚🐻
📰 Warning – News Bombs Ahead!
💣 Avoid fresh positions during high-impact events.
🎯 Use Trailing SLs to protect your loot.
Smart robbers never get caught unguarded.
💥BOOST This Idea if you're part of the robbery crew 🔐💰
Every boost powers our next move.
Let's rob the crypto market together – one breakout at a time! 🏴☠️📈🤑
Thief Trader™ – Locking Targets. Looting Charts.
💎🕵️♂️📊 #CryptoHeist #ThiefStyle #ETHBreakout #GridGang #BullMode
ETH Testing Critical $4K Resistance!BINANCE:ETHUSDT is trading inside an ascending triangle on the weekly chart, with price compressing between the resistance line and a rising support line. After a strong rally from the $1,500 demand area, ETH has reclaimed the 100- and 200-week EMAs and is testing the triangle’s upper trendline with increasing volume.
A weekly close above $4,000–$4,200 would confirm a triangle breakout and open upside toward $6,000–$7,500, while a rejection could send price back toward $3,200–$3,000 for further consolidation. Wait for a clear weekly close and volume confirmation.
Cheers
Hexa
BITSTAMP:ETHUSD CRYPTOCAP:ETH

ETH/USDT 12h chart1. Punction of the downward trend
• The black inheritance trend line has been broken up - this is a strong signal of Bycza.
• Breaking was confirmed by a strong candle movement and high growth dynamics.
⸻
2. Key levels of support and resistance
• Support:
• 3930 USDT - previous resistance, now the defensive zone with possible correction.
• 3709 USDT - deeper support.
• 3488 USDT - critical support, below which the upward trend would be negated.
• resistance:
• 4048 USDT - current local resistance (the candle touched and lightly reflected).
• 4304 USDT - another strong resistance.
• 4484 USDT - long -term resistance and potential goal when continuing to grow.
⸻
3. RSI
• RSI is around 70 - close to the purchase zone.
• suggests the possibility of a short correction or consolidation before the upward trend continues.
⸻
4. Scenarios
Bycza (continuation of growth)
• Maintenance above 3930 USDT.
• Breaking over 4048 USDT opens the road to around 4300–4480 USDT.
Bear (correction)
• Rejection to USDTT 4048 and a decrease below 3930 USDT may bring a rate to around 3709 USDT.

ETH Continues Bullish Momentum Above Broken TrendlineHello guys!
Ethereum has shown a strong bullish rally, breaking through a long-standing descending trendline with significant momentum. Currently, price action is consolidating above the broken trendline, which may now act as a support zone.
🔹 Scenario 1 (Bullish Continuation): If ETH holds above the current range and confirms the broken trendline as support, we could see a continuation toward higher resistance levels around $3,500 and beyond.
🔹 Scenario 2 (Deeper Retest): Alternatively, a pullback toward the $2,200–$2,300 area (highlighted zone) could offer a better accumulation point before the next bullish leg resumes.
This setup suggests that as long as ETH remains above the key support levels, the bullish structure remains intact.

Ethereum breakoutEthereum monthly chart shows a clear breakout above the 3800 resistance, targeting 8k.

eth swing buy / long setup eth well bounced from weekly fvg, now it's heading towards 4.1k double top liquidity. wait for the entry and must use SL, If candle closes below sl on 1hr tf then close on entry, otherwise wick doesn't matter. Maybe eth take 3750 liquidity first then fly high.

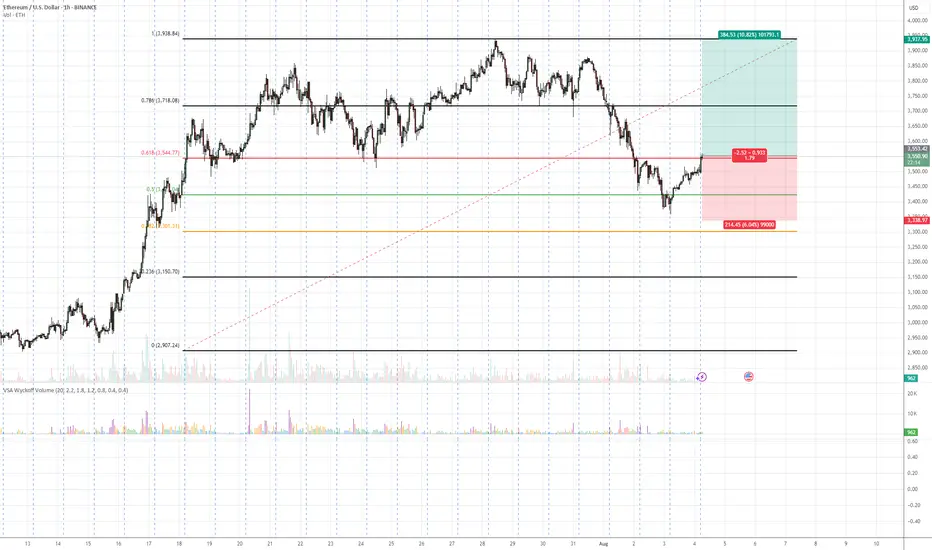
ETH/USDT – Bullish Reversal Potential from Fibonacci Confluence 💡 Idea:
Ethereum is showing signs of demand absorption at a critical Fibonacci support cluster (0.5 – 0.618 retracement). VSA patterns confirm that selling pressure is being absorbed, hinting at a possible markup toward previous swing highs.
📍 Trade Setup:
Entry: Current levels near 3,551
Target: 3,937 (+10.82%)
Stop Loss: 3,338 (below last absorption zone)
R:R Ratio: ~1.79:1
📊 Technical Reasoning (VSA)
1. Stopping Volume at Fibonacci Support
ETH tested the 0.5–0.618 retracement zone from its prior bullish impulse.
Wide spread down-bars on high volume failed to produce significant downside progress, signaling professional buying.
2. No Supply Confirmation
Following the stopping volume, the market printed narrow range candles on decreasing volume, indicating supply exhaustion.
3. Demand Emergence
The recent push above short-term resistance came with increasing volume and wider up-bar spreads, suggesting the start of an accumulation-to-markup transition.
4. Structure & Fibonacci Confluence
Current rally aligns with the Fibonacci golden zone and past structural support.
📌 Trading Plan:
Enter on confirmed breakout above minor resistance with volume expansion.
Scale out partial profits near 3,800 and let remainder ride toward 3,937.
Keep stop below 3,338 to avoid being shaken out by false breakouts.
ETH | Ethereum Game Plan - Swing Long IdeaETH | Ethereum Game Plan - Swing Long Idea
📊 Market Sentiment
Market sentiment remains bullish, supported by expectations of a 0.25% rate cut at the upcoming FOMC meeting. The weakening USD and rising risk appetite across global markets are favoring crypto assets in particular.
📈 Technical Analysis
Price swept the range low (Weekly Fair Value Gap), resulting in a deviation.
It then aggressively reclaimed higher levels and closed above key resistance.
A 12H demand zone was formed during this move.
We’re now seeing a retracement towards that 12H demand zone.
📌 Game Plan
I’m looking for price to hit the 12H demand zone at $3,530 and show a strong reaction.
This level is also below the 0.5 Fibonacci retracement, placing it in the discount area — an ideal entry zone for me.
🎯 Setup Trigger
After price taps the demand zone, I want to see a 1H–4H bullish break of structure to confirm the reversal before entering.
📋 Trade Management
Stoploss: Below 1H–4H swing low
Targets:
• TP1: $3,872
• TP2: $4,090
I’ll trail my stop to lock in profits aggressively as price moves in my favor.
💬 Like, follow, and comment if this breakdown supports your trading!
More setups and market insights coming soon — stay connected!
