ETHUSDT
ETH/USDT – Bullish Reversal Potential from Fibonacci Confluence 💡 Idea:
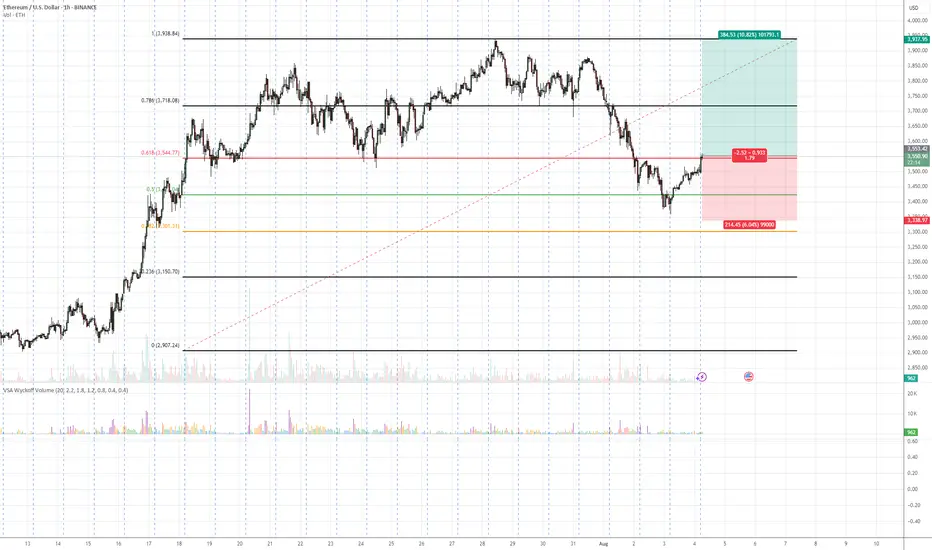
Ethereum is showing signs of demand absorption at a critical Fibonacci support cluster (0.5 – 0.618 retracement). VSA patterns confirm that selling pressure is being absorbed, hinting at a possible markup toward previous swing highs.
📍 Trade Setup:
Entry: Current levels near 3,551
Target: 3,937 (+10.82%)
Stop Loss: 3,338 (below last absorption zone)
R:R Ratio: ~1.79:1
📊 Technical Reasoning (VSA)
1. Stopping Volume at Fibonacci Support
ETH tested the 0.5–0.618 retracement zone from its prior bullish impulse.
Wide spread down-bars on high volume failed to produce significant downside progress, signaling professional buying.
2. No Supply Confirmation
Following the stopping volume, the market printed narrow range candles on decreasing volume, indicating supply exhaustion.
3. Demand Emergence
The recent push above short-term resistance came with increasing volume and wider up-bar spreads, suggesting the start of an accumulation-to-markup transition.
4. Structure & Fibonacci Confluence
Current rally aligns with the Fibonacci golden zone and past structural support.
📌 Trading Plan:
Enter on confirmed breakout above minor resistance with volume expansion.
Scale out partial profits near 3,800 and let remainder ride toward 3,937.
Keep stop below 3,338 to avoid being shaken out by false breakouts.
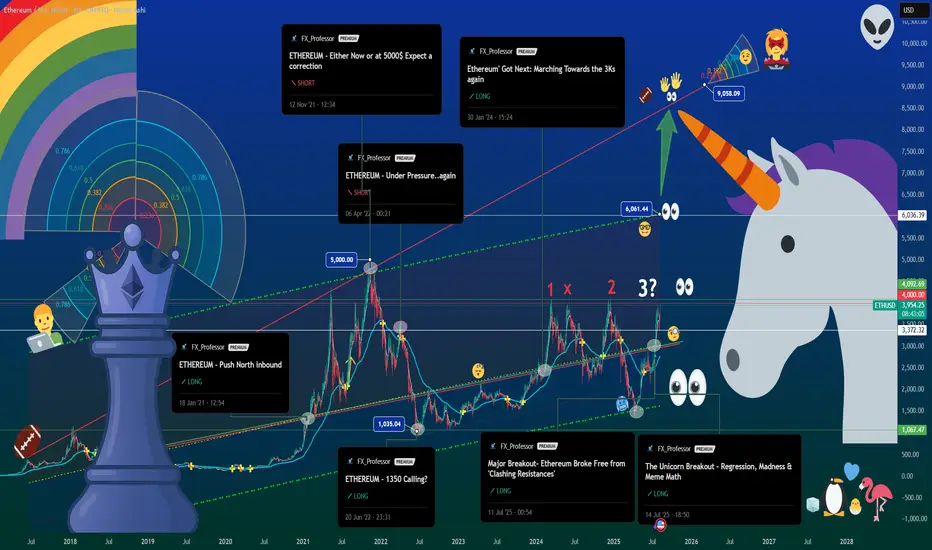
The Unicorn Breakout Part II – Ethereum at $4K, Queen of Crypto🦄👑 The Unicorn Breakout Part II – Ethereum at $4K, Queen of Crypto 📈♟
I’ve had a lot of conversations these past months.
Some friends told me ETH had no power, no influence.
One even called it the “bitch coin.”
Others insisted it lacked dynamics, that it was doomed to trail behind Bitcoin forever.
But the chart… the chart said otherwise.
That’s why, as a trader, so often I close my ears and follow the chart.
📜 The Recap
From “Push North” in 2021, to the “1-2-X” setup, and the July Unicorn prophecy, ETH has kept its dance inside the quadratic regression channel for over 7 years.
In Part I, we called $4,000 the first milestone. Now, it’s reality.
♟ Bitcoin is King, Ethereum is Queen
With recent leadership changes bringing renewed energy and sharper marketing, plus the Petra upgrade quietly powering under the hood, ETH is stepping into the place it deserves. The queen is the most powerful piece on the chessboard — and in this market, Ethereum is moving exactly like one.
📊 What’s Different This Time
-Network activity is pushing toward record levels.
-Transaction counts are surging, signaling deeper engagement.
-The ETH vs BTC conversation is back, and capital rotation is happening in real time.
🛠 Levels I’m Watching:
$4,092 – Current resistance zone.
$6,034 – Mid-regression line, the next battleground.
$8,674 – Unicorn Zone. Euphoric breakout territory.
$3,372 – Short-term support. Below here, $2,912 is on deck.
💙 The Human Note
This run is proof: conviction matters. Sometimes the crowd is wrong, the noise is deafening, and the chart is the only friend that tells the truth.
Trade with discipline, but live with intention. Spend time with those you love. Build things worth remembering. And when you play the game, know when to move your queen.
The Unicorn has hit $4K. The Queen has entered the center.
Next move? Checkmate at $6K? We’ll see.
One Love ,
The FX PROFESSOR 💙
Disclosure: I am happy to be part of the Trade Nation's Influencer program and receive a monthly fee for using their TradingView charts in my analysis. Awesome broker, where the trader really comes first! 🌟🤝📈
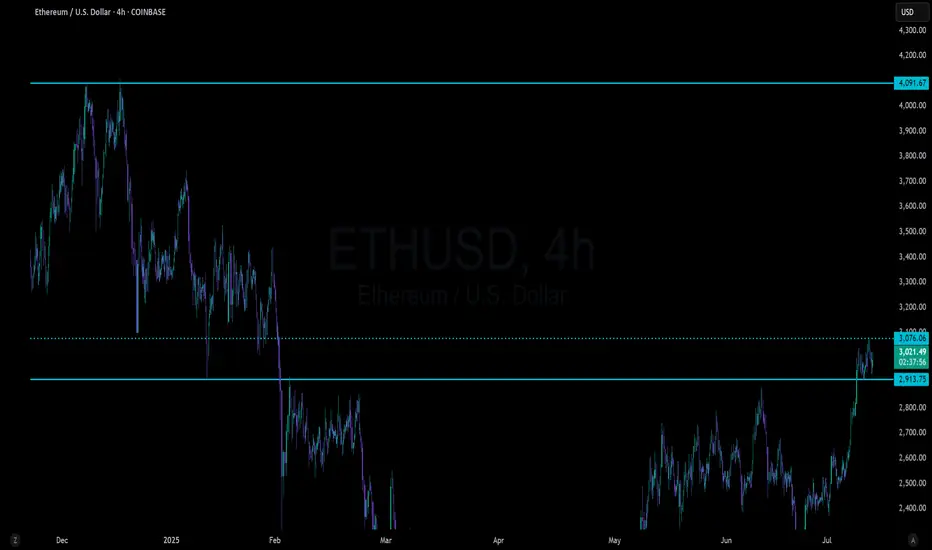
ETH broke a nearly 4 year resistance levelLooking at Ethereum on the daily or weekly Logarithmic chart you can see resistance being consistent since Nov 8th, 2021.
Today, Ethereum has broken through. It was brief, it was fast and it was so small that you can't even see it when zoomed out so far to see the multi year down trend.. However, if you take a look at ETH on the 4hr chart you can see it.
I don't know how ETH will react when breaking such a long downtrend and I look forward to finding out. A retest of the all time high from here seems plausible after such a long downtrend.

Ethereum breakoutEthereum monthly chart shows a clear breakout above the 3800 resistance, targeting 8k.

ETH | Ethereum Game Plan - Swing Long IdeaETH | Ethereum Game Plan - Swing Long Idea
📊 Market Sentiment
Market sentiment remains bullish, supported by expectations of a 0.25% rate cut at the upcoming FOMC meeting. The weakening USD and rising risk appetite across global markets are favoring crypto assets in particular.
📈 Technical Analysis
Price swept the range low (Weekly Fair Value Gap), resulting in a deviation.
It then aggressively reclaimed higher levels and closed above key resistance.
A 12H demand zone was formed during this move.
We’re now seeing a retracement towards that 12H demand zone.
📌 Game Plan
I’m looking for price to hit the 12H demand zone at $3,530 and show a strong reaction.
This level is also below the 0.5 Fibonacci retracement, placing it in the discount area — an ideal entry zone for me.
🎯 Setup Trigger
After price taps the demand zone, I want to see a 1H–4H bullish break of structure to confirm the reversal before entering.
📋 Trade Management
Stoploss: Below 1H–4H swing low
Targets:
• TP1: $3,872
• TP2: $4,090
I’ll trail my stop to lock in profits aggressively as price moves in my favor.
💬 Like, follow, and comment if this breakdown supports your trading!
More setups and market insights coming soon — stay connected!

ETH | NEW ATH or DUMP ?Ethereum recently peaked at $3900. And allthough this is not a new ATH (close by a few hundred dollars), it is a local high for the year.
My last update was on an inverse Head and Shoulders pattern on ETH, which has since increased over 50%:
(The original idea here:)
The question now, is what's next for ETH - further increase, or are the increases over for the near term and is a correction more likely?
I'm going to say that the increases for ETH are over for now. This is because we correction is most definitely due after such a large increase in a fairly short timeframe. I'm not saying we're heading into a full out bearish cycle, but a 20-25% correction would be most normal at this point.
Additionally, XRP has also made it's peak and lost the high, now trading just under $3. This is a strong sign that the alts have likely already rallied, since XRP used to be the last to increase (if it increased at all, historically. (Thanks Jedd).
I was very lucky to call that top here:
Either way, buyers may use this correction to scoop up on smaller alts over the next few weeks. This ultimately depends on whether the market has ONE MORE pump, and if the correction will bounce back from a 20-25% pullback.
_________________
BINANCE:ETHUSDT

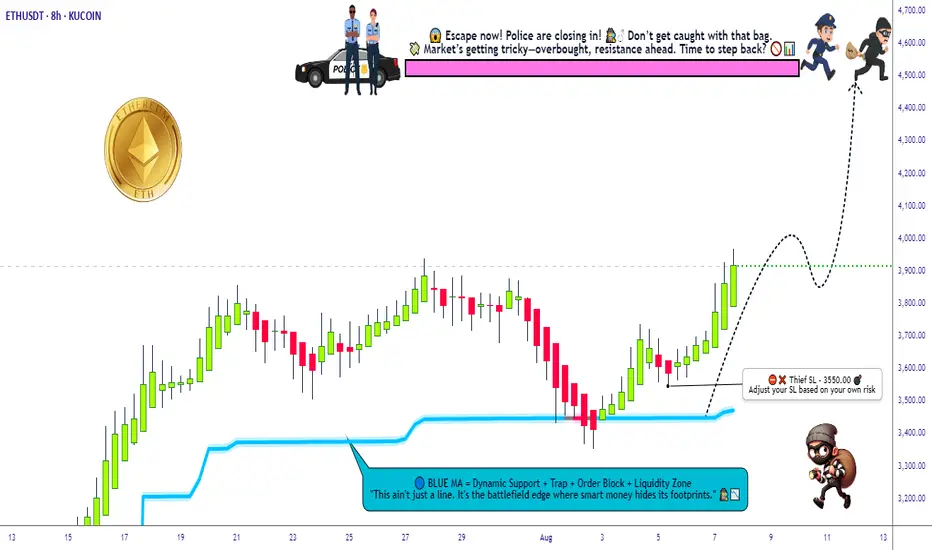
ETH/USDT Grid Plan » Bullish Loadout » Stealing the Top🚨ETH/USDT Crypto Heist Plan 🔓💰
Asset: ETH/USDT "Ethereum vs Tether"
Plan: 🟢 Bullish – Multi-Layered Entry Grid
Strategy: Thief-style limit orders (GRID / DCA stacking)
Entry: Any Dip is a Heist Opportunity 💸
Stop Loss: 🔻 3550.00
Target: 🎯 4500.00
👋 Hey Thieves & Money Makers!
Get your gear ready – it's time to loot the Ethereum Vault 💎🚀
🔥Thief Trader's ETH/USDT Master Robbery Blueprint🔥
This ain’t your average plan — we break in with layered entries, lock in on breakout volatility, and ride the bullish train to the moon 🌕.
💼 Entry Strategy:
No need to overthink. Any dip = loot zone!
Stack multiple limit orders like a pro (15M–1H level).
We're playing the grid game. The more dips, the bigger the stash! 🧱🪙
🚨 Stop Loss:
Set SL at 🔻3550 or under recent swing lows.
Adjust by risk appetite and how many entries you stack.
Thieves don’t chase – they calculate risk.
🎯 Target Zone:
We're eyeing the 4500 mark. But remember – exit before the vault shuts if momentum slows. 🏃♂️💨💰
🔁 Scalpers Alert:
Only long. Only bullish. Only profit. 🧲💥
Stack it, trail it, and let it run with a sniper's precision. 🎯🧠
📊 Market Context:
ETH bulls gaining control post-accumulation.
Strong on-chain metrics, solid macro tailwinds.
Bears trapped in the shadows – we move in daylight. 🐂🆚🐻
📰 Warning – News Bombs Ahead!
💣 Avoid fresh positions during high-impact events.
🎯 Use Trailing SLs to protect your loot.
Smart robbers never get caught unguarded.
💥BOOST This Idea if you're part of the robbery crew 🔐💰
Every boost powers our next move.
Let's rob the crypto market together – one breakout at a time! 🏴☠️📈🤑
Thief Trader™ – Locking Targets. Looting Charts.
💎🕵️♂️📊 #CryptoHeist #ThiefStyle #ETHBreakout #GridGang #BullMode
ETH Testing Critical $4K Resistance!BINANCE:ETHUSDT is trading inside an ascending triangle on the weekly chart, with price compressing between the resistance line and a rising support line. After a strong rally from the $1,500 demand area, ETH has reclaimed the 100- and 200-week EMAs and is testing the triangle’s upper trendline with increasing volume.
A weekly close above $4,000–$4,200 would confirm a triangle breakout and open upside toward $6,000–$7,500, while a rejection could send price back toward $3,200–$3,000 for further consolidation. Wait for a clear weekly close and volume confirmation.
Cheers
Hexa
BITSTAMP:ETHUSD CRYPTOCAP:ETH

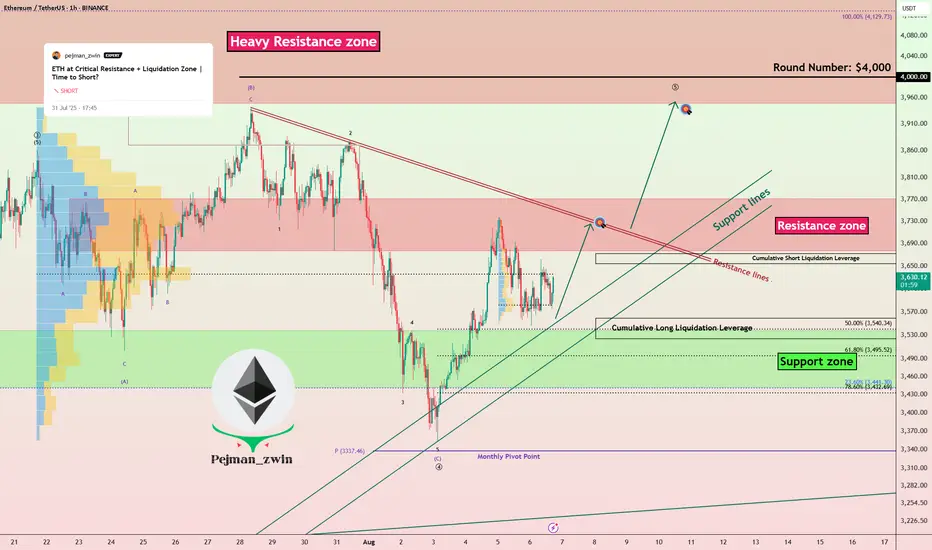
Ethereum Ready to Attack Resistances — Time to Long ETH?Ethereum ( BINANCE:ETHUSDT ) fell to the Support zone($3,538-$3,442) and Support lines as I expected in the previous idea .
Ethereum is currently trading near the Support zone($3,538-$3,442) , Support lines , and Cumulative Long Liquidation Leverage($3,559-$3,524) .
In terms of Elliott Wave theory , it seems that Ethereum has completed the main wave 4 . The main wave 4 has an Expanding Flat structure(ABC/3-3-5) . To confirm the main wave 4, we must wait for the Resistance zone($3,771-$3,677) and Resistance lines to be broken.
I expect Ethereum to trend higher in the coming hours and attack the Resistance lines and Resistance zone($3,771-$3,677) .
Cumulative Short Liquidation Leverage: $3,672-$3,645
Note: Stop Loss: $3,450 =Worst
Please respect each other's ideas and express them politely if you agree or disagree.
Ethereum Analyze (ETHUSDT), 1-hour time frame.
Be sure to follow the updated ideas.
Do not forget to put a Stop loss for your positions (For every position you want to open).
Please follow your strategy and updates; this is just my Idea, and I will gladly see your ideas in this post.
Please do not forget the ✅' like '✅ button 🙏😊 & Share it with your friends; thanks, and Trade safe.
ETH/USDT – Smart Money Is In. Is a New Bull Cycle Starting?What is the market telling us? Without a doubt, Ethereum is entering a new weekly-level bullish cycle, a move that could reshape the altcoin landscape in the coming months.
🔍 Trend Confirmed – Breakout from Ichimoku Cloud & Key Resistance
ETH has just broken out of a multi-month accumulation phase around the $2,000–$2,400 range. On the weekly timeframe, price has clearly broken above the Ichimoku Cloud and pierced through the major resistance zone that had previously capped upside moves.
This is not a technical bounce — it’s a confirmed trend shift into a mid-to-long-term uptrend.
💡 Key Insight: Steady Volume Growth = Smart Money
Unlike FOMO-driven rallies, this breakout is accompanied by steady, non-explosive volume, indicating smart money accumulation rather than speculative chasing.
🧱 Fair Value Gaps (FVGs) – Zones You Can’t Ignore
On the weekly chart, ETH has printed multiple Fair Value Gaps — price zones where strong buying pressure left the market no time to fill the gaps.
Key FVG zones to watch:
🔹 $2,400 – $2,700
🔹 $2,900 – $3,200
🔹 $3,400 – $3,700
These are not just support zones — they are “whale footprints”. Price often reacts to these levels and they offer ideal re-accumulation zones before the next leg up.
📈 Clear Trend Structure – Higher Highs, Higher Lows
ETH is currently trading around $3,910, a price level that hasn’t held steady since early 2022. But now, things are different:
✅ Trend shift confirmed – Higher Highs & Higher Lows
✅ Volume supports the move
✅ Market sentiment is clearly improving
If ETH holds above $3,700, the next target could be $4,800 – $5,000. In a more bullish scenario, we may even see a return to all-time highs, especially if Bitcoin continues to lead the market.
🧠 Trading Strategy: No FOMO – Wait for a Better Entry
❌ I’m not buying into $3,900+.
✅ I’ll wait for ETH to pull back into the $3,400–$3,600 range — a confluence zone including:
Strong FVG
Previous support
Ichimoku Cloud
Bullish structure
If clear confirmation shows up here (e.g., increasing volume, pinbar, bullish engulfing), I’ll open a medium-term long position targeting the $5,000 zone.
At that level, the risk:reward is extremely attractive.
💬 Final Take: This Is Not Just a Technical Bounce
Looking at the full picture — structure, volume, smart money flow, and sentiment — this is not a typical technical rebound. It's the early phase of a new bullish cycle, led by Ethereum.
And as I always say:
"Altcoins don’t rally because of FOMO — they rally because Ethereum leads the charge."
👉 What price zone are you watching ETH at?
Do you have a strategy for this wave?
Drop your thoughts in the comments — I’d love to hear your view!

eth swing buy / long setup eth well bounced from weekly fvg, now it's heading towards 4.1k double top liquidity. wait for the entry and must use SL, If candle closes below sl on 1hr tf then close on entry, otherwise wick doesn't matter. Maybe eth take 3750 liquidity first then fly high.

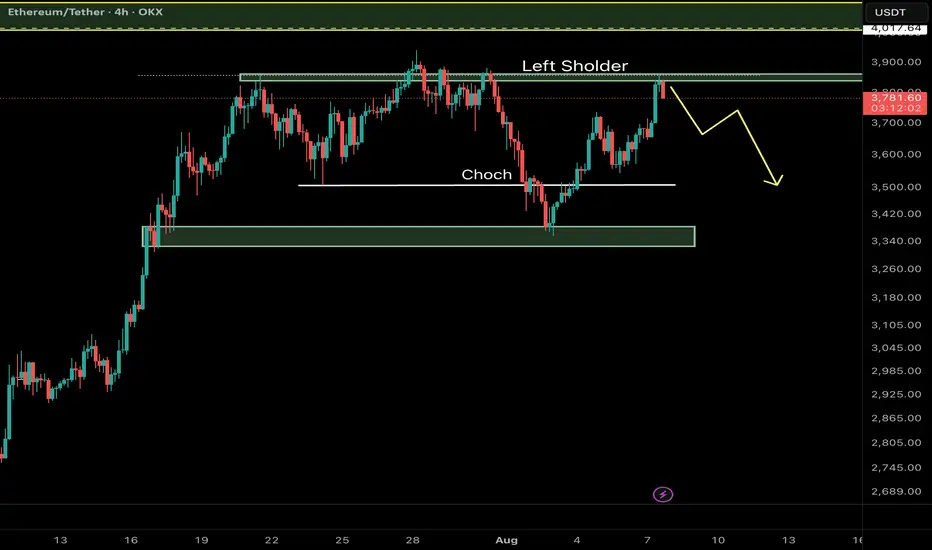
Ethereum (ETH/USDT) – Key Reversal Zone RetestAfter a major CHoCH (Change of Character) on the 4H timeframe, Ethereum has shown a strong bullish move from a high-probability demand zone and is now retesting a critical resistance area aligned with the Left Shoulder of a classic RTM pattern.
⸻
🔍 Key Technical Elements:
• CHoCH confirms the shift from a distribution phase to accumulation.
• Strong reaction from a demand zone near $3,340–$3,380.
• Price is now testing the Left Shoulder, which often acts as a reaction zone before continuation.
⸻
📌 Potential Scenarios:
🔼 Bullish Case (Primary):
If ETH breaks and closes above $3,870, a move toward the next liquidity pool around $4,010–$4,050 is likely.
🔽 Bearish Case (Alternative):
Failure to hold above the current resistance may lead to a pullback toward the $3,340–$3,380 demand zone for another accumulation attempt.
⸻
💡 Educational Note:
In RTM methodology, retests of the Left Shoulder after CHoCH are considered one of the most efficient entry zones — especially when confluence with liquidity voids or imbalance exists.
Follow for more Smart Money & RTM insights.
ETHSimple chart :
- Don’t fight the trend, just stick to your strategy.
- follow the signs.
- Never go all in and always DCA.
Only this way we will learn to master our emotions.
Happy Tr4Ding !

Ethereum Not Dead- i know some peoples think ETH will go to 250$ or 500$, so wait for it...
- I've always maintained that I'm not a fan of ETH because of its scalability limitations and centralization, for that reason ETH needs some messy L1...L2...etc..
- That said, my opinion doesn’t matter much, ETH is here to stay. The Ethereum ecosystem hosts thousands of projects; I’d say it’s too big to fail.
- i used Bitstamp exchange to look further back in the chart's history.
- i simplified this monthly chart so much that even a 10 year old kid could understand it, just check the RSI low levels and compare it with previous years. Again, check the max RSI level for the previous ATHs.
- i won't discuss where to buy because, whether you get ETH at $1,800 or $1,500, the bull run for ETH and Altcoins hasn't started yet.
Happy Tr4Ding !

Ethereum Long Trigger Just Got Valid — Don’t Miss This SetupHey, it’s Skeptic from Skeptic Lab.
In this breakdown, we’re looking at a fresh long opportunity on Ethereum after a clean 45% move from our last trigger.
I’ll walk you through the daily and 4H timeframes, explain why the correction looks weak, and where the next breakout trigger is setting up.
Plus, I’ll show you how ETHBTC can help confirm the move and improve your risk/reward.
If this gave you clarity or value, give it a boost — and I’ll catch you in the next one.
Disclaimer: This is not financial advice. Always do your own research before making any trading decisions.

Ethereum ETH at Key Resistance: Here's My Trade PlanEthereum (ETH) has maintained a fairly bullish structure overall 🟢, but price is now trading into a significant resistance level 🧱📈. I’m closely monitoring for a reaction at this zone — ideally a rejection that leads to a pullback into a key support area 🔄📉.
If ETH finds support and we get a clean bullish break in market structure from there 📊🚀, that could present a high-probability setup to the long side — contingent on price action confirming the bias. 🔍 Not financial advice ⚠️.

ETH ~ Ive given him some laxatives!okay, me giving him laxative means you know what gonna happen and till where it gonna fall loololl

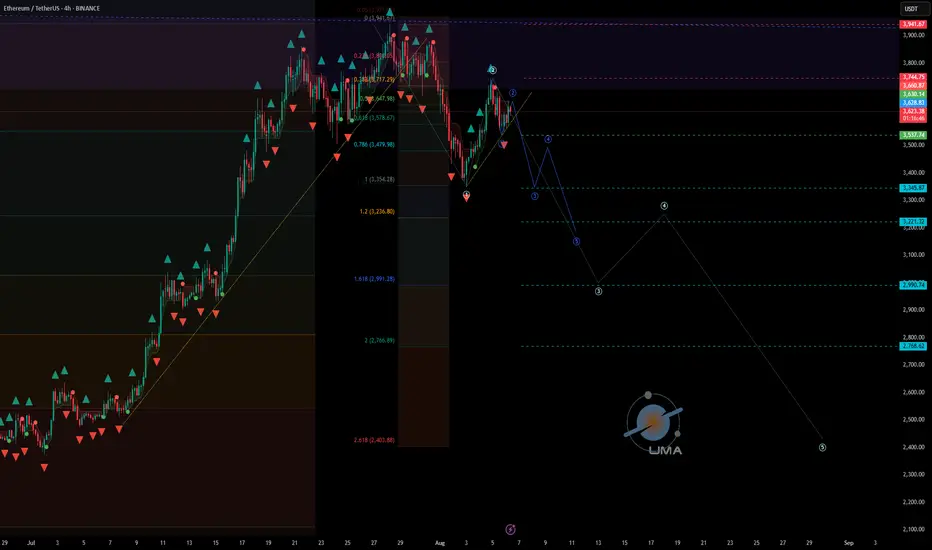
ETHUSDT - UniverseMetta - Analysis#ETHUSDT - UniverseMetta - Analysis
Potential reversal & correction setup in progress
📆 W1 – Weekly Timeframe
🔹 Price is testing a major monthly resistance zone, from which price has previously rejected toward the lower edge of a large triangle structure
🔹 According to the 3-wave structure, ETH has reached 161% of Wave 1 and closed above the 200% Fibo level
🔹 If the price fails to make a new high this week, a top fractal may form — a possible signal for a medium-term correction
📉 D1 – Daily Timeframe
🔹 A double top pattern is forming, along with a potential retest of the trendline
🔹 If confirmed, this could trigger a 3-wave correction structure downward
🔹 A downward fractal is already printed — adding confluence to the bearish scenario
🎯 Correction targets:
• $3,242
• $2,546
⏳ H4 – 4H Timeframe
🔹 Current price action suggests a correction from the recent impulse
🔹 A 3rd wave may initiate upon trendline breakout
🔹 Entry confirmation may come from breakout + retest, or via confirmed double top structure
🔹 Stop should be placed above the high of Wave 1 (H4)
🎯 Trade Setup:
Entry: 0.64930
TP: 0.65404 - 0.65700 - 0.66164 - 0.66676
Stop: 0.64482
‼️ Risk should not exceed 1–3% of your portfolio
This signal/idea is not financial advice
📌 Key Fundamental Triggers to Watch:
🔹 Federal Reserve expectations – a dovish shift could support ETH short-term, but failure to materialize may drive a pullback
🔹 ETH ETF news – updates on applications, approvals, and volume flows can significantly impact sentiment
🔹 Correlation with NASDAQ/S&P500 – weakness in equities could drag crypto lower
🔹 On-chain activity – declining gas usage or demand may indicate lower network utility and bearish pressure
🔹 Weekly overbought condition – many technical indicators (RSI, MACD) point to overextension
ETH/USDT 15m SETUP.ETH/USDT 15m Setup 🚀
Price is approaching a clean POI (Order Block + Imbalance zone).
Expect a short-term dip into the zone followed by a bullish reaction.
📌 Trade Idea:
Wait for price to tap the POI
Look for bullish confirmation
Target upside continuation after liquidity grab & structure shift
High probability long setup incoming!

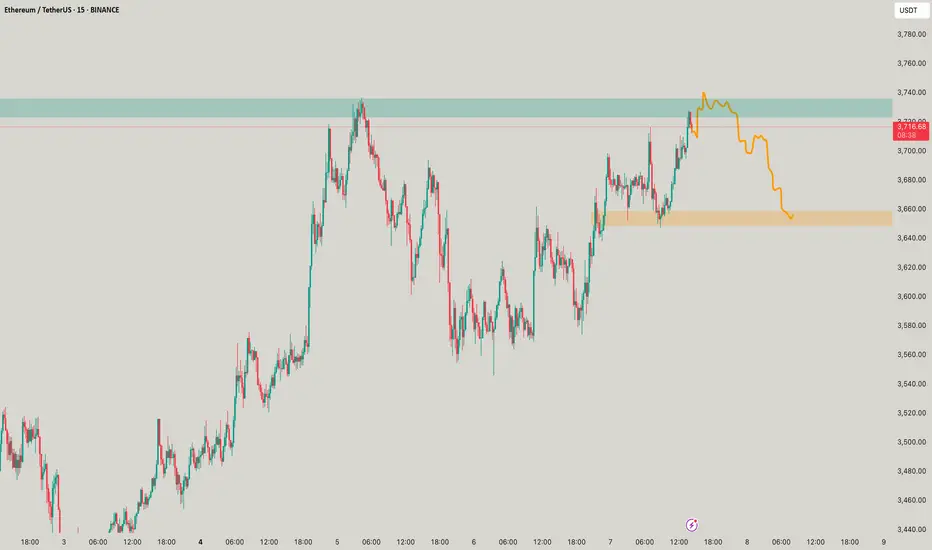
ETH NEXT MOVE AND BUY ZONE.1. Market Structure:
ETH/USDT broke previous structure highs (marked with X), confirming a bullish trend shift.
Price made a strong impulsive move upward after that break, forming higher highs and higher lows, indicating smart money accumulation.
2. Price Action & Current Retracement:
After forming a recent peak near $3,950, ETH entered into a retracement.
The retracement is currently holding above key liquidity and demand zones, showing signs of healthy correction rather than reversal.
3. Liquidity Grab – Sell-Side Liquidity (SSL):
There is Sell-Side Liquidity (SSL) resting below $3,700, which has not yet been taken out.
Smart money often targets such liquidity before initiating a new leg up — this makes SSL a potential magnet for price.
4. Fair Value Gap (FVG) + Demand Zone (POI):
Just below the SSL lies a confluence zone:
A clear Fair Value Gap (FVG) between approximately $3,680–$3,700, showing inefficiency in price.
A Demand Zone (POI) below that, between $3,640–$3,680, representing the origin of the bullish move that broke structure.
This zone provides high-probability support and a potential area of smart money re-entry.
5. Trade Setup Expectation:
Scenario: Price is likely to:
Sweep SSL below $3,700.
Tap into the FVG + Demand Zone.
Show bullish confirmation (like a bullish engulfing, Choch/BOS on lower timeframe).
Entry: After confirmation inside demand zone.
Stop Loss: Below demand zone (~$3,620).
Take Profit 1: Retest recent high at $3,950.
Take Profit 2: Extension toward $4,050–$4,100 based on higher timeframe targets.
✅
Summary:
ETH/USDT is in a bullish structure but currently pulling back. A sweep of sell-side liquidity (SSL) and a tap into the FVG + Demand Zone around $3,640–$3,700 is expected. After confirmation, it offers a high-probability long setup, aligning with smart money accumulation logic.

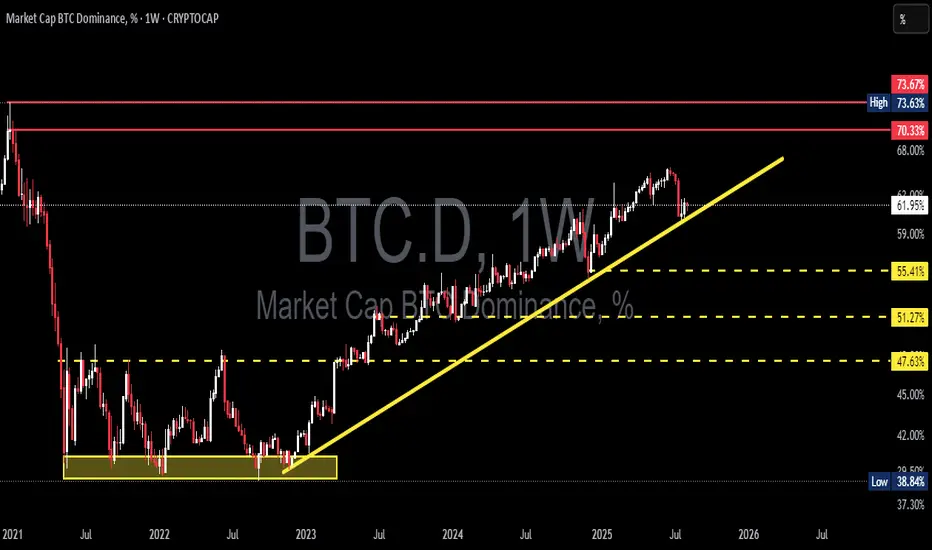
BTC Dominance at a Critical Point – Is Altseason About to Begin?🔍 Technical Breakdown (BTC.D Weekly Chart)
The weekly BTC Dominance chart shows Bitcoin's dominance is now testing a critical ascending trendline, which has supported its bullish momentum since early 2023.
After hitting a major resistance zone between 70.33% – 73.67%, BTC.D faced a sharp rejection — signaling a potential capital rotation from BTC into altcoins, which is often the first clue of an incoming Altseason.
---
🧩 Structure & Pattern Highlights:
✅ Rising Trendline Support:
A strong uptrend structure has been in place since the 2022 bottom (~39%), marked by consistent higher highs and higher lows.
⚠️ Minor Double Top near 70.33% – 73.67%:
This classic reversal pattern at a macro resistance zone hints at possible exhaustion in BTC dominance.
🟡 Historical Accumulation Zones:
Key horizontal levels at 55.41%, 51.27%, and 47.63% have acted as major decision zones in the past and will serve as critical support if the trend breaks.
---
🟢 Bullish Scenario (BTC Dominance Rises):
If BTC.D can:
Successfully hold above the ascending trendline
Print a strong weekly bullish reversal
➡ Then a move back up to retest 70.33% is likely.
A confirmed breakout above 73.67% would suggest BTC dominance could surge further.
📌 What it means? Altcoins would likely underperform, as BTC reclaims market control — usually a risk-off signal for crypto.
---
🔴 Bearish Scenario (BTC Dominance Falls):
If BTC.D:
Breaks below the ascending trendline
Fails to hold the 61.91% support zone
➡ This could signal a significant capital outflow from BTC to altcoins — an early indicator of Altseason.
Bearish targets below:
55.41% – First support area.
51.27% – Key psychological and technical level.
47.63% – A drop to this level would be a strong confirmation that Altseason is in full effect.
📌 In this case, we’d expect strong moves across sectors like AI tokens, DeFi, L1s, and mid/low cap altcoins.
---
📊 Key Confirmations to Watch:
1. Weekly candle reaction to the trendline
2. Volume – strong selling on breakdown confirms trend shift
3. ETH.D and TOTAL2 (Altcoin Market Cap) – if rising while BTC.D falls, it's strong evidence for Altseason
---
🚨 Final Takeaway:
BTC Dominance is now at a make-or-break level that could define the direction of the broader crypto market for the next several months.
A breakdown = risk-on environment, favoring altcoins.
A bounce = BTC continues to dominate while altcoins stall.
Either way, the next big move is coming — this is the moment serious traders and investors have been waiting for.
#BTCdominance #AltseasonAlert #BitcoinVsAltcoins #CryptoRotation #CryptoBreakout #AltcoinSeason #CryptoMarketAnalysis #BTC.D #CryptoTrend #SmartMoneyMoves #CryptoTA #TradingViewAnalysis