ETH/USDT Bearish Setup – Rising Wedge Breakdown & RetestEthereum (ETH/USDT) has broken down from a rising wedge — a classic bearish pattern — and is now showing signs of rejection after a clean retest of the broken trendline around $3,679.
Structure:
Rising wedge pattern on the higher timeframe
Breakdown confirmed with retest of lower trendline as resistance
No bullish follow-through after retest
Trade Plan:
Bias: Bearish below $3,680
Entry Zone: Anywhere below $3,670–3,680 if rejection is confirmed
Stop Loss: Above $3,720 (invalidation)
Targets:
Target 1: $3,298
Target 2: $2,880
Target 3: $2,640
Key Notes:
If ETH reclaims and holds above $3,680, the setup gets invalidated
Watch BTC behavior — ETH tends to follow
Volume shows no strength from bulls post-breakdown
This setup presents a high-risk, high-reward opportunity if the price continues to decline from this zone.
Conclusion:
Stay cautious, as the market could see more downside if ETH stays below $3,680. Manage risk accordingly.
DYOR | Not Financial Advice
ETHUSDT

ETH/USDT | ETH Under Pressure – Watch $3500 Support!By analyzing the Ethereum chart on the weekly timeframe, we can see that after reaching the $3940 zone, ETH faced selling pressure and is now trading around $3540. If the price fails to hold the key $3500 support, a deeper decline is likely, with potential targets at $3040 first and possibly $2680 as the second bearish target.
Please support me with your likes and comments to motivate me to share more analysis with you and share your opinion about the possible trend of this chart with me !
Best Regards , Arman Shaban

Ethereum pumpingA breakthrough is coming for Ethereum after testing $3800 for the fourth time, with $8000 as the target.

Important Trend Determination Area: 3708.87-3762.33
Hello, traders!
Follow us to get the latest information quickly.
Have a great day!
-------------------------------------
(ETHUSDT 1D Chart)
The price began to rise after breaking above the important 2419.83-2706.15 area.
This can be interpreted as the beginning of a step-up trend, with an upward breakout of the HA-High ~ DOM(60) range.
The HA-High ~ DOM(60) range corresponds to the 2581.59-2681.60 range.
This suggests that the price is currently testing whether a second step-up trend will continue or whether it will simply end as the first step-up trend.
The HA-High ~ DOM(60) range is currently 3708.87-3762.33.
Therefore, if the price rises above 3708.87-3762.33 and maintains this level through the upcoming volatility period, a second step-up trend is expected.
The conditions for this are as follows:
- The K value of the StochRSI indicator must rise from the oversold zone and show an upward trend with K > D. - The OBV indicator must rise above the High Line and maintain an upward trend.
- The TC (Trend Check) indicator must continue its upward trend. (If possible, it's best to stay above 0.)
The next volatility period for ETH is expected to last from around August 6th to 10th.
However, it's worth keeping an eye on the movements during the BTC volatility period.
-
Thank you for reading to the end.
I wish you successful trading.
--------------------------------------------------
- This is an explanation of the big picture.
(3-year bull market, 1-year bear market pattern)
I will explain in more detail when the bear market begins.
------------------------------------------------------

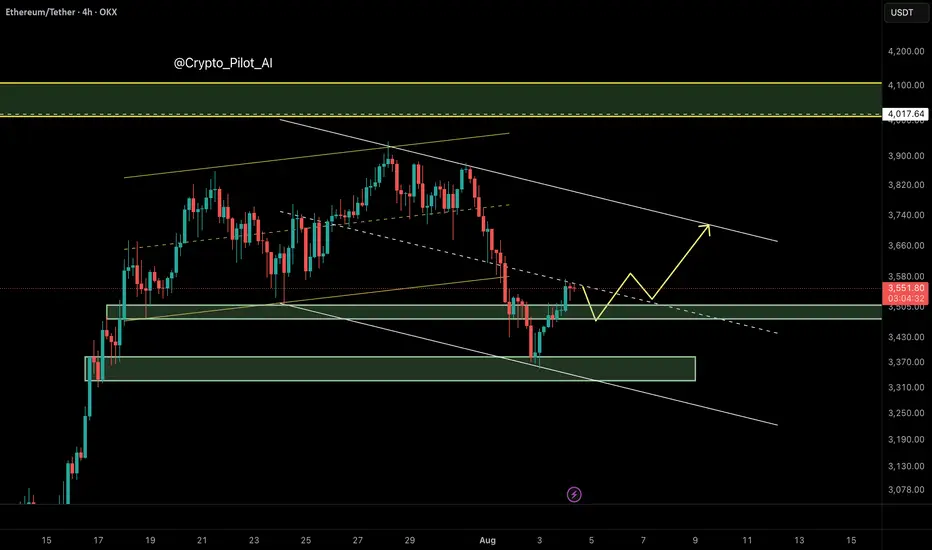
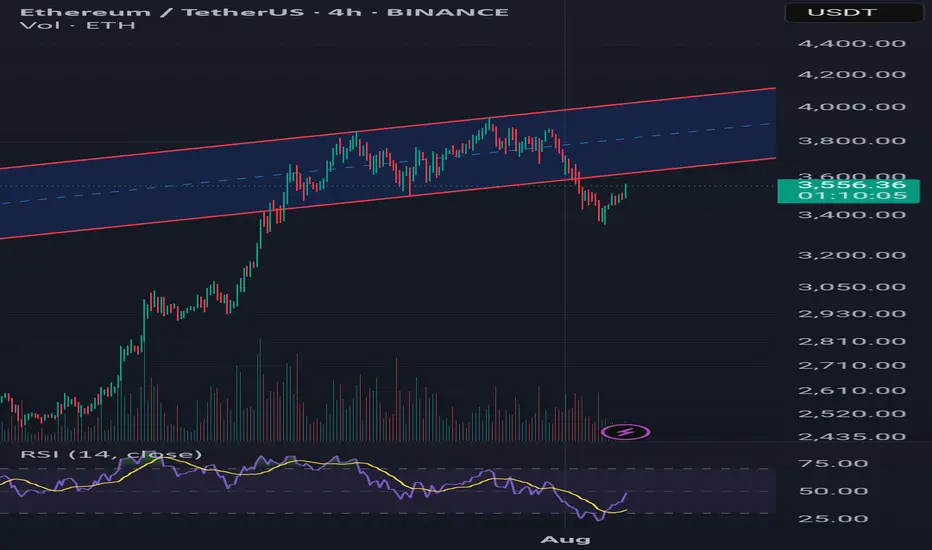
ETHUSDT 4H Chart Review🔍 General Technical Context:
Prior Trend: Upward (strong rally from around 3,150 USDT).
Current Structure: After breaking out of the ascending channel, there was a strong decline, but is currently rebounding upward – it looks like a test of prior support as resistance.
📈 Key Horizontal Levels (Support/Resistance):
Resistance:
3,794 USDT – strong resistance resulting from the prior high (green line).
3,943 USDT – high of the ascending channel.
Support:
3,504 USDT – prior support, now potentially acting as resistance (red line).
3,383 USDT – July support.
3,132 USDT – strong base support, potential correction low.
📉 Technical Patterns:
Broken Upward Channel (orange lines): A clear downward breakout suggests a weakening of the previous trend.
Downward Trendline (purple): The current price is approaching it – a test and reaction (bounce or breakout) may occur.
📊 Stochastic RSI (oscillator at the bottom):
The indicator is entering the overbought zone (>80).
This may indicate an impending slowdown or correction, especially if the price encounters resistance at the purple downward trendline.
🔮 Scenarios:
✅ Bullish (if the breakout is upward):
A breakout of the purple trendline and resistance at 3,794 USDT could signal further gains towards 3,943 USDT or higher.
Confirmation could come from a retest of the purple line as support.
❌ Bearish (if resistance rejected):
Rejection from the trendline or the 3,794 USDT zone = possible correction to 3,504 or 3,383 USDT.
Break of 3,383 = potential decline to the 3,132–3,150 USDT zone.
🧭 Conclusion:
The market has regained strength from the local low but is at a potentially strong resistance zone.
Stochastic RSI overbought + near resistance = high risk of a near-term correction.
The key will be price performance within the purple trendline and 3,794 USDT.

eth sell midterm "🌟 Welcome to Golden Candle! 🌟
We're a team of 📈 passionate traders 📉 who love sharing our 🔍 technical analysis insights 🔎 with the TradingView community. 🌎
Our goal is to provide 💡 valuable perspectives 💡 on market trends and patterns, but 🚫 please note that our analyses are not intended as buy or sell recommendations. 🚫
Instead, they reflect our own 💭 personal attitudes and thoughts. 💭
Follow along and 📚 learn 📚 from our analyses! 📊💡"

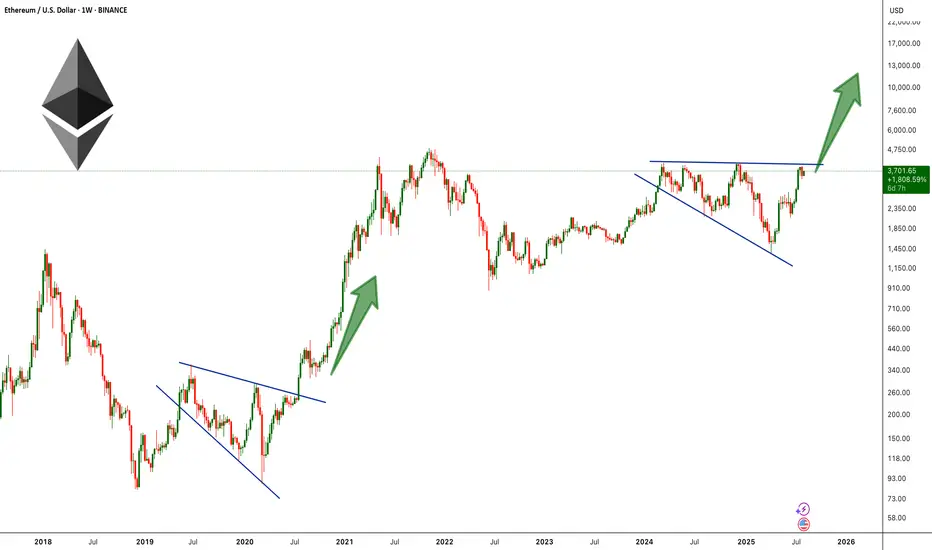
ETH Broadening Wedge Formation !BINANCE:ETHUSDT is forming a broadening wedge pattern on the weekly chart, a structure that often signals high volatility and strong momentum once the price breaks out. This setup is reminiscent of ETH’s 2019–2020 pattern, which also formed as a broadening wedge before breaking to the upside and triggering a historic rally to new all-time highs.
Currently, ETH is pressing against the upper resistance line of the wedge near the $3,900–$4100 zone, a level that has acted as major resistance multiple times in recent months. A decisive breakout above this barrier could ignite strong bullish momentum, opening the path toward the $6,000–$10,000 range.
Cheers
Hexa
Ethereum (ETH/USDT) – Bearish Channel Structure Developing
⸻
🔍 Technical Overview
Ethereum has broken down from its ascending channel, invalidating the earlier bullish projection toward $4,000. After failing to hold the channel midline around $3,577, price dropped sharply to $3,360, forming a new bearish descending channel.
Currently, ETH is trading near the midline of this bearish channel, which typically acts as a decision point — not a buying zone — in smart money models.
⸻
🧠 NEoWave Interpretation
We may be inside a Complex Corrective Wave, possibly a Running or Contracting Flat evolving after the March top. The current structure resembles a B-wave trap, where price fakes out the upside before shifting momentum sharply downward. The break below the ascending channel midline confirms this bearish shift.
⸻
📊 Smart Money Summary
• 🟥 BOS confirmed on 1H and 4H (lower highs and lower lows)
• 🔻 Midline failure acted as a smart money trap, followed by a liquidity sweep below $3,490
• 📦 Bullish Order Block around $3,490–$3,520 has been tapped, prompting a minor reaction
• 🟡 Current resistance sits near the channel top ~ $3,715
⸻
🎯 Trade Scenarios
📌 Bearish Continuation:
If price fails to reclaim above $3,715, a retest and rejection from the channel top could trigger continuation toward $3,300–$3,250.
📌 Bullish Reversal (less likely for now):
Only a clean break and hold above $3,720 would suggest that bulls are regaining control, opening path toward $3,900–$4,000 — though this scenario is weakened after structural damage.
⸻
⚠️ Trader Tip:
Avoid buying into midline reactions in weak channels. Better long setups form after stop-hunts, ideally near bullish OBs + internal BOS confirmations.
⸻
✅ Conclusion
Ethereum remains under bearish pressure after losing its ascending structure. Unless price reclaims the $3,715 resistance zone with momentum, downside continuation remains likely.
⸻
📌 Save this analysis
💬 Share your thoughts or alt wave counts in the comments.
Breakdown Confirmed? ETH Could Drag Alts LowerCRYPTOCAP:ETH support zone around $3,560 has been broken, and current price action appears to be a retest of the breakdown. If ETH fails to reclaim this level, we could see further downside toward the strong demand zone near $3,000.
The RSI bearish divergence also adds to the bearish bias. If this retest fails, altcoins may face deeper corrections, as ETH often leads the market.
DYOR, NFA
ETH Looks Bearish (3D)Ethereum approached the weekly trendline and experienced a correction. It seems likely that we may see one more push upward to create a false bullish sentiment on this coin. There is even a possibility of a fake breakout above the descending trendline. However, before any major move, a significant correction toward the green zone appears likely | after which the main bullish move is expected to occur.
On higher timeframes, this is currently our outlook on Ethereum.
A daily candle closing above or below the invalidation levels would negate the current buy or sell bias.
For risk management, please don't forget stop loss and capital management
Comment if you have any questions
Thank You

ETH, 4000 when? or $2900?Yes, can come to $2900 but before that scalp all the momentums and then create an extent!

Ethereum at Critical Retest – Pullback or Breakout?Ethereum saw a sharp rally followed by a steady climb inside a rising channel. Recently, price broke below the channel’s lower boundary, signaling potential weakness. Now, ETH is retesting the broken trendline, which could be a classic pullback scenario.
Scenario 1 – Bearish Continuation:
If ETH fails to reclaim the channel and rejects around $3,600–$3,650, selling pressure may return.
Potential targets: $3,400 → $3,250 and, in extension, $3,050.
RSI is recovering from oversold levels but still below midline, hinting at possible limited upside before another drop.
Scenario 2 – Bullish Reclaim:
A daily close above $3,650 with strong volume would invalidate the breakdown and suggest a false break.
In that case, ETH could re-enter the channel and aim for $3,850 and the upper boundary near $4,050.
Risk Management:
Bearish entry: Wait for rejection candle on retest → SL above $3,700.
Bullish entry: Wait for confirmed breakout above $3,650 with volume → SL below $3,550.
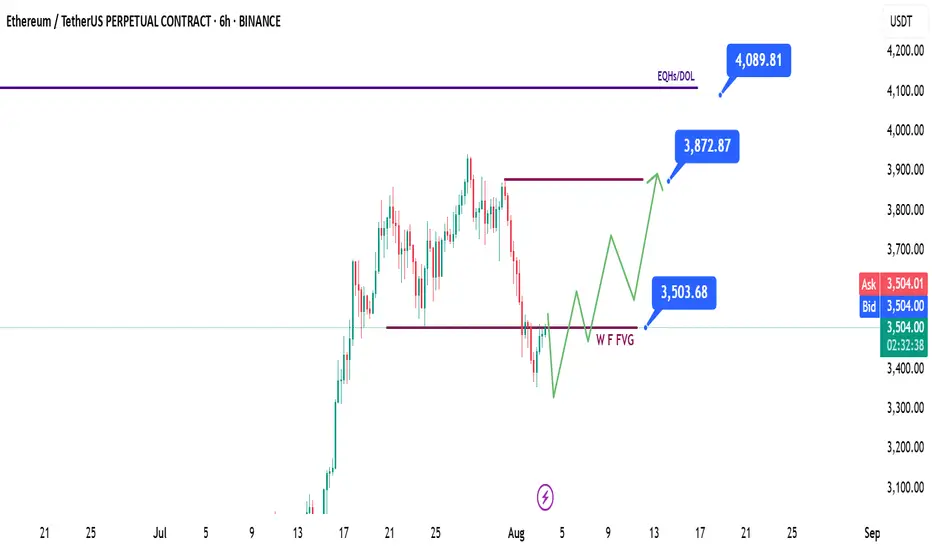
ETH | Ethereum - Weekly Recap & Gameplan - 03/08/25📈 Market Context:
Traders are currently anticipating a potential 0.25% rate cut at the September FOMC meeting, which continues to support the broader bullish outlook.
While the market pulled back following weaker-than-expected Non-Farm Payroll data, overall sentiment remains optimistic.
Greed has cooled off into a more neutral stance. Historically, August often brings some consolidation or pullbacks — but the structural bias for crypto market remains bullish.
🧾 Weekly Recap:
ETH started the retracement movement after building a bullish trend over the past couple of weeks.
It’s mainly being affected by Bitcoin's bearishness, so we’re closely following BTC’s price action.
ETH has tapped into the Weekly Fair Value Gap, which is a key level for me.
We may see a bounce from here.
📌 Technical Outlook & Game Plan:
I expect to see another low on ETH before we go up — as I’m also anticipating one more leg down on Bitcoin.
So I’ll wait for a final bearish expansion and a trap for late sellers before positioning for longs.
After that, I want to see price closing above the purple line at $3500.
🎯 Setup Trigger:
A candle close above the $3500 level will be my signal to look for long setups.
📋 Trade Management:
Stoploss: Below the swing low that breaks above $3500
Take Profit: Targeting $3870, but will trail and lock in aggressively in case of deeper downside expansion.
💬 Like, follow, and comment if this breakdown supports your trading! More setups and market insights coming soon — stay connected!
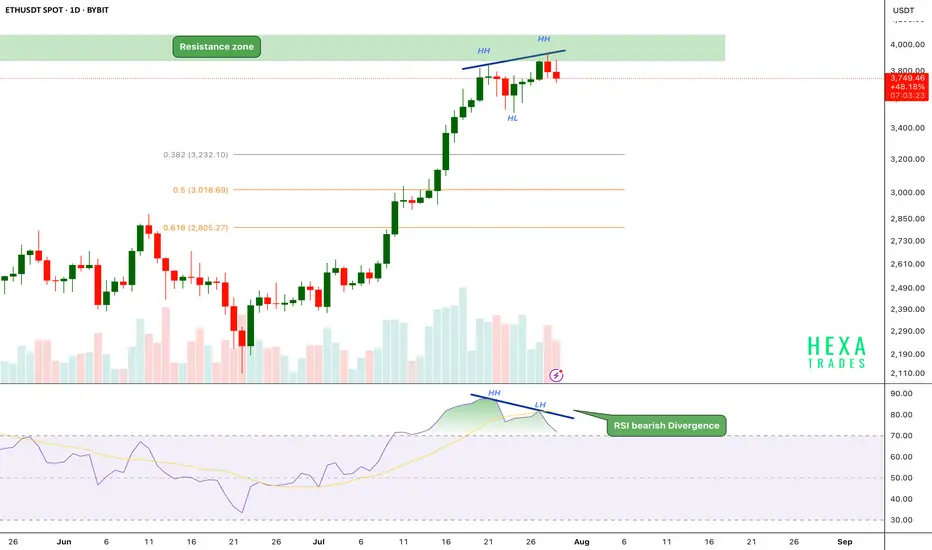
ETH Bearish Divergence!CRYPTOCAP:ETH has been in a strong uptrend, printing consistent higher highs (HH) and higher lows (HL). However, on the daily chart, the price has now reached a critical resistance zone near the $3,800–$4,000 range.
Key Points:
🔸 Bearish RSI Divergence
While price action has formed a new higher high, the RSI has printed a lower high, signaling bearish divergence.
This indicates that upward momentum is weakening even as price attempts to push higher — a common early warning of a possible short-term reversal.
🔸 Fibonacci Retracement Levels
The fib 0.382 at $3240 and 0.5 and 0.618 retracement levels are sitting around $3,000 and $2,800, respectively, potential targets if a correction follows.
🔸 Volume Profile
Volume is gradually declining as price approaches resistance, suggesting buyer exhaustion.
If the price breaks above the $4,000 psychological resistance, we could see a strong bullish move.
ETH is facing strong resistance after a powerful rally, with RSI bearish divergence and weakening momentum hinting at a possible short-term pullback. We should be cautious entering fresh longs here without confirmation.
Support: $3,200, $3,000, and $2,800
Cheers
Hexa
BINANCE:ETHUSDT BITSTAMP:ETHUSD
Ethereum Market Flush, Retrace & Support ZoneEthereum is now on its third consecutive red day and bearish action is fully confirmed. The market is preparing for a strong drop.
As I've been mentioning, this move looked up from a broader perspective is part of a small correction for the last major advance. Ethereum moved up from $2,500 to almost $4,000. Now we get a retrace that ends in a higher low followed by additional growth.
The retrace is now confirmed as Ether needs to test EMA55 and EMA89 as support. If these levels hold, you can count on a reversal right away. If these levels are compromised strongly, then prices can linger lower before a recovery shows up. It should be fast and strong. It should all happen within a few days, the crash and bottom, and the reversal a long-term process; sustained long-term growth, the market will be removing some of the weak hands.
We are going to be experiencing a bull run, are you sure you want to stay?
Protect your positions at all cost. We've seen nothing yet. $8,000 or more by the end of the bull run phase.
Namaste.
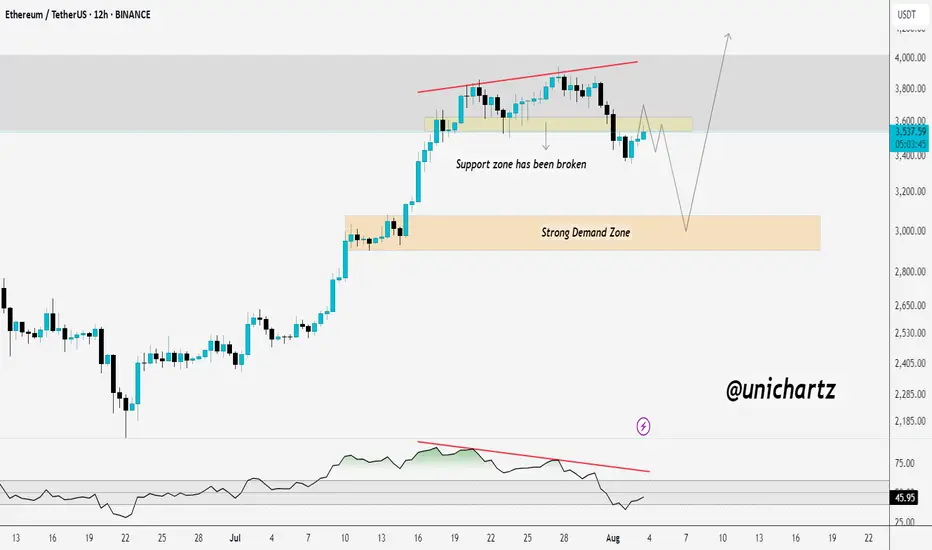
ETH Price Weakens: Watching This Strong Demand Zone Closely$ETH/USDT Analysis (12H)
Ethereum has broken below a key support zone, confirming short-term weakness in price structure.
At the same time, the RSI is showing bearish divergence, signaling slowing momentum while the price was making higher highs — a classic early warning of a potential drop.
Now all eyes are on the strong demand zone below. If ETH finds support there, we could see a solid bounce or even a full trend reversal. But if this zone fails, deeper correction may follow.
DYOR, NFA
Thanks for the reading

ETHUSDT: Elliot Analysis You can see the Ethereum chart in the long term, which indicates the end of the fourth wave and the beginning of the fifth wave, so with capital management, you can have a good investment.

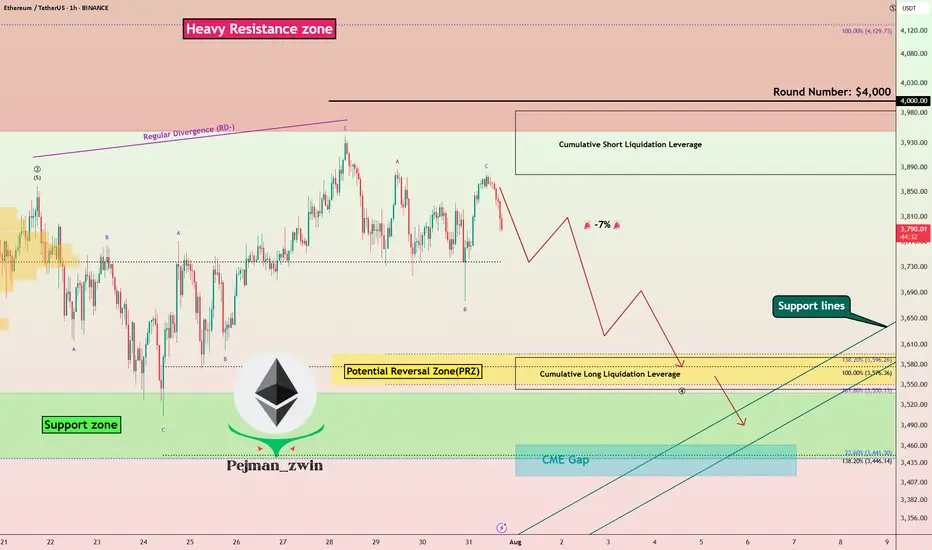
ETH at Critical Resistance + Liquidation Zone | Time to Short?Today I want to analyze Ethereum ( BINANCE:ETHUSDT ) on the 1-hour time frame . Is there a short position opportunity?
Please stay with me.
Ethereum is currently trading near a Heavy Resistance zone($4,390-$3,950) , Cumulative Short Liquidation Leverage($3,983-$3,878) and the $4,000 ( round number ). $4,000 could be a psychological number to sell .
In terms of Elliott Wave theory , Ethereum appears to have completed the main wave 3 at $3,860 and is currently completing the main wave 4 . The main wave 4 could have a Double Three Correction(WXY) or Expanding Flat(ABC/3-3-5) , with the Expanding Flat structure being more likely .
One of the reasons why shorting Ethereum could be better than shorting Bitcoin right now is that ETHBTC ( BINANCE:ETHBTC ) is currently trading above the ascending channel and is likely to correct to Fibonacci levels .
Also, we can see the Regular Divergence(RD-) between Consecutive Peaks.
I expect Ethereum to drop to at least the Potential Reversal Zone(PRZ) and attack the Support lines ( Second target ) .
Cumulative Long Liquidation Leverage: $3,591-$3,543
CME Gap: $3,461-$3,417
Note: Stop Loss: $4,023
Please respect each other's ideas and express them politely if you agree or disagree.
Ethereum Analyze (ETHUSDT), 1-hour time frame.
Be sure to follow the updated ideas.
Do not forget to put a Stop loss for your positions (For every position you want to open).
Please follow your strategy and updates; this is just my Idea, and I will gladly see your ideas in this post.
Please do not forget the ✅' like '✅ button 🙏😊 & Share it with your friends; thanks, and Trade safe.
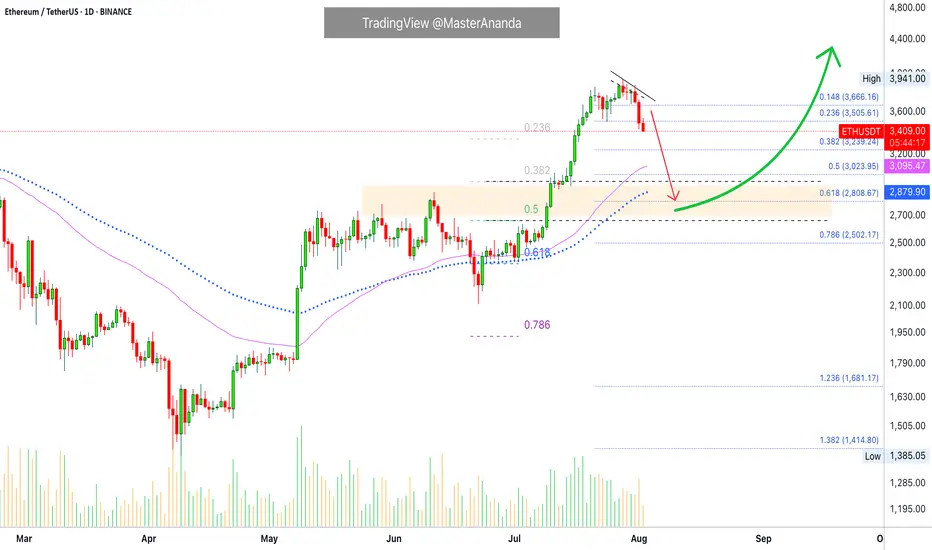
ETH Approaching Major Resistance – Expecting Pullback Hello guys!
Ethereum has been rallying strongly within a well-respected ascending channel, pushing past key levels and now approaching a major resistance zone around $3,900–$4,000.
According to the chart structure, it looks like price could soon react from this resistance, leading to a pullback into the $3,000–$3,200 demand zone, which aligns with the midline of the channel.
This would be a healthy correction before potentially continuing the bullish trend and attempting a clean breakout toward new highs.
ETH is still bullish, but it may need to retest support before continuation.
Watch for a bounce from the $3,000–$3,200 zone for a high-probability long opportunity.

The Loudmouth Pattern: It Yells, We Trade!
On the 30-minute chart, ETH is forming a classic Broadening Formation – or as some traders like to call it, “The Big Mouth Pattern” 😄. It’s noisy, unpredictable at first glance, but when it speaks, you’d better listen.
Right now, price is moving through the bullish leg of this setup, and if momentum holds, we’re eyeing the $4,000 psychological level, followed by the $4,120 – $4,170 supply zone.
🔹 Bullish Scenario (our expected outlook):
🎯 Target 1: $4,000
🟩 Main Resistance: $4,120 – $4,170
❌ Invalidation: Confirmed close below $2,946
If price breaks and holds below that red support zone, this setup gets thrown out the window.
📊 Risk Management:
Scale in on pullbacks – if structure remains valid
No chasing without confirmation
Keep risk under 1% of total capital
📈 The market’s big mouth is open – and until it closes below $2,946, we’re listening for bullish signals. 🤑

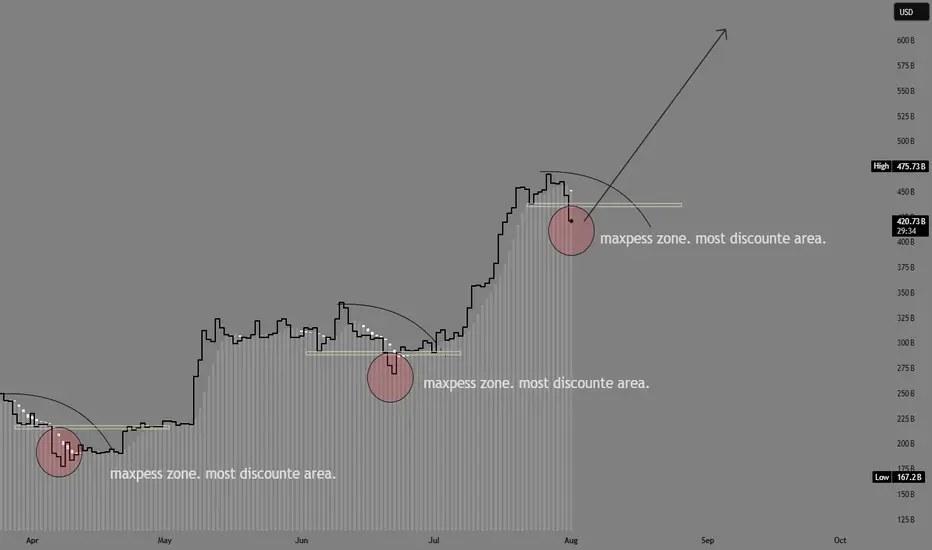
ETH accumulation season 3 has begun at 3.4k. Start loading up!!!ETH has seen impressive price growth for the past few weeks from our original spot at 2.4k -- and it run as high as 3.9k -- almost at our target of 4k.
Now, as with any parabolic moves, eth has to hibernate a bit for that well deserved recharge. This healthy correction at current levels is warranted. 23.6%, 38.2% FIB taps are usually ETHs favorite zone area. This is where most buyers converge as far the most bargain area to position. And we are now at that elusive zone.
A seed from this area is ideal. From our current diagram, you can see we are now on season no.3. This has been doin the same behavior since 160B mcap, and for this next phase, ETH is eyeing 600B mcap from here.
This is in line with our original forecast.
We are now on Month no. 3 as we entered August, my predicted cycle duration would be 17 bullish months till December 2026.
-----------
STONG BUY HOLD at this area. We got a rare elusive season of accumulation that doesnt come very often.
Happy profiting everyone
See you up there.
Spotted at 3.4k
Mid target 5k.
Long term target. 10k.
TAYOR.
Trade safely.
ETHUSDT - FUTURES SIGNAL FUTURES SIGNAL
Coin: ETH
Direction: LONG
🟢Input range: market/3578
✔️ТР: 3726/3902
❌SL: 3501
We work from the order block zone, in which I expect a price reversal.

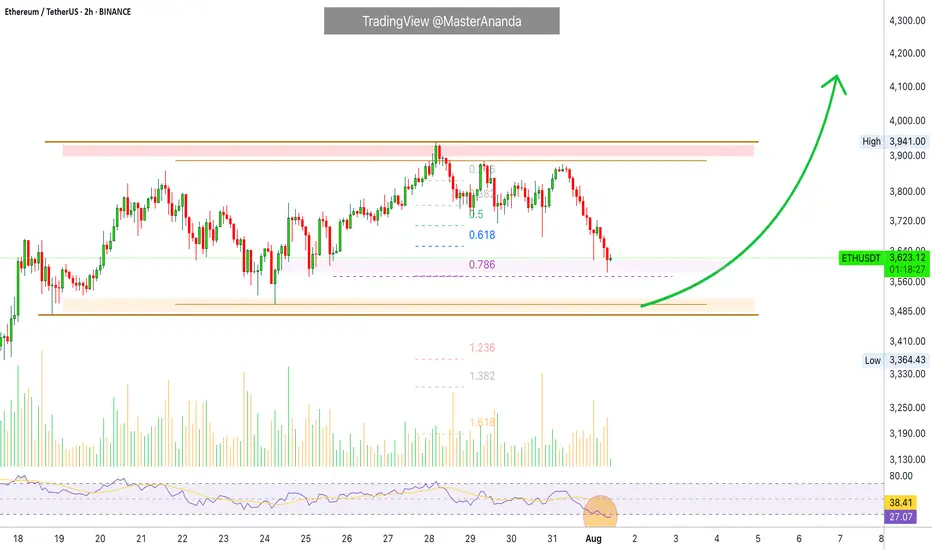
Ethereum Short-Term · Trading within Bullish RangeI am looking at Ethereum short-term using the same timeframe I used for Bitcoin, 2h. We have some interesting signals.
Here ETHUSDT is trading within higher lows. This is interesting because Bitcoin produced a lower low recently. The same volume signal is present here, ETHUSDT has been producing lower bearish volume since last month.
The RSI produced a lower low while ETHUSDT produced a higher low. This is called a hidden bullish divergence. Ethereum's bears did not only fail to take out the last low 24-July but also the previous one, and this clearly reveals bullish support.
The RSI being oversold is also a positive condition and can signal a reversal happening soon. Not truly a reversal because we are not in a downtrend, we are still witnessing a small pause after a strong rise; consolidation near resistance. A continuation reads better.
Ethereum's price continues really strong and the short-term signals are pointing to bullish action being favored in the coming days. We can wait easily and patiently because the best is yet to come. Never SHORT in a bull market, the market will surprise you with how fast things can turn. Better wait for support and go LONG.
Namaste.