$ZRO Structure changed but I'm obviously still bullish
we're going way higher (next post on clarification of what happened? sorry I forgot to post here earlier... my bad)
ETHUSDT

USDT Dominance Chart AnalysisUSDT dominance broke out of a long-term descending channel.
However, it is showing signs of rejection at nearly 4.60% and could head back towards support.
21-day MA (black line): Previously acted as resistance, but now provides some support.
100-day MA (purple line): Was breached, but is now being retested as support.
A red candle after the recent breakout suggests a possible failed breakout scenario.
The green arrow indicates a potential decline towards 4.20% or even lower.
Support: 4.20% (previous resistance, now potential support).
Low Support: 4.00%
Resistance: 4.60%
If you found this analysis helpful, hit the Like button and share your thoughts or questions in the comments below. Your feedback matters!
Thanks for your support!
DYOR. NFA

XNO/USDT Breaks Out from Falling Wedge Anticipating 100%+ GainsXNO/USDT has recently exhibited a significant technical development, breaking out from a falling wedge pattern—a formation often indicative of a potential bullish reversal. This breakout, accompanied by substantial trading volume, suggests a shift in market sentiment towards optimism. Investors are now eyeing potential gains in the range of 100% to 120% or more, reflecting heightened interest in this project.
As of February 10, 2025, Nano (XNO) is trading at approximately $1.34, with an intraday high of $1.58 and a low of $1.098. This price movement underscores the volatility and the emerging bullish momentum in the market. The recent surge in trading volume further reinforces the positive outlook, as increased activity often correlates with growing investor confidence.
The successful breakout from the falling wedge pattern is a pivotal moment for XNO/USDT. Historically, such breakouts are followed by substantial upward price movements, especially when supported by strong volume. The current technical indicators align with this narrative, suggesting that XNO may be poised for significant appreciation in value.
In conclusion, the combination of the falling wedge breakout, robust trading volume, and renewed investor interest positions XNO/USDT as a compelling opportunity in the cryptocurrency market. Traders and investors should monitor this pair closely, as it exhibits the potential for notable gains in the near future.

ETH/USD "Ethereum vs US Dollar" Crypto Market Bullish Heist Plan🌟Hi! Hola! Ola! Bonjour! Hallo!🌟
Dear Money Makers & Robbers, 🤑 💰
Based on 🔥Thief Trading style technical and fundamental analysis🔥, here is our master plan to heist the ETH/USD "Ethereum vs US Dollar" Crypto market. Please adhere to the strategy I've outlined in the chart, which emphasizes long entry. Our aim is the high-risk Red Zone. Risky level, overbought market, consolidation, trend reversal, trap at the level where traders and bearish robbers are stronger. 🏆💸Be wealthy and safe trade.💪🏆🎉
Entry 📈 : "The heist is on! Wait for the breakout (3300.00) then make your move - Bullish profits await!"
however I advise placing Buy limit orders within a 15 or 30 minute timeframe. Entry from the most recent or closest low or high level should be in retest.
Stop Loss 🛑: Using the 3H period, the recent / nearest low or high level.
Goal 🎯: 3800.00 (or) Escape Before the Target
Scalpers, take note 👀 : only scalp on the Long side. If you have a lot of money, you can go straight away; if not, you can join swing traders and carry out the robbery plan. Use trailing SL to safeguard your money 💰.
📰🗞️Fundamental, Macro, COT, Sentimental Outlook:
🌟 Fundamental Analysis
- Increasing Adoption: Ethereum's growing adoption and use cases, such as decentralized
finance (DeFi) and non-fungible tokens (NFTs), are driving up demand and prices.
- Improving Scalability: Ethereum's transition to proof-of-stake (PoS) and the implementation of
sharding are expected to improve scalability, reducing transaction costs and increasing efficiency.
🌟 Macroeconomic Analysis
- Global Economic Trends: The current global economic uncertainty and inflation concerns are
driving investors towards cryptocurrencies like Ethereum, which are seen as a hedge against traditional assets.
- Monetary Policy: Central banks' monetary policies, such as interest rate decisions, can impact
Ethereum's price.
🌟 COT Report
- Speculative Positions: Unfortunately, the latest COT report is not available, but speculative traders are likely to be net long on ETH/USD, indicating a bullish sentiment.
🌟 Sentimental Analysis
- Market Sentiment: Market sentiment is mixed, with some investors expecting a bullish
movement due to increasing adoption and improving scalability, while others are bearish due
to regulatory uncertainty and market volatility.
🌟 Institutional Trader Analysis
- Institutional Positions: Institutional traders are increasingly investing in Ethereum, driven by
its growing adoption and use cases.
- Ethereum (ETH): 60% of institutional traders are bullish, expecting prices to rise, while 40% are bearish.
🌟 Retail Trader Analysis
- Retail Positions: Retail traders are also cautious, with some taking long positions on ETH/USD
due to increasing adoption and improving scalability, while others are taking short positions
due to regulatory uncertainty and market volatility.
🌟 Outlook
- Based on the analysis, the ETH/USD pair is expected to move into a bullish direction in the short term, with a target level of 3800.00. However, the movement is likely to be volatile, and investors should be cautious ahead of regulatory developments and economic data releases.
⚠️Trading Alert : News Releases and Position Management 📰 🗞️ 🚫🚏
As a reminder, news releases can have a significant impact on market prices and volatility. To minimize potential losses and protect your running positions,
we recommend the following:
Avoid taking new trades during news releases
Use trailing stop-loss orders to protect your running positions and lock in profits
📌Please note that this is a general analysis and not personalized investment advice. It's essential to consider your own risk tolerance and market analysis before making any investment decisions.
📌Keep in mind that these factors can change rapidly, and it's essential to stay up-to-date with market developments and adjust your analysis accordingly.
💖Supporting our robbery plan will enable us to effortlessly make and steal money 💰💵 Tell your friends, Colleagues and family to follow, like, and share. Boost the strength of our robbery team. Every day in this market make money with ease by using the Thief Trading Style.🏆💪🤝❤️🎉🚀
I'll see you soon with another heist plan, so stay tuned 🫂


Ethereum Struggles Below $3K – Another Failed Rally Ahead? Over the past few months, Ethereum has been a disappointment for bulls, struggling to maintain momentum.
Despite Bitcoin testing its all-time highs, COINBASE:ETHUSD has consistently rolled back from the 4K resistance, forming lower highs along the way.
Bitcoin’s recent drop to $90K triggered a sharp decline in ETH, pushing it down to the critical $2.1K support zone.
While the price is currently rebounding, I believe this recovery will likely turn into another failed rally.
My bias remains bearish on ETH/USD as long as the price stays below $3K. I’m looking to sell rallies into that zone.
Only a sustained breakout above $3,200 with strong buying pressure would invalidate this bearish outlook.


Ethereum, the leading actor of the ALTseason!Ethereum, the leading actor of the ALTseason!
Ethereum is the main factor that then joins and directs the game!

Be careful with ETHEREUM !!!The price has formed a bullish wedge on the 1h time frame, and if it breaks out, it can drive the price up to around $2900.
Give me some energy !!
✨We spend hours finding potential opportunities and writing useful ideas, we would be happy if you support us.
Best regards CobraVanguard.💚
_ _ _ _ __ _ _ _ _ _ _ _ _ _ _ _ _ _ _ _ _ _ _ _ _ _ _ _ _ _ _ _
✅Thank you, and for more ideas, hit ❤️Like❤️ and 🌟Follow🌟!
⚠️Things can change...
The markets are always changing and even with all these signals, the market changes tend to be strong and fast!!

ETH/USD "Ethereumvs US Dollar" Crypto Market Heist Plan🌟Hi! Hola! Ola! Bonjour! Hallo!🌟
Dear Money Makers & Thieves, 🤑 💰🐱👤
Based on 🔥Thief Trading style technical and fundamental analysis🔥, here is our master plan to heist the ETH/USD "Ethereum vs US Dollar" Crypto market. Please adhere to the strategy I've outlined in the chart, which emphasizes long entry. Our aim is the high-risk Red Zone. Risky level, overbought market, consolidation, trend reversal, trap at the level where traders and bearish robbers are stronger. 🏆💸Be wealthy and safe trade.💪🏆🎉
Entry 📈 : "The heist is on! Wait for the breakout (2900.0) then make your move - Bullish profits await!"
however I advise placing Buy Stop Orders above the breakout MA or Place Buy limit orders within a 15 or 30 minute timeframe. Entry from the most recent or closest low or high level should be in retest.
Stop Loss 🛑:
Thief SL placed at the recent / nearest swing low level Using the 2H timeframe (2600.0) swing trade basis.
SL is based on your risk of the trade, lot size and how many multiple orders you have to take.
Target 🎯:
-Bullish Thieves TP 3500.0 (or) Escape Before the Target
Scalpers, take note 👀 : only scalp on the Long side. If you have a lot of money, you can go straight away; if not, you can join swing traders and carry out the robbery plan. Use trailing SL to safeguard your money 💰.
📰🗞️Fundamental, Macro, COT, Sentimental Outlook:
The ETH/USD "Ethereum vs US Dollar" Crypto market is currently experiencing a bullish trend,., driven by several key factors.
💥 Fundamental Analysis: Bullish
- Ethereum's fundamentals are strong, with a growing developer community and increasing adoption of decentralized applications (dApps).
- The upcoming Ethereum 2.0 upgrade is expected to improve scalability and security.
💥 Macro Economics: Neutral
- The global economic outlook is uncertain, but Ethereum's decentralized nature makes it less susceptible to traditional economic factors.
- Increasing institutional investment in cryptocurrencies is a positive macroeconomic factor for Ethereum.
💥 COT Report:
- Non-Commercial Traders (Speculators): 40% Long, 60% Short
- Commercial Traders: 50% Long, 50% Short
- Non-Reportable Traders: 30% Long, 70% Short
💥 Sentimental Market Analysis: Bullish
- The overall market sentiment for ETH/USD is bullish, with many traders expecting a price increase.
- This sentiment is driven by Ethereum's strong fundamentals, increasing adoption, and upcoming upgrades.
💥 Positioning:
- Institutional Traders: 45% Bullish, 30% Bearish, 25% Neutral
- Banks: 40% Bullish, 35% Bearish, 25% Neutral
- Hedge Funds: 50% Bullish, 25% Bearish, 25% Neutral
- Corporate Traders: 35% Bullish, 40% Bearish, 25% Neutral
- Retail Traders: 55% Bullish, 20% Bearish, 25% Neutral
💥 Price Prediction:
- Short-term (next 30 days): $2,500-$3,500
- Medium-term (next 3 months): $3,000-$4,500
- Long-term (next 6 months): $4,000-$6,000
💥 Overall Outlook: Bullish
- The overall outlook for ETH/USD is bullish, driven by Ethereum's strong fundamentals, increasing adoption, and upcoming upgrades.
⚠️Trading Alert : News Releases and Position Management 📰 🗞️ 🚫🚏
As a reminder, news releases can have a significant impact on market prices and volatility. To minimize potential losses and protect your running positions,
we recommend the following:
Avoid taking new trades during news releases
Use trailing stop-loss orders to protect your running positions and lock in profits
📌Please note that this is a general analysis and not personalized investment advice. It's essential to consider your own risk tolerance and market analysis before making any investment decisions.
📌Keep in mind that these factors can change rapidly, and it's essential to stay up-to-date with market developments and adjust your analysis accordingly.
💖Supporting our robbery plan will enable us to effortlessly make and steal money 💰💵 Tell your friends, Colleagues and family to follow, like, and share. Boost the strength of our robbery team. Every day in this market make money with ease by using the Thief Trading Style.🏆💪🤝❤️🎉🚀
I'll see you soon with another heist plan, so stay tuned 🤑🐱👤🤗🤩

Is Ethereum Ready to Rally? Critical Levels and Elliott Wave InsIf you find this information inspiring/helpful, please consider a boost and follow! Any questions or comments, please leave a comment!
Ethereum Analysis: Key Levels and Market Structure
Ethereum has been moving in tandem with Bitcoin, but there are some distinct levels and market structures developing that are worth paying attention to. While most of the focus has been on BTC, ETH has been presenting some solid trade setups as well. Here’s my breakdown of where we stand and what I’m watching next.
Holding the Low: 2563 as a Double Zig-Zag
Ethereum has been working through a potential 2xZZ (double zig-zag) pattern, and 2563 stands as a key level to maintain that structure. If this low holds, the bullish case remains intact. However, we aren’t currently sitting in a Golden Zone (GZ) or a major discount level based on the recent dump, which adds some caution to aggressive entries.
Bullish Steps: 2665 & 2800 as Critical Resistance
For any bullish momentum to materialize, the first step is 2665—this level needs to break for buyers to start taking control. From there, 2800 is the larger resistance level that Ethereum must break and hold to show real strength. A rejection at this zone could lead to another corrective leg downward.
Confirmation of the Double ZZ: 2900 Break
The completion of the double zig-zag pattern will be officially confirmed with a break of the 2900 pivot. This is the critical point where bullish structure would be fully validated, signaling further upside potential. Until that happens, Ethereum remains in a make-or-break zone.
Until then, I’ll be watching how price action (PA) prints before making any major decisions. What do you think—will ETH break through or are we looking at more downside? Drop your thoughts below!
Trade safe, trade smart, trade clarity.

#ETH Spot Trading Plan📊#ETH Spot Trading Plan💥
🧠From a structural perspective, we are still in a downward trend. Before the downward trend line is broken, we still have the possibility of further decline. 2700-2900 is a short-term support-resistance conversion zone. If your entry point is near this and the position ratio is relatively heavy, you can consider reducing some of your holdings when the price returns here again.
➡️We have a strong rebound after touching the upward trend support line. If we can build a reversal structure of the same cycle near this support line, then we will most likely usher in a new surge. The complex consolidation phase may last until the end of this month or even next month.
➡️Since I already hold 80% of my ETH holdings, I will consider buying the remaining 20% at a lower price (around 1700). My current holding cost is around 2480. If you don’t have any positions, you can buy some around 2200 and wait patiently.
⚠️Note that it is best to use the DCA trading method for spot trading, and you need to be patient enough☕️
Let's see👀
🤜If you like my analysis, please like💖 and share💬
BITGET:ETHUSDT

The key is whether it can rise above the M-Signal of 1M chart
(Title) The key is whether it can rise above the M-Signal of 1M chart
(Example of a trading strategy when trading spot)
-----------------------------------------
Hello, traders.
If you "Follow", you can always get new information quickly.
Please also click "Boost".
Have a nice day today.
-------------------------------------
(ETHUSDT 1D chart)
The key is whether it can rise above the MS-Signal (M-Signal on the 1D chart) indicator after receiving support near the M-Signal indicator on the 1M chart.
If it fails to rise above 2879.90, it is likely to fall to around 2316.10-2513.01.
-
In order to trade, you need to check the support and resistance points when it rises above at least the 5EMA+StErr indicator and shows support.
In other words, it is expected that it will be important whether it is supported near 2879.90.
In order to turn into an uptrend, the price must rise above the M-Signal indicator on the 1D, 1W charts and maintain the price.
Based on the current position, it seems that it will be possible only if it rises above 3136.41.
However, since the 3265.0-3321.30 section is an important support and resistance section, it is expected that the uptrend will continue only if it rises above this section.
-
If you have selected support and resistance points, you should consider whether you can create a trading strategy near that point.
The indicators suitable for creating a trading strategy are the HA-Low indicator and the HA-High indicator.
Since it is currently located within the box section of the HA-Low indicator, you can create a trading strategy when it receives support near the upper point of the box and rises.
The box section of the HA-Low indicator is 2125.01-2921.0.
Accordingly, you can see that it corresponds to an important point around 2879.90.
Then, you can respond depending on whether there is support in the M-Signal indicator of the 1D, 1W chart or the 3265.0-3321.30 section.
-
Spot trading is a place where you can get new opportunities when it falls.
However, if the investment period is short or less, you do not need to set up a trading strategy because you have to make profits while you are making profits.
However, if you are trading for a short or longer investment period, you can sell some of the amount corresponding to the purchase principal and buy back the amount sold when the price falls to increase the holding amount.
On the other hand, there is also a method of selling some of the purchase principal when the price rises after buying and buying back when the price falls.
However, there is a risk because it can rise before buying again when it is on an upward trend.
Therefore, when trading in the spot market, the time of decline is an important time to create a trading strategy, and you have to trade very busily.
If you sell all the amount corresponding to the purchase principal in this way, only the number of coins (tokens) corresponding to the profit will remain, so from then on, you will have pure coins (tokens) with an average purchase price of 0.
I think that increasing the number of coins (tokens) is a good trading method for long-term investment in the spot market.
-
You should always hold about 20% of the total investment amount in cash.
This is because you can get a good opportunity when a large volatility like this occurs.
If you do not have cash, you must sell a certain amount to secure cash.
Even if you are losing money in the spot market, if you increase the amount held by selling and then buying as above, you can convert it into profit more quickly.
In my chart, the MS-Signal (M-Signal on the 1D, 1W, and 1M charts) indicator, which is a trend indicator, is important.
We need to observe in real time to see how to utilize this.
-
Thank you for reading to the end.
I hope you have a successful trade.
--------------------------------------------------
- Big picture
I used TradingView's INDEX chart to check the entire range of BTC.
(BTCUSD 12M chart)
Looking at the big picture, it seems to have been maintaining an upward trend following a pattern since 2015.
In other words, it is a pattern that maintains a 3-year upward trend and faces a 1-year downward trend.
Accordingly, the upward trend is expected to continue until 2025.
-
(LOG chart)
Looking at the LOG chart, we can see that the upward trend is decreasing.
Accordingly, the 46K-48K range is expected to be a very important support and resistance range from a long-term perspective.
Therefore, we expect to see prices below 44K-48K in the future.
-
The Fibonacci ratio on the left is the Fibonacci ratio of the uptrend that started in 2015.
In other words, it is the Fibonacci ratio of the first wave of the uptrend.
The Fibonacci ratio on the right is the Fibonacci ratio of the uptrend that started in 2019.
Therefore, this Fibonacci ratio is expected to be used until 2026.
-
No matter what anyone says, the chart has already been created and is already moving.
It is up to you how to view and respond to it.
Since there is no support or resistance point when the ATH is updated, the Fibonacci ratio can be appropriately utilized.
However, although the Fibonacci ratio is useful for chart analysis, it is ambiguous to use it as a support or resistance.
This is because the user must directly select the important selection points required to generate Fibonacci.
Therefore, since it is expressed differently depending on how the user specifies the selection points, it can be useful for chart analysis, but it can be seen as ambiguous for use in trading strategies.
1st: 44234.54
2nd: 61383.23
3rd: 89126.41
101875.70-106275.10 (when overshooting)
4th: 134018.28
151166.97-157451.83 (when overshooting)
5th: 178910.15
-----------------

ETH Long Spot OpportunityMarket Context:
ETH has retraced into a major support zone, presenting a high-probability long setup. If the price stabilizes and confirms support in this range, we expect a move toward key resistance levels.
Trade Details:
Entry Zone: $2,180 - $2,400
Take Profit Targets:
$2,700 - $3,050
$3,750 - $4,100
Stop Loss: Just below $2,000
This setup provides a favorable risk-to-reward ratio, targeting higher timeframe bullish continuation. Stick to the plan and manage risk accordingly! 📈🔥
ETH MAX PAIN#Ethereum Maximum is the real value that turns pain into maximum gain!
2016-2017 x 2024-2025

Ethereum, reduction priority will continue, averageThe analysis was not disclosed.
I will consider a long-term strategy with very small stop losses. The green line is the entry point (limit order), the red line is the stop loss, and the white line is the take profit. Pay attention to the previous forecast for Ethereum.

ETH/USDT Breakout Watch: Bullish Momentum Building?ETH is forming an ascending triangle , a bullish pattern . The price is testing the resistance near $2845 . A breakout above this level could push it toward $2900-$3000 .
- Bullish Scenario: A breakout above $2845 with strong volume may trigger an uptrend.
- Bearish Scenario: If ETH breaks below $2737 , it could drop to $2611 .
Watch for a decisive move—momentum is building!

EURAUD Analysis Bullish Flag Breakout PotentialEURAUD is currently trading at 1.65600, with a target price of 1.70000. This indicates an expected upward movement of 500+ pips. A bullish flag pattern has been identified, which is a continuation pattern signaling potential further gains. The pattern suggests a temporary consolidation before a breakout to the upside. Traders anticipate a strong bullish move once the resistance level is breached. Volume and momentum should confirm the breakout for a higher probability trade. Risk management is crucial, with stop-loss placement below the flag’s support. Fundamental factors like interest rate decisions and economic data can influence price action. A successful breakout may attract more buyers, accelerating the upward movement. Monitoring price action near resistance is key for trade execution.


Public trade #22 - #ETH price analysis ( Ethereum )💰 In continuation of our global idea for #Ethereum
03/02/25 for the first time liquidations on CRYPTOCAP:ETH exceeded liquidations on CRYPTOCAP:BTC
There are already a lot of “investigations” from Twitterers and not only how manipulative the market drain was on “red-black” Monday, but these are the realities of an unregulated market and “crazy” participants at all levels and ranks!)
They achieved their goal of wresting assets, including CRYPTOCAP:ETH , from weak hands and accumulating them in strong hands for future achievements.
In particular, the Trump family foundation owns $400m+ of #ETH, half of which was bought back at the recent notorious drop.
Well, we need to be in the trend and also bribe #ETH into our investment portfolio and crypto trading
🟢 Desirable OKX:ETHUSDT purchase zone - $2441-$2551
1️⃣ TP1 - $3800-3900
2️⃣ TP2 - $5900-6000
⌛️ And then: we'll see...
_____________________
Did you like our analysis? Leave a comment, like, and follow to get more

Ethereum Analysis – Inverse Head and Shoulders Formationhello guys!
Pattern Formation:
The chart illustrates a bullish inverse head and shoulders pattern, which is a well-known reversal signal indicating a potential shift from a downtrend to an uptrend. The structure includes:
Left Shoulder – A price decline followed by a minor recovery.
Head – A deeper price drop, marking the lowest point.
Right Shoulder – A higher low compared to the head, signaling to weaken bearish momentum.
Key Technical Levels:
Support Area (~$2,175): The price has bounced off this key level multiple times, reinforcing its strength.
Neckline (~$3,100 - $3,200): A breakout above this level would confirm the bullish pattern.
Target Projection: Based on the height of the pattern, a successful breakout could lead ETH to $4,000+.
Bullish Confirmation:
If ETH breaks and closes above $3,100-$3,200, it would confirm the breakout, leading to further upside.
Volume confirmation is crucial – a spike in buying pressure would strengthen the breakout signal.
Bearish Scenario:
If ETH fails to break the neckline, it could retest the support area at $2,400-$2,600 before another attempt.
A breakdown below the right shoulder ($2,400) would invalidate the bullish setup.
Conclusion:
Bullish Bias: The pattern suggests an upcoming rally if ETH surpasses the neckline.
Key Levels to Watch: $3,100 resistance and $2,600 support.
Next Target: If the breakout occurs, a move toward $4,000 is likely.


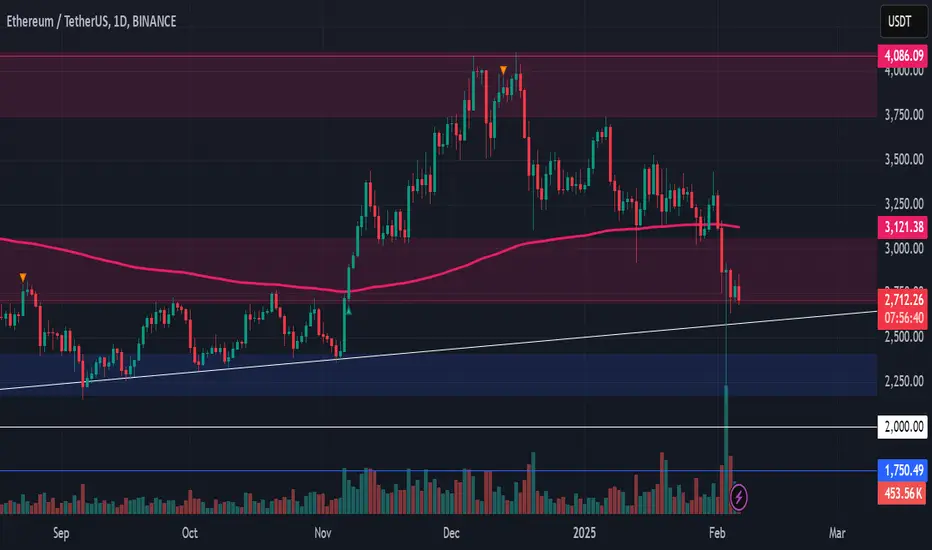
Ethereum (ETH/USDT) Rebound or Further Drop? Critical Levels!!📊 Ethereum (ETH/USDT) Daily Chart Analysis – Feb 4, 2025
🔴 Current Market Overview:
Closing Price: $2,692.12 (-6.52%) 📉
200 EMA Level: $3,128.49 (acting as resistance)
Key Support: $2,250 - $2,400 (Strong Support Zone) ✅
Key Resistance: $3,900 - $4,100 (Demand Zone) 🔥
📉 Price Action Insights:
ETH has seen a sharp decline, breaking below the 200 EMA 🚨.
Price bounced off the Strong Support area, indicating buying interest 📈.
A recovery scenario suggests ETH could retest the $3,000+ zone before heading towards the demand zone near $4,000.
🛠 Trading Strategy:
✅ Bullish Scenario:
A successful higher low formation around $2,750-$2,800 could trigger a move towards $3,250 - $4,000 📊.
Look for confirmation of bullish momentum with volume increase.
🚨 Bearish Risk:
If ETH fails to hold above support ($2,400-$2,500), further downside towards $2,000 is possible 😨.
🎯 Final Thoughts:
ETH is at a critical support; a bounce here could offer a great risk-reward opportunity 🚀.
Keep an eye on 200 EMA resistance and volume confirmation.
💬 What’s your plan? Are you bullish or waiting for more confirmation? 🤔
