Ethereum (ETH/USDT) Rebound or Further Drop? Critical Levels!!📊 Ethereum (ETH/USDT) Daily Chart Analysis – Feb 4, 2025
🔴 Current Market Overview:
Closing Price: $2,692.12 (-6.52%) 📉
200 EMA Level: $3,128.49 (acting as resistance)
Key Support: $2,250 - $2,400 (Strong Support Zone) ✅
Key Resistance: $3,900 - $4,100 (Demand Zone) 🔥
📉 Price Action Insights:
ETH has seen a sharp decline, breaking below the 200 EMA 🚨.
Price bounced off the Strong Support area, indicating buying interest 📈.
A recovery scenario suggests ETH could retest the $3,000+ zone before heading towards the demand zone near $4,000.
🛠 Trading Strategy:
✅ Bullish Scenario:
A successful higher low formation around $2,750-$2,800 could trigger a move towards $3,250 - $4,000 📊.
Look for confirmation of bullish momentum with volume increase.
🚨 Bearish Risk:
If ETH fails to hold above support ($2,400-$2,500), further downside towards $2,000 is possible 😨.
🎯 Final Thoughts:
ETH is at a critical support; a bounce here could offer a great risk-reward opportunity 🚀.
Keep an eye on 200 EMA resistance and volume confirmation.
💬 What’s your plan? Are you bullish or waiting for more confirmation? 🤔
ETHUSDT

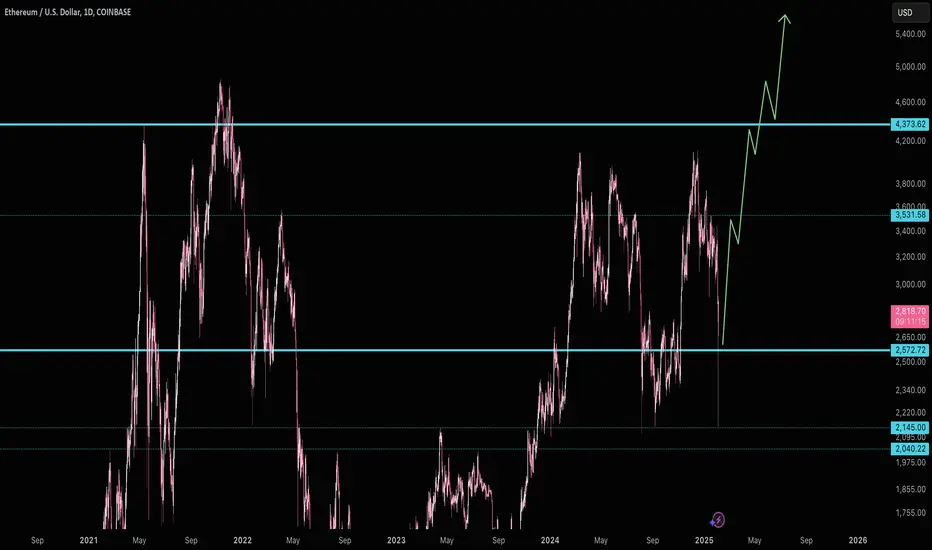
Ethereum Selling ClimaxThis last, uniquely dramatic, move down smells like capitulation for the remaining sellers. It's pretty hard to find any moves similar to February 3rd (May 2021 or covid?). ETH/BTC is in the long term buy zone below 0.0348.
$2570 is the major support, though every attempt down panics below considerably. $3530 is the most near term minor resistance. Upon clearing that, $4373 (the current ATH resistance) is the big resistance to clear. Because of how low ETH/BTC went and the rarity of this sell off I would heavily bet this resistance will be cleared and is highly likely to be our next major support area.
Eth is always the last in the cycle to run, so hold steady, the eth bull market is starting.
Good luck!
#ETH/USDT#ETH
The price is moving in a descending channel on the 1-hour frame and is adhering to it well and is heading to break it strongly upwards
We have a bounce from the lower limit of the descending channel, this support is at a price of 2374
We have a downtrend on the RSI indicator that is about to be broken, which supports the rise
We have a trend to stabilize above the moving average 100
Entry price 2600
First target 2742
Second target 2942
Third target 3127

ETH/USDTFibonacci correction as an option for entering a position after strong moves that periodically occur in the market. I have highlighted the zone from which, in case of a test, we could see a reaction.
Targets for growth:
Target 1 = 2908
Target 2 = 3436

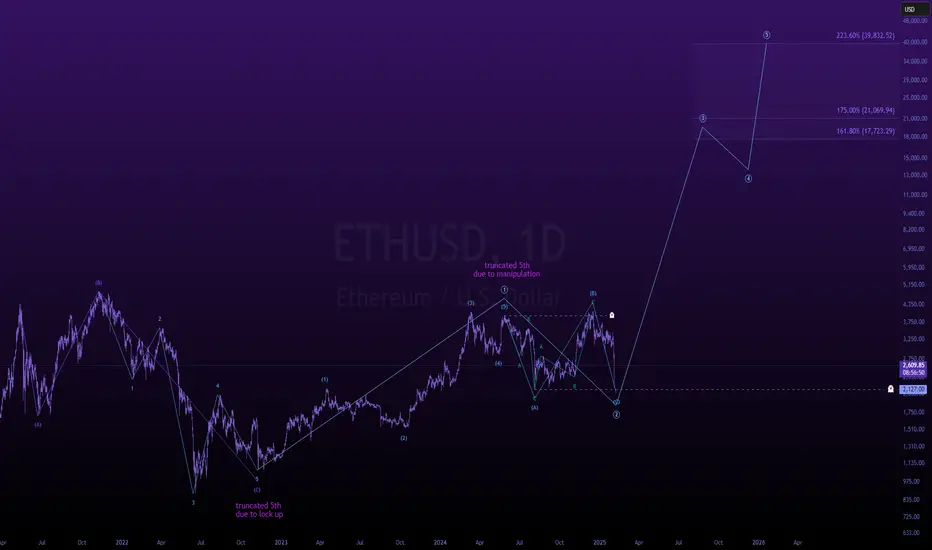
this is how ethereum runs to 39khere’s your rewrite—cutthroat, precise, and undeniable.
---
they mock ether. they doubt it. they call it dead money.
> while the smart money accumulates.
"ethereum is a stablecoin," retail sneers. blind. short-sighted. drowning in their own ignorance.
> while the smart money accumulates.
your sell is our buy. and our buy is what takes us to the levels i have laid out.
thirty-nine thousand dollars for one ethereum. and you hesitated at two.
i'm not telling you to buy. far from it.
what i am showing you is the beginning.
the ignition of one of the largest alt seasons in history.
happening right now.
right in front of your eyes.
---
cash you on the dark side of the moon
🌙
BTC can still WIN After DeepSeek DumpTings are looking rough for BTC and ETH in the daily.
Let's talk about ETH first.
The previous time I posted on ETH, we took a look at a bullish pattern forming - the Inverse Head and Shoulders Pattern.
VS the VERY different picture we see today after the weekly closed underneath support:
Apart from chart patterns and bullish indicators - I was also confident that the price of ETH would increase, as we haven't seen a new ETH all time high, compared to the drastic ATH Bitcoin made. This, would be unusual. So the question remains - why did the pattern fail so miserably?
There is no reason specifically as to WHY chart patterns fail - especially if they seem so strong. Some may argue its whale play, others may say it's a news event etc... But either way, the only real way to safeguard a trade from a failing pattern is to wait for confirmation . And the worst ting is - even then, it may still fail. However, this is by far a safer play than just relying on a pattern that's busy forming. Here's a short idea of what a confirmation would look like on some bullish patterns (blue):
Now, to talk about BTC in the Logarithmic view.
I mapped out the date-ranges, as well as how far the price fell logarithmically after each top. You'll see the word "clicks" on the chart. This simply indicates the amount of diagonal trendlines it has fallen. By using this pattern-dedicated approach, a commonality is found which may be useful in speculating a future price. Because if not for past history, how else would we speculate on the future?
It's interesting to note that the past 3 ATH's (all time high's) are each lower than the previous if you compare it not to price but to the "click lines". Even the fourth high (the one coming next) will be on a lower click-line than the previous, and that estimate is already over 300k. This is a really helpful way to speculate a future high because usually on a regular-view chart, the zone above the ATH is uncharted territory. You could use a Fibonacci trend-based extension, but this is limited to the cycle that you're using for input points. Logarithmic chart + indicators factor in the entire history of the price.
So could it be that this is just another dip in the road towards a new ETH ATH - and potentially even another BTC increase?
______________________
BINANCE:ETHUSDT BINANCE:BTCUSDT

BTCUSDT H4 :UPDATE ROADMAPHi Guys,
If you Follow me ,This is my new analysis for bitcoin in mid-term.
Don't Forget we ha a GAP in 102000$ and Of course in 77000$.
SecondChanceCrypto
⏰ 3/FEB/25
⛔️DYOR
Always do your research.
If you have any questions, you can write them in the comments below and I will answer them.
And please don't forget to support this idea with your likes and comments.

W - Wormholestill sidelined? don't know what to do?
Take a look at NYSE:ZK , CSE:ZRO , and NYSE:W
position yourself accordingly, NFA

ETH/BTC I didn’t anticipate the green box to hit when we began reversing on November 18th, but here we are—it’s a strong reversal zone. If this level doesn’t hold, 28/29 is likely next.
I haven’t seen the strength I expected, even with WLFI (Trump's World Liberty Financial) aggressively buying ETH.
but it's now or never so I except a quick reversal from next week.

$BTC - UpdateI haven’t updated this in a while since the focus has been mostly on alts, but here it is.
Wave 5 can extend, and we’ll reassess once we reach the green zone.

The Cursed Token - $ETHBullish outlook...
On a critical level (Elliott Wave is used as a timeline reference; targets will be evaluated level by level)
Green Box looks good to offload before we hit a major correction later this year. (but once we move beyond this CHOPsolidation, the situation will become much clearer for assessment.

ETH Altseason soonTHis was the dip of market, next few months will be bullish and we will see lot of new ATH

ETH/USDT : Get Ready for the next Bullish Move! (READ)By analyzing the weekly (logarithmic) chart of Ethereum, we can see that the price experienced a sharp crash last night, dropping to $2100. After reaching this key demand zone, Ethereum rebounded and is currently trading around $2600.
As long as the $2200 support holds, we can expect further bullish momentum. The mid-term targets for Ethereum are $3900, $4600, $5700, and $7400. 🚀
Please support me with your likes and comments to motivate me to share more analysis with you and share your opinion about the possible trend of this chart with me !
Best Regards , Arman Shaban

eth longterm buy sell limit"🌟 Welcome to Golden Candle! 🌟
We're a team of 📈 passionate traders 📉 who love sharing our 🔍 technical analysis insights 🔎 with the TradingView community. 🌎
Our goal is to provide 💡 valuable perspectives 💡 on market trends and patterns, but 🚫 please note that our analyses are not intended as buy or sell recommendations. 🚫
Instead, they reflect our own 💭 personal attitudes and thoughts. 💭
Follow along and 📚 learn 📚 from our analyses! 📊💡"

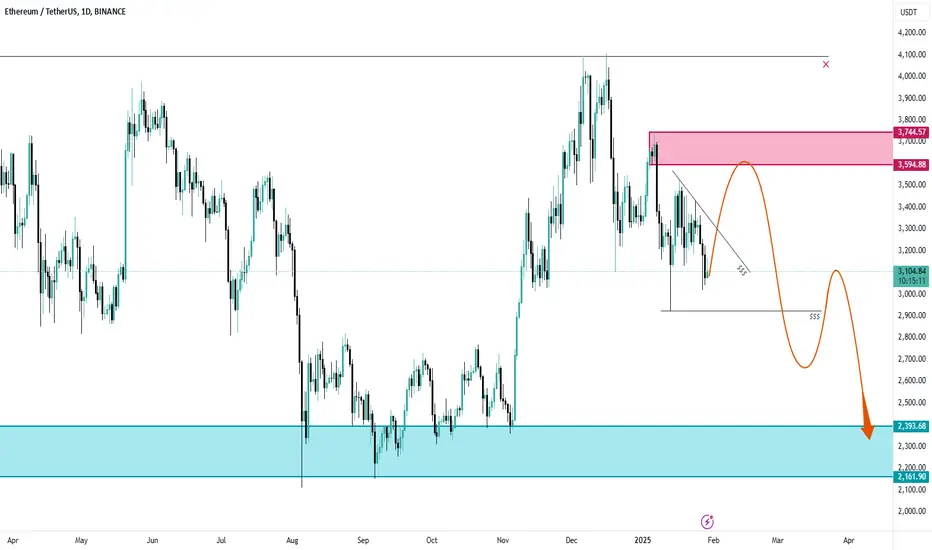
ETHUSDT; Will we see 2400 again ?Hello traders, hope you're doing great.
for upcoming days, I expect an upward correction to 3600- 3750 level and after that a downward movement in this pair, we also have liquidity below 2920 that increases our theory. Remember that today we also have FOMC meeting and can cause volatility in market .
And finally tell me what are your thoughts about ETHUSDT; UP or DOWN ? comment your opinion below this post.

First 2,725$ Then 4,958$My near term game plan.
Bullish Gartley and Fibonacci levels.
1. Target 2,725$
2. Target 4,958$
3. Target 6.227$
* What i share here is not an investment advice. Please do your own research before investing in any digital asset.
* Never take my personal opinions as investment advice, you may lose all your money.

ETHEREUM - Vitalik Birthday CandleEthereum is forming an inverse head and shoulders pattern.
When Ethereum starts moving, altcoins will start moving too.

a l t s e a s o n b e g i n sread that title one more time anon,
and then again.
bookmark this post,
come back to it in a few months and tell me you made money,
or come back to it, and tell me how wrong i was.
either way,
this is the primary.
---
there is blood on the streets, so i come here on this eve' to share my perspective, to shed a little light on how i'm looking at this structure. i don't have to put this update out today, i really don't, but i'm doing it for you, the people. if i'm wrong, so be it, but if i'm right, donate a portion of your winnings to a charity and go live out the rest of your life away with a smile on your face.
---
my theory on ethereum is simple,
i'm labeling the entire move from november 2021 -> november of 2024 as a triangle.
for this triangle to work out, it is imperative for ethereum to stay above 2359.29 which is the hard invalidation on my idea.
sweep this low, and ethereum can see a liquidation down to $800, where the real trench will be discovered.
---
keep in mind, i am not a financial advisor, this is simply my best bullish take on a market which so many are fleeing from, during a time where alt season is on the verge of beginning.
🌙
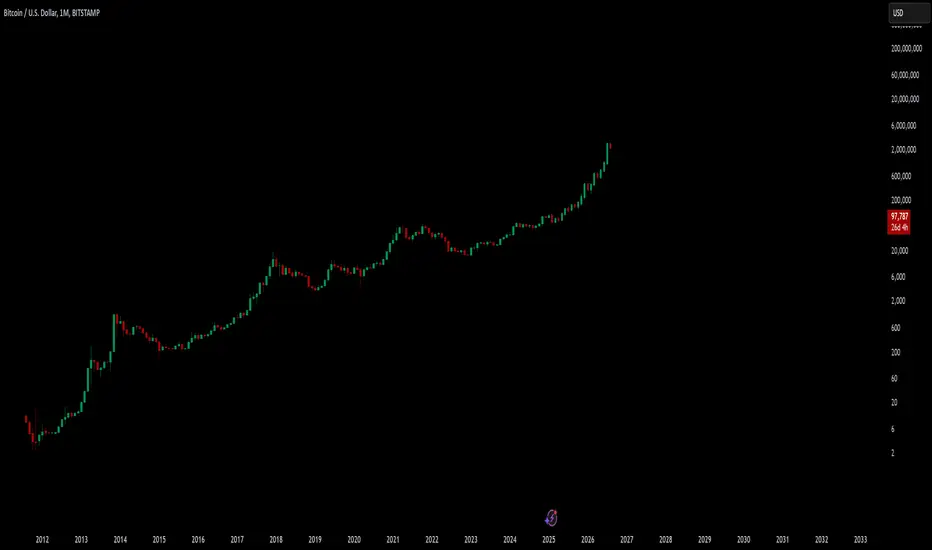
Bitcoin Monthly Projection | $2.5 Million Mid-Late 2026 I expect Bitcoin to hit $2.5 Million by Mid to Late 2026 mainly catalyst is massive inflation event from Trumps trade war. And collpase of Americans Republic. And massive Dollar failure
eth is dead :)#Ethereum parabolic run is inevitable and there is nothing you can do about it!
If the concept of the classic discourse (#Ethereum is dead), which is frequently encountered in previous cycles, has started to be used again by investors, the parabolic run of CRYPTOCAP:ETH is closer than we expected.

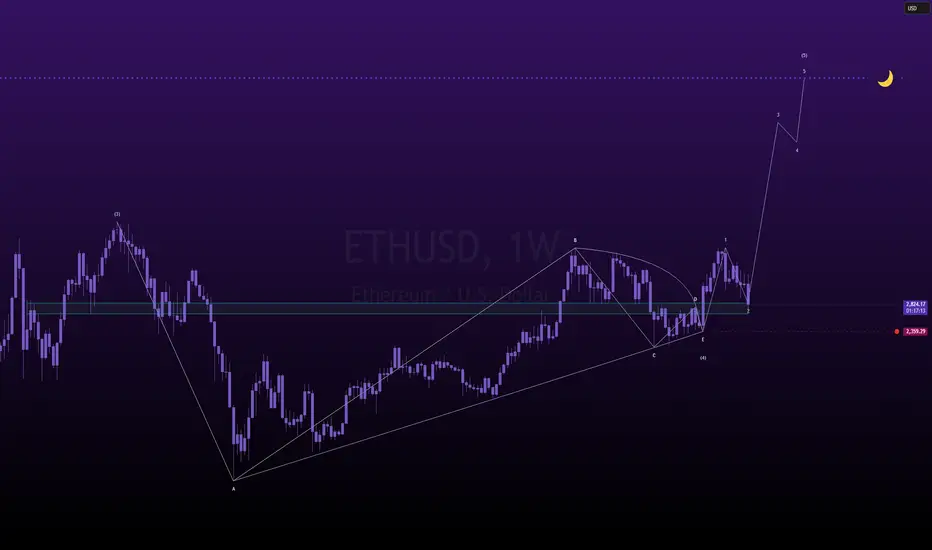
ETHEREUM NEAR ABOUT TO EXPLODE !!!We may see Ethereum drop upto 2700. where maximum chances are of completing it's C wave of micro wave (ii).

ETH Secondary trend. Channel. Potential triangle. 25 12 24Logarithm. Time frame 3 days.
With altcoins (overflow of profits from bitcoin, now) along with XRP this is asset #1 for pumping, the reason for this is liquidity, which is extremely necessary for large capital. The average price of 1 distribution zone is conditionally 10 thousand. These are not the maximums of the cycle.
When the price lingers in this zone and there is a massive positive news background, all L2 assets, which are now in their accumulation zones, or in retests of breakout zones, will "fly" to super pumps (this is what it is). In percentage terms, they will show an order of magnitude greater profit in their distribution zones. Remember, as a rule, such assets (low liquidity) are first pumped by an aggressive pump (to leave in parts, without regret) by a huge %, and only then is a distribution zone formed on a rollback (channel, triangle ...) (hope for a huge profit on the continuation of the pump).
This idea is a continuation of this idea (which I can't update) of a secondary trend, the goals of which have been achieved with utmost precision:
ETH/USD Secondary trend. Bullish triangle. Breakout. Target 96% 11 11 2023
It is worth noting that now in the news background: "ether is bad" , huge fake short positions for the news background. Many crypto media personalities speak negatively about the “prospects” of this very promising cryptocurrency of the “American” (Jewish) transnational financial conglomerate JPMorgan Chase (size of depository assets — $ 32.4 trillion, size of assets under administration — $ 7.7 trillion, etc.). What kind of lack of prospects can we talk about??
If they “stink” a lot to create public opinion, then there is probably an interested party in this. That is, it is worth doing everything the opposite of what they want to inspire, and as a result, tilt supply/demand in a favorable direction, which, as a rule, is always unprofitable for most market participants.
If you are an investor , then buy at any price (you can use martingale in parts, or place trigger orders for a breakthrough of important zones), and do not be interested in the opinion of the majority (meaningless market noise) and the news background (manipulation, deception). Sell in the distribution zone (time is known in advance when, 2 zones) with a huge profit, as for a liquid trading instrument.
If you are a small investor or trader , then pay attention to the L2 group of assets and ETC (big pump “stick”), and use ETH itself as an indicator of “when”.
Also, the idea shows an unlikely scenario, or rather two scenarios. Consider this in your risk management.
The idea of the main trend , published several years ago. Which, of course, is still relevant now. Everything develops organically, and extremely precisely according to plan.
ETH/USD Main trend Pump/dump cycles. Accumulation/Distribution 8 09 2022
Trend in general for clarity now.
locally this potential triangle (it doesn't exist yet) looks like this.
