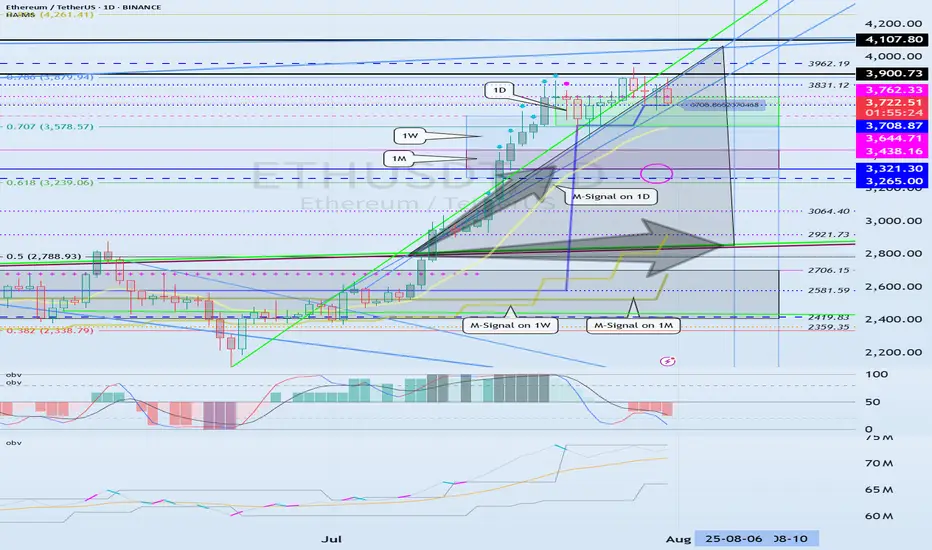
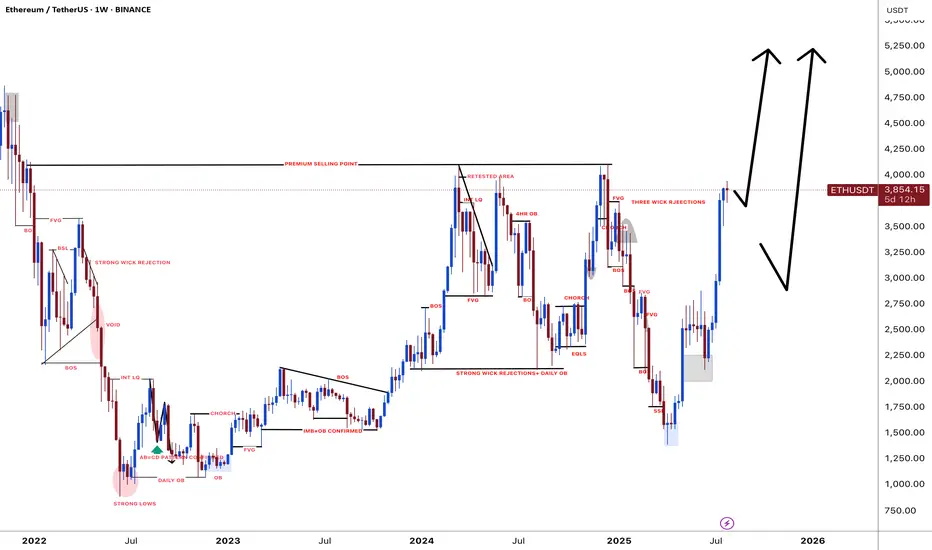
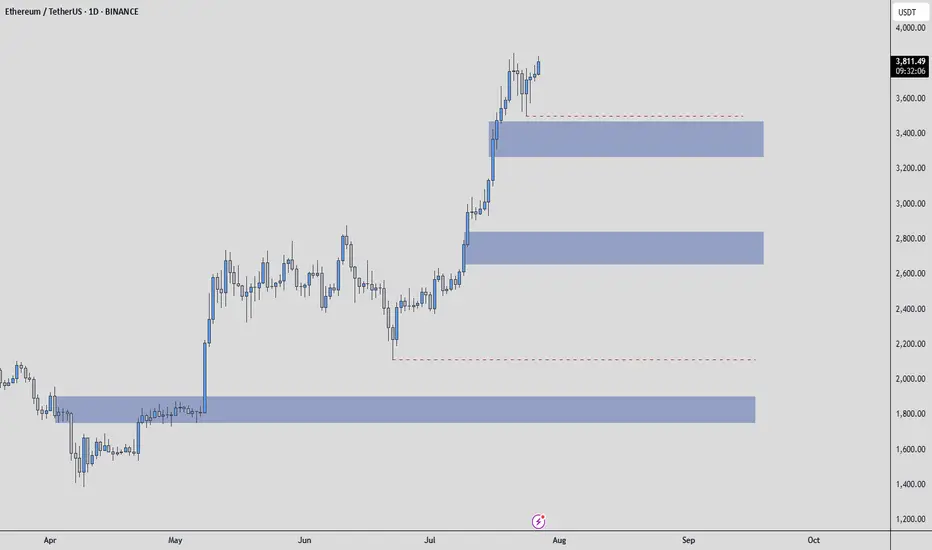
The key point to watch is whether it can rise to 3900.73-4107.80
Hello, traders. Nice to meet you.
If you "Follow," you'll always get the latest information quickly.
Have a great day.
-------------------------------------
(ETHUSDT 1D Chart)
The upward trend continues, with the M-Signal on the 1D chart > M-Signal on the 1W chart > M-Signal on the 1M chart.
Therefore, if the price holds above 3265.0-3321.30, a medium- to long-term uptrend is likely.
Currently, the HA-High ~ DOM(60) range is formed across the 3265.0-3762.33 range on the 1M, 1W, and 1D charts.
Therefore, the key question is whether support is found within the 3265.0-3762.33 range.
-
While the price is trending upward along the short-term trendline, if it falls below the short-term trendline and encounters resistance by falling below the M-Signal indicator on the 1D chart, a decline to the 3265.0-3321.30 range is likely.
ETH's volatility period is expected to last from August 6th to 10th.
The key point to watch is whether it can rise above the 3900.73-4107.80 range after this volatility period.
-
Since the StochRSI indicator has entered an oversold zone, the downside is likely to be limited.
Since the OBV indicator of the Low Line ~ High Line channel remains OBV > OBVEMA, a significant decline is unlikely.
However, since the TC (Trend Check) indicator is below zero, selling pressure is dominant.
Therefore, a decline below 3708.87 could lead to further declines. However, as previously mentioned, the decline is likely to be limited, so a significant decline is not expected.
Once the M-Signal indicator on the 1D chart is encountered, the trend is expected to re-establish itself.
-
Thank you for reading to the end.
I wish you successful trading.
--------------------------------------------------
- This is an explanation of the big picture.
(3-year bull market, 1-year bear market pattern)
I will explain in more detail when the bear market begins.
------------------------------------------------------
ETHUSDT
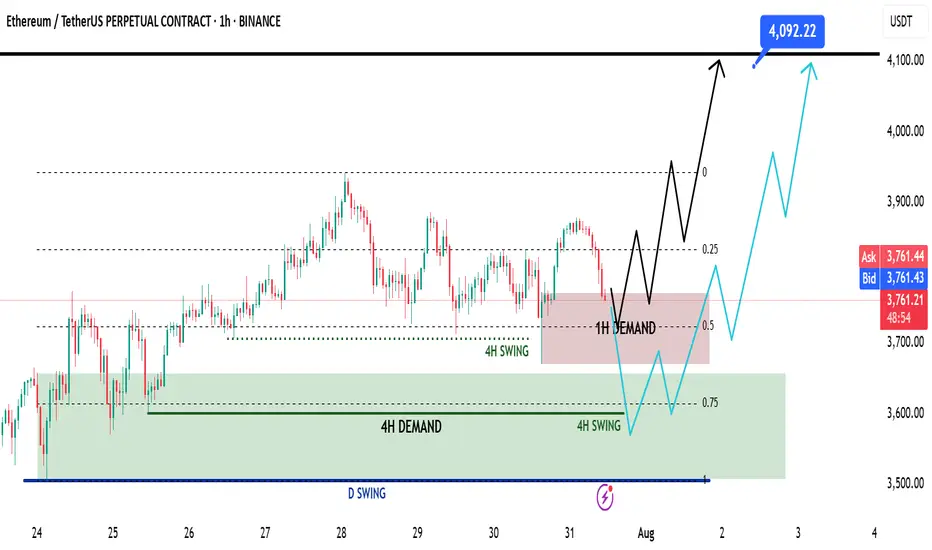
Ethereum Mid Week Update - Swing Long Idea📈 Market Context:
ETH remains in a healthy bullish structure. Despite the recent retracement, price action is still supported by strong demand zones on higher timeframes. No change in the overall sentiment from earlier this week.
🧾 Weekly Recap:
• Price rejected from the Fibonacci 0.5 EQ level — a discounted zone in my model.
• While doing so, it also ran 4H swing liquidity.
• After taking liquidity, ETH formed a 1H demand zone — a sign to look for lower timeframe confirmations for long setups.
📌 Technical Outlook:
→ Price has already tapped into the 1H demand zone.
→ From here, we have two possible scenarios:
Black scenario (ideal):
• Wait for 15M bullish break of structure (BOS).
• Enter after confirmation for long setups from 1H demand.
Blue scenario (deeper retrace):
• If no bounce from 1H demand, expect price to dip toward 0.75 Fib level (max discount).
• Watch for another liquidity run & 1H–4H demand formation.
🎯 Setup Trigger:
✅ 15M bullish BOS inside 1H or 4H demand zones
→ This would be the entry confirmation trigger for longs.
📋 Trade Management:
• Stoploss: Below the swing low of the 15M BOS
• Target: 4090$
💬 Like, follow, and drop a comment if this outlook helped — and stay tuned for more setups each week!
Crypto Exploded, I Missed it, What should I Buy Now?!The market suddenly exploded… green candles after green candles. Yesterday, you were hesitating to look at the chart, today everyone on social media is posting their profits. So what now? Did you miss out? It’s not too late. The main question now is: What should I buy to catch up?
If you read this analysis till the end, not only will you learn some practical TradingView tools, but you’ll also gain insight into how to act like a professional trader after big pumps not like a reactive follower.
Hello✌
Spend 3 minutes ⏰ reading this educational material.
🎯 Analytical Insight on Ethereum:
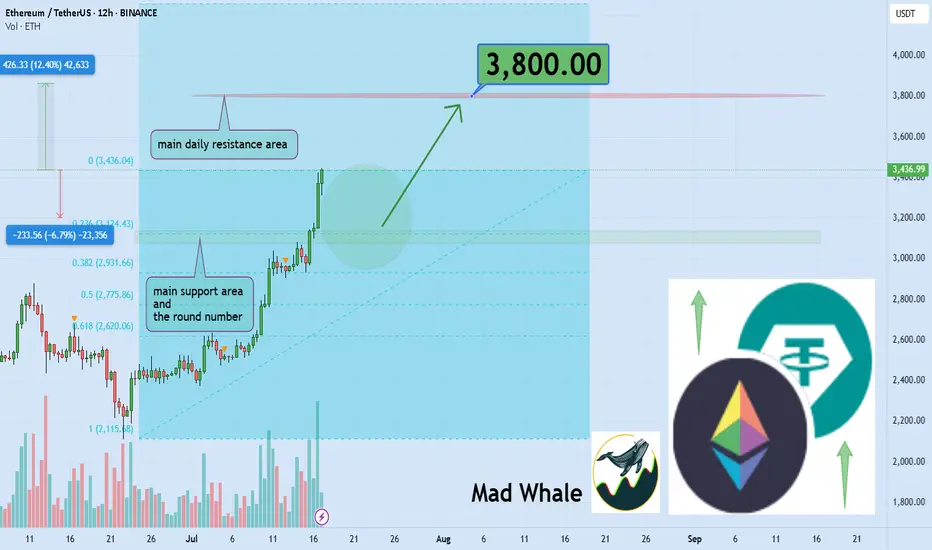
BINANCE:ETHUSDT is currently holding near the daily support and the key psychological level at $3,000, which also matches the 0.23 Fibonacci retracement. A potential upside of at least 12% is expected, targeting $3,800 close to a major daily resistance zone. Keep an eye on these levels for possible trade setups 📊⚡.
Now , let's dive into the educational section,
🧠 FOMO: The Enemy That Devours Your Profits
If you feel like you missed the boat now, don’t panic. Everyone has felt that, even top traders. It’s called "FOMO." Jumping into the market without analysis and just on emotions can burn you badly. Instead of regretting, sit calmly, analyze, and wait for the right setup. The market always offers new chances you just need to know how to hunt them.
🔍 What to Buy Now? Logic Over Emotion
There are three types of coins still offering opportunity:
Coins that haven’t broken their previous highs yet
Like a compressed spring, they can jump higher with a small push.
Altcoins lagging behind Bitcoin
When BTC pumps, alts usually follow afterward.
Coins with strong upcoming fundamental news
Networks with upcoming updates or special events that generate excitement.
Don’t forget on-chain analysis. See where money is flowing.
🌟 Look for New Stars and Strong, Established Coins
After a pump, there are two ways to hunt:
🔹 New Stars
Altcoins that are just coming out of their correction phase and haven’t had their main pump yet.
🔸 Strong and Established Coins
Assets that have shown resilience, have strong fundamentals, and tend to pump again after corrections.
Balance your portfolio with both to lower risk and maximize profit potential.
🧰 TradingView Tools to Hunt Opportunities After a Pump
To avoid missing out in the second phase of the market explosion, you must use TradingView’s analytical tools correctly. Here are three key tools you should know right now:
Volume Profile
Helps you understand where most trading volume occurred. Smart money usually buys and sells heavily at these points.
RSI (Relative Strength Index)
Tells you when the market is overbought. When it drops back to the 40 to 50 range after a peak, that could be a good re-entry point.
Fibonacci Retracement
A tool to find attractive correction zones after a pump. Especially useful if you combine multiple timeframes.
⚖️ Stop Loss Is Necessary, But Take Profit Is More Important
Always place a stop loss in the market. But many forget to set a take profit in bullish markets.
Having a take profit level ensures you lock in gains when the market hits your target and avoid greed.
Key point: Even if you expect huge pumps, take some profit on time to avoid losing it all during corrections.
🪙 The Next Pump Is Just Around the Corner
Instead of jumping into a pump mid-way, focus on spotting setups just forming. Watch for consolidation candles, rising volume, and reactions to classic zones. That’s where you can enter professionally, even before everyone knows what’s coming.
🛠 Game Plan for the Trader Who Fell Behind
Pick three coins that haven’t pumped yet
Test the tools mentioned on them
Set alerts for logical entry signals
Enter with risk management, not emotion
Most importantly analyze, don’t just follow
📌 Summary and Final Advice
If you missed the market pump, don’t worry; crypto markets always offer opportunities you just need to be prepared. A combination of analysis, professional tools, and smart choices between new and established assets can help you not only catch the next pump but ride it ahead of everyone else.
✨ Need a little love!
We pour love into every post your support keeps us inspired! 💛 Don’t be shy, we’d love to hear from you on comments. Big thanks , Mad Whale 🐋
📜Please make sure to do your own research before investing, and review the disclaimer provided at the end of each post.
ETHUSDT - SCalp your day!Small scalps, extreme targets on yellow mid targets on the green, Keep in mind that a temp spike can happen for a fall, to a great extent, maybe?

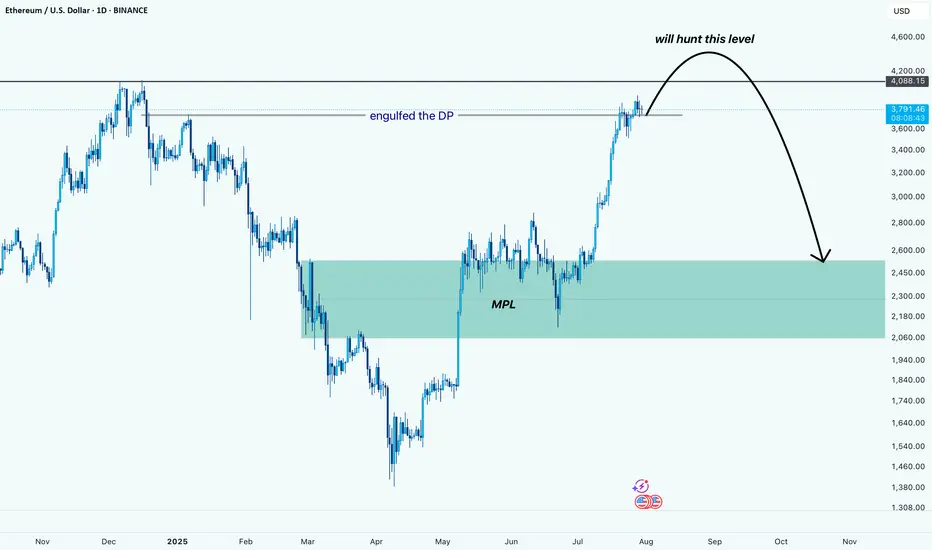
ETH (just a perspective): Potential Liquidity Grab Before DeeperPrice has engulfed the DP and is now pushing higher. Based on the current structure, it looks like ETH wants to hunt the liquidity resting above the $4,080 level.
After grabbing that liquidity, we might see a sharp reversal back down toward the MPL, which sits in the $2,100–$2,500 zone. This area is a strong demand zone and also where the most pain would be felt for late buyers, making it a key level to watch.
⚠️ This is not a prediction, just a perspective based on price behavior and structure.
Ethereum Above $4,000 Bullish Signal RevealsNo major drops and low volatility is a major bullish signal. Ether is bullish now with all sellers gone. Look at the down wave from December 2024 and see what three days red would do to Ethereum's price. Today we are on the third red day and ETH is hardly a few dollars below the most recent peak. A signal of strength. This strength also means that we are likely to see a continuation of the bullish move soon, Ether will continue growing.
Good morning my fellow Cryptocurrency trader, I hope you are having a wonderful day.
Everything seems calm now, a small pause... Sell at resistance, buy at support; right?
Well, not always. It depends on the context.
Here we have a rising trend and Ethereum has been advancing nicely. Now we reach resistance, is this the time to go SHORT? It is possible to SHORT at resistance and do good but here we have a very clear uptrend. When ETHUSDT peaked 28-July there wasn't much selling. This is telling us that the bullish move is not over, not complete.
Ethereum will produce additional growth. Seeing this, it would be unwise to sell SHORT. If prices drop, it is better to wait for support and go LONG. Trade with the trend, it reduces risk and increases your chances for success.
Namaste.

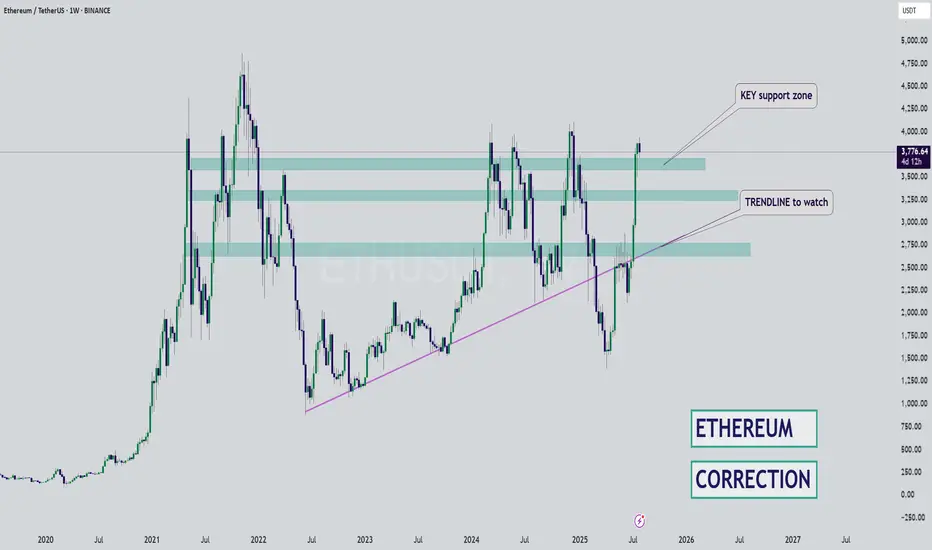
ETH - Bounce Zones - Nears the End for BULLSHello Fello's ☕
I'm watching Ethereum today and I believe it may be very close to the end of it's bullish cycle.
I think what could become likely is an extended altseason, where Bitcoin trades around the same price for some time, and Ethereum increases slightly. Afterwhich smaller altcoins (by marketcap) make random rallies before the beginning of a bearish cycle (which is due, see my previous BTC update).
There's an interesting channel here that previously determined bounce zones... I don't believe the channel itself will hold as much value going down, but this zone may be a likely bounce zone - around $3k.
Key bounce zones to watch include:
I'm not saying it will be this straightforward, but this image demonstrates the power of bounce zones for swing trades:
Next update will be when we've lost the first support zone.
Until then!
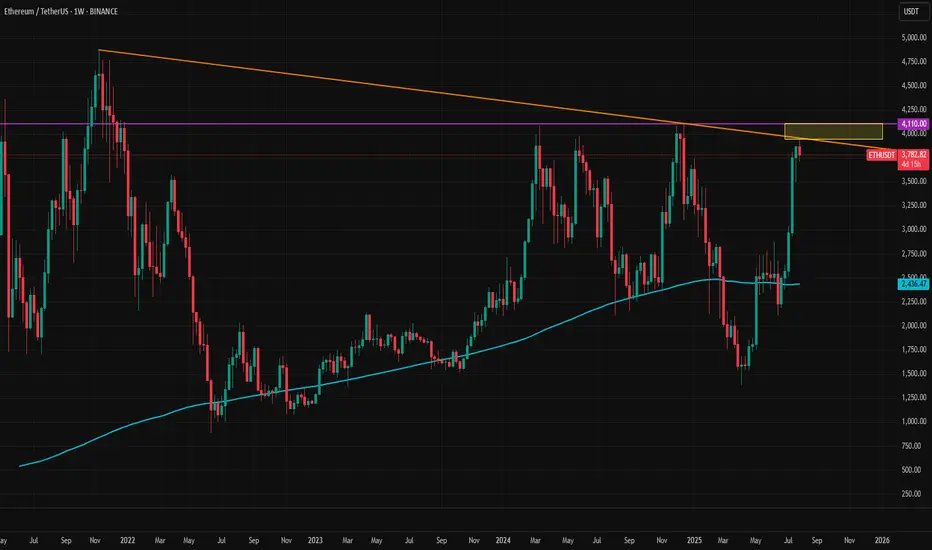
Ethereum Tests Key Long Term ResistanceEthereum continues to push higher, but a key resistance zone is causing a pause in the upward movement. Every day brings new positive developments for the crypto market, from ETF to tokenization news. This pattern reflects the typical progression of a crypto bull cycle. The latest SEC decision regarding a crypto-based ETF adds to the bullish backdrop.
However, a rising dollar index and a slowing momentum of U.S. stock market are having a short-term negative impact. Another reason for the current slowdown is the presence of massive resistance. The long-term trendline from the 2021 top, combined with the horizontal 4100 level, has formed a major resistance zone for Ether.
In the short term, ETHUSD may have formed another flag pattern. If it breaks to the upside, a retest of the 4100 resistance is possible. Today, dovishness level of Powell and the number of dissents in the rate-hold decision could significantly influence the price action.
ETHUSD 8H — Strategy Nailed the Breakout, But Is $4K Next?This Ethereum 8H chart captures a powerful trend reversal, triggered by the **Enhanced Ichimoku Cloud Strategy V1**. After months of chop, the system delivered a clean entry and held the full breakout — now nearing key resistance around \$4K.
---
**📊 Setup Breakdown:**
* Entry triggered after **three major confirmations**:
* Breakout above long-term trendline
* Flip above the **171 EMA**
* Bullish **Ichimoku Cloud alignment**
* Strategy entered long near **\$2,530**, and has held the move for over 80 days
* Current price: \~\$3,988 — a **+57% trend** captured without exit signal
---
**⚙️ Strategy Logic:**
The strategy uses:
* Custom Ichimoku inputs: *(7 / 255 / 120 / 41)*
* A 171 EMA trend filter for signal clarity
* Optional “Cloud Mode” to confirm direction
* A memory-based system that reduces false chop signals
On this trade, the system **ignored mid-trend noise**, stayed in position, and let the move fully play out — exactly what it’s designed for.
---
**🔍 What to Watch Next:**
* Price structure remains bullish as ETH nears the psychological **\$4K resistance**
* Cloud support rising beneath — confirming healthy structure
* A clean break above \$4K could trigger another leg, while rejection may form a range
---
This is a prime example of how **low-frequency, high-conviction signals** can lead to massive upside when paired with disciplined exits. Backtest this strategy on your favorite altcoin pairs and compare.
Let me know when you’re ready to move to the next chart brother — this one’s ready for the spotlight 🔥

ETH: Will Price Continue Upwards Movement! ETH has been steadily bullish in recent times, as the crypto market experienced a significant increased a safer option to invest around the global investment community. DXY and other major currencies currently experiencing a major drawdown in prices which indirectly helping the crypto market to remain bullish. While looking at how eth has performed in recent past, we can see it creating a record high in coming weeks.
#ETHUSDT: Price is going as expected in previous ideas on eth!!ETHUSDT is performing well as expected in our previous analysis, as the price has reached the $4000 area. There are two potential areas where the price could reverse. The first is a small correction, which could cause a sharp price reversal without a significant price correction. The second area is a void price, which may be filled before any further strong bullish movement.
Please use strict risk management while trading.
Team Setupsfx_
Ethereum - Time to buy again!It can be said that the price has formed a cup and handle pattern, which it is completing soon. If the price follows this pattern, it can be expected that Ethereum will reach its peak again.
Best regards CobraVanguard.💚
Ethereum the HIGHEST MONTHLY CANDLEEthereum is closing its highest monthly candle since 2021, signaling very bullish months ahead, with $8,000 as the resistance.
Ether Update · Accumulate, Buy & Hold · 2025 StrategyGood morning my fellow Cryptocurrency trader, I hope you are having a wonderful day.
Ethereum continues really strong and today is trading at the highest price since December 2024. Right now getting close to a long-term resistance zone that was first established in March 2024. As soon as ETHUSDT manages to break $4,100 as resistance, we can expect a major advance toward a new all-time high. Remember, sustained long-term growth, just as it is happening already. Notice the slope on the rising wave since April. It will continue just like this, prices going higher and higher until a final jump produces very high prices based on a long wick.
Market conditions have not change since our last update. Everything is extremely bullish and the chart looks even better now, the rest of the market is also looking better so the focus should be on hold and preparing a profit taking strategy. How will you profit from this trade? How do you intend to sell? How will you reduce or close your position when the time is right? You can start preparing now.
There are many ways to approach the targets but it is always wise to wait at least until a new all-time high. Since we have enough data support a new all-time high as a high probability scenario, we want to benefit as much as possible from the uptrend and thus we ignore the initial easy targets. We go for the higher targets because we are now in the 2025 bull market.
When in doubt, you don't have to be 100% right but neither 100% wrong. If you don't know how the market will behave next, instead of thinking to sell the entire position, you can sell a small portion only, say 10%. And continue like this long-term.
There are many strategies, many ways to plan and win, but for now focus on holding patiently, patience is key. Those who can wait the longer without being tempted can produce the best results. Just let it roll... The market is set to grow. Accumulation and buying now the best choice.
Namaste.

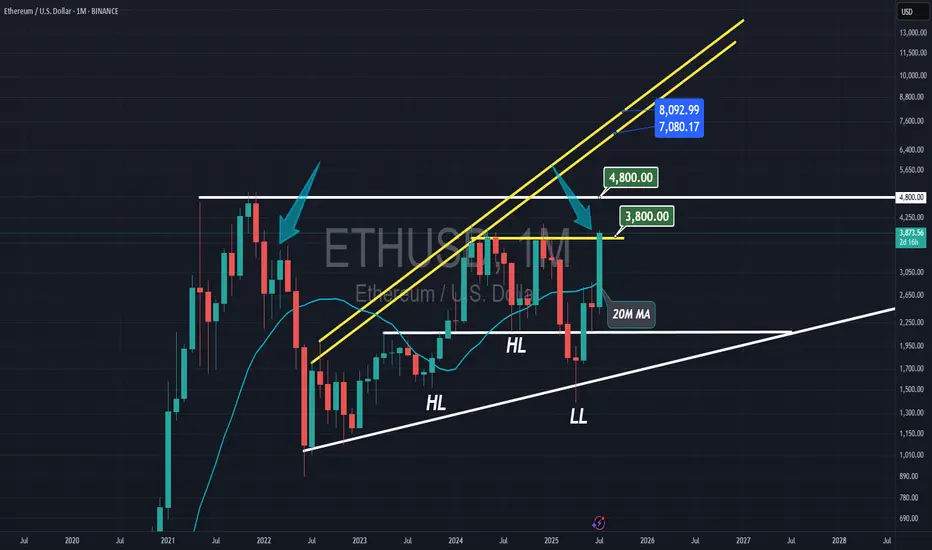
ETH/USDT (Monthly) – Symmetrical Triangle BreakoutPattern & Technical Setup
Ethereum (ETH/USDT) is showing a textbook symmetrical triangle pattern on the monthly chart. The pattern has been developing since the 2021 high, with lower highs converging with higher lows.
The current candle has broken out above the triangle’s upper trendline, suggesting a potential bullish continuation. This breakout is significant given the long consolidation period and strong volume profile near the breakout zone.
Trade Plan
• Entry: Around $4000 on confirmed monthly close above triangle.
• Stop Loss: Below $3,500 (safe side under breakout + previous support).
• Profit Targets:
$4,800 (measured move target based on triangle height)
⸻
Risk & Reward
• Risk: ~17% downside (stop at $2,950)
• Reward: ~253% upside to $4,800
• R/R Ratio: ~14:1 (favorable for swing trade)
Ethereum Weekly Recap & Gameplan | 27.07.2025📈 Market Context:
ETH followed the broader crypto market momentum led by Bitcoin, supported by institutional demand and positive macro policies in the U.S.
Last week’s plan played out cleanly — we saw strong gains from the 1H demand zone.
🧾 Weekly Recap:
• Price swept 4H swing liquidity and formed a 1H bullish BOS
• Created a solid 1H demand zone, from which price bounced strongly
• Momentum remained bullish as forecasted in last week’s post
📌 Technical Outlook:
→ Expecting a short retracement into 4H liquidity levels around 3761$ or 3702$
→ Then a continuation move towards ATH zone
🎯 Setup Trigger:
What I’m watching:
✅ Sweep of 4H liquidity
✅ Bullish BOS on 15M–30M
→ This will serve as the confirmation for long entries
📋 Trade Management:
• Stoploss: Below the confirmation swing low
• Target: 4100$
💬 If you found this helpful, don’t forget to like, comment, and follow — I share setups like this every week!

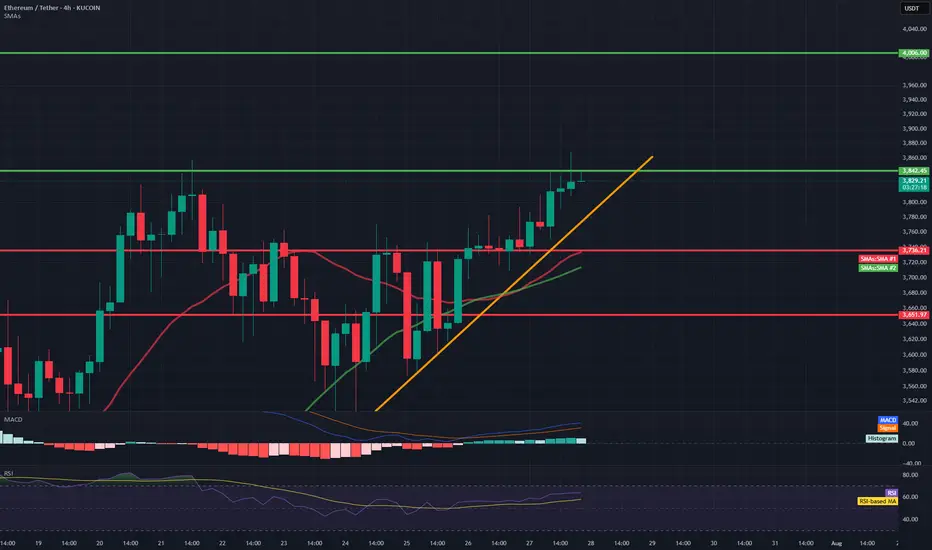
ETH/USDT 4H Chart📊 General Context
Ethereum is rising in a strong short-term uptrend, supported by a rising trendline (orange).
Current price: 3831 USDT
We are approaching a significant resistance level around 3842–3850 USDT (green line).
Technical support is located around 3760 USDT (previous consolidation level and 50/200 SMA).
🔍 Technical Levels
Resistance:
3842–3850 USDT – local high, currently being tested.
4006 USDT – key psychological level and the last local high on the chart.
Support:
3762 USDT – previous resistance, currently turned into support (may be tested in a correction).
3650 USDT – strong technical support, confirmed several times in the past.
SMA50 and SMA200 – currently just below the price, also acting as dynamic support.
📈 Technical Indicators
MACD:
The histogram is rising and positive → bullish momentum.
The MACD line crosses the signal line from below → a buy signal.
RSI (14):
Currently: around 64 → not yet overbought, but close to the overbought zone.
Slightly rising trend, but may suggest impending market overheating with further gains.
🧭 Trend
Short-term: strong uptrend (trend line, green candles, breakout from consolidation).
Medium-term: higher lows and higher highs – the uptrend is maintained.
The price is holding above the 50 and 200 SMAs – confirming bullish sentiment.
⚠️ What to watch next?
A 4-hour candle close above 3842 USDT → confirmation of a breakout, a potential attack on 4000–4010 USDT.
A break of the trend line (orange) → a possible correction to 3760 or even 3650 USDT is possible.
An RSI rise above 70 → an overbought signal, a possible pullback or consolidation.
You thinking of buying ETH ? read this first
There is a saying- "Charts NEVER lie"
And here it is
ETH USDT Weekly chart, suggesting that, right now, ETH is up against resistance that has rejected it more times than it has been support.
The RSI on this chart also suggests a pull back is coming
Again, RSI has been rejected in this range more times than it found support
Conclusion -WAIT before you buy and see if it crosses that line of resistance and tests it as support before you spend your money
Just saying
ETHUSDT Classic Cup PatternEthereum is forming a textbook Cup pattern on the 1H chart, signaling a strong bullish setup. After a rounded bottom forming the “cup,” ETH is now pushing toward the neckline resistance around $3,870. A confirmed breakout above this level could lead to a powerful upward move.
Cheers
Hexa
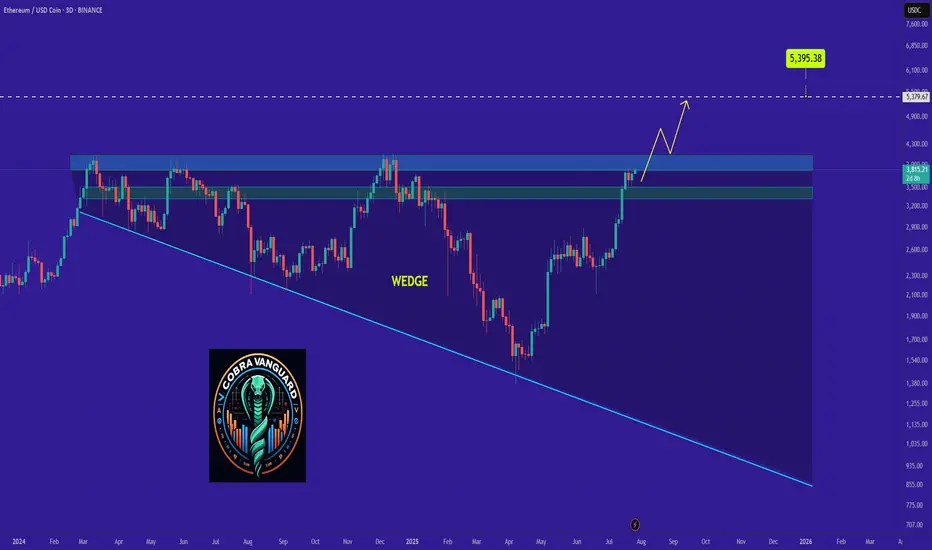
Why ETH Remains Bullish and Its Next Potential Move !The ETH will increase $200 and reach to the top of the wedge in the coming days .
We can be hopeful that after breaking out of the wedge, we will see significant price growth.
Best regards CobraVanguard.💚
Give me some energy !!
✨We spend hours finding potential opportunities and writing useful ideas, we would be happy if you support us.
Best regards CobraVanguard.💚
_ _ _ _ __ _ _ _ _ _ _ _ _ _ _ _ _ _ _ _ _ _ _ _ _ _ _ _ _ _ _ _
✅Thank you, and for more ideas, hit ❤️Like❤️ and 🌟Follow🌟!
⚠️Things can change...
The markets are always changing and even with all these signals, the market changes tend to be strong and fast!!
Ethereum - Possible Zones / How to use them ? Hello everyone, and special greetings to my dear friends who follow me, I hope you're happy that I helped you buy Ethereum at $2200.
Let's get to today's situation. There are many areas for Ethereum. The first blue box is the one I'd want to be the first buyer in.
I might want to be a buyer in the other blue boxes as well, but there will be increases even before these areas are reached.
I think the bottom blue box could be the one in the event of a Q3 correction.
What is a Q3 correction? All risk-on markets typically experience significant corrections in the third quarter of the year and struggle to recover from this correction until the end of the year.
The first blue box would be the first area I'd want to be in for any increases leading up to this correction.
HOW DO I GET INVOLVED!! THIS IS IMPORTANT BECAUSE SOME OF YOU LOSE MONEY WHEN BLUE BOXES ARE PULLED AWAY. THIS SHOULD NOT HAPPEN!!
When the price reaches the blue box, the transition is made to the 1-hour timeframe. Here, an upward breakout is sought, and during this breakout, the CDV is expected to be positive and rising. If these conditions are met, then RISK is taken. However, the entire amount of money isn't spent; it simply means that the conditions necessary to spend one bullet are met. One bullet is an amount that won't upset you too much; this varies for everyone.
I hope you use this analysis beneficially and profitably, because I want you to make a lot of money. Best wishes to you all, UmutTrades.
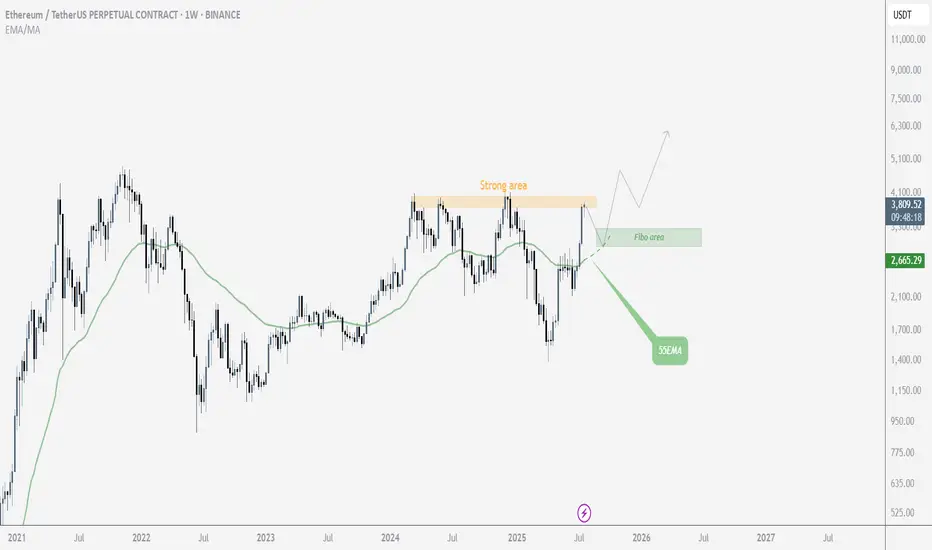
$ETH Mid-TermLooking at Ethereum from a mid-term perspective, it’s currently sitting near its price ceiling, suggesting a potential need for a correction. Of course, it’s also possible that this level could be broken, depending on overall market conditions. However, the primary scenario is that it fails to break through and pulls back, with the potential reversal zone identified based on Fibonacci levels. On the other hand, the 55 EMA is also providing solid support.
If Ethereum manages to break above this resistance, then we'll wait for either a confirmation or a pullback before entering a long position
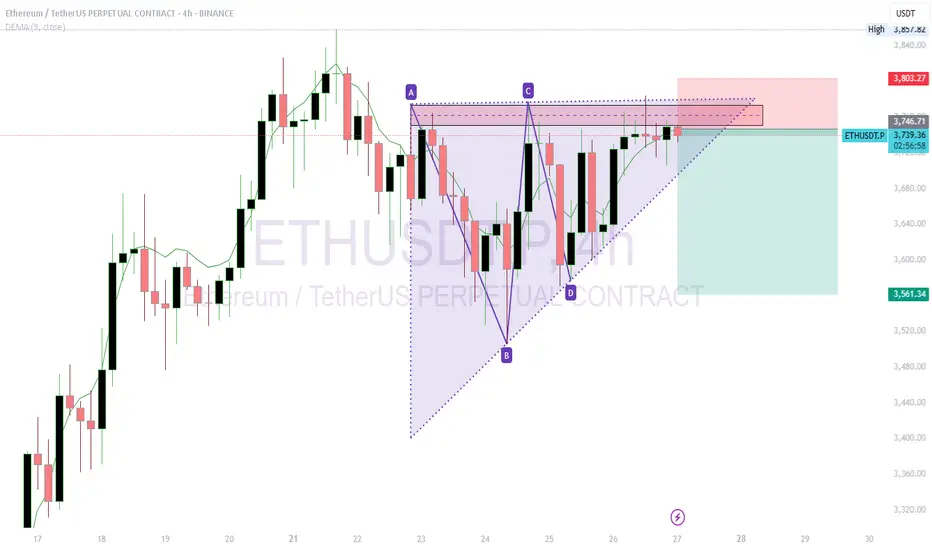
ETHUSDT Short Trade IdeaShort ETHUSDT at $3,745.22 with a target of $3,561.34.
Reason for Short: The 4-hour chart shows a symmetrical triangle pattern with resistance around $3,745-$3,800. The price is testing this upper trendline, and a recent bearish candle suggests potential rejection. The DEMA at $3,747.75 indicates overextension, supporting a pullback.
What I See: Heavy sell pressure is forming near $3,745, with the triangle nearing a breakout/breakdown point. Support lies around $3,561, aligning with prior lows.
Stop Loss: Set at $3,802, above the recent high and triangle resistance, to avoid a bullish breakout.
Trade Rationale: A breakdown from the triangle with volume confirmation could drive the price to $3,561. The tight stop above resistance minimizes risk while targeting a key support level.