You Seek Profit, they seek you !who?Every time you think the market’s about to crash, it pumps.
And when you’re sure it’s time to enter, it dumps.
Maybe it’s time to ask a serious question: Who’s really hunting whom?
Hello✌
Spend 3 minutes ⏰ reading this educational material.
🎯 Analytical Insight on Ethereum:
As noted earlier, after several days of sideways action, BINANCE:ETHUSDT has confidently broken above its parallel channel. 🚀 This breakout sets the stage for a potential gain of at least 10%, targeting around 3200. There is also a chance for a retest of the channel’s upper boundary before continuing higher. 🔄
Now, let's dive into the educational section,
🎯 The Modern Market Hunters
Markets today aren’t simple anymore. Behind every candle lies a strategy, an algorithm designed for one thing:
Profiting from your fear and greed.
In crypto, liquidations have turned from a mere term to a deadly tactic. When you enter a position, exchanges know exactly where your stops are. Often, price moves are designed to trigger liquidations of traders like you.
🛠 TradingView’s Tools to Spot the Traps
In a market where hunters are always one step ahead, TradingView’s default tools can be your secret weapon. You just need to know where and what to check:
Volume Profile (Range & Fixed): Shows where real money volume has entered, not just pretty candles.
Liquidity Zones Indicators: Pinpoints exact areas where stops cluster the prime hunting grounds.
Order Block Detection Scripts: Marks zones where whales place heavy orders, always moving against retail trader sentiment.
Set these tools on 1H to 4H timeframes and focus on overlapping areas. This way, you can spot traps before they activate, not after.
🔬 How Are Traps Actually Set?
Markets first build a nice trend, making everyone FOMO in. Then, a sudden shadowy candle crashes the party.
This is called a liquidity sweep or stop hunt.
Signs are clear:
Sudden volume spikes
Positions quickly flipping to profit or loss
Long shadows on candles signaling stop grabs
This is exactly where Open Interest and Liquidity Maps come in handy. They reveal the hunting map before your eyes.
🧠 Your Mind Is The Biggest Liquidity Map
The biggest traps are built inside traders’ minds. When the market moves against you, you panic and set stops.
But that’s exactly the lesson market makers want you to learn: don’t react emotionally.
Instead, a pro trader uses others’ behaviors as cues before market moves.
While you focus on profit, whales focus on your biggest fear: stop loss.
🔄 Your Greed Is Their Data
Every stop you set is a data point for them. You chase profit, they chase your surrender.
Lots of long volume in one zone? Price gets dragged down.
Everyone’s short? Expect a fake pump.
Volume is a footprint, and they track emotional traders like a bloodhound.
🚧 Escape The Trap, Don’t Predict The Market
Pro trader’s formula:
Don’t try to predict track.
When you realize the market isn’t moving naturally but hunting orders, your mindset shifts. You become a tracker, not a soothsayer.
📉 Every Candle Can Be A Killer If You’re Unaware
When a big opposing candle hits your position, ask:
Are we all thinking the same thing?
If yes, you’re likely the next target.
📌 Final Summary
If you only chase profit, you miss the fact the market is hunting you.
The only way out: know they play with your info, not just the charts.
Trading blindfolded is walking into the wolf’s den.
✅ What To Do Next?
Learn to analyze other traders’ moves, not just price action.
Use TradingView tools to see behind the candles.
You’re not here to be hunted you’re here to hunt. So this time, guess where everyone’s stop will be before entering!
✨ Need a little love!
We pour love into every post your support keeps us inspired! 💛 Don’t be shy, we’d love to hear from you on comments. Big thanks , Mad Whale 🐋
📜Please make sure to do your own research before investing, and review the disclaimer provided at the end of each post.
ETHUSDT

Ethereum Idea and Buying Plan⚪️ CRYPTOCAP:ETH
We mentioned earlier that our goal is 3290 - 3473 which is the gap formed in CME contracts
⭕️ Currently, for speculative thinking or looking to enter the support range after all this rise is between 2789.57 to 2685.87
🚨 The important thing is to stay above 2326 to support the continuation of the rise strongly
🔼 The key to the rise will be maintaining movement above 3000 on the 4h and 1d frames
📄 The closest targets for this model, upon meeting the conditions, are 3356 reaching the range of 3567 - 3857

ETHUSDTHere is a great move for ETH after a long time.
So I can recommend some levels to trade and bullish move has been started.
good luck
DYOR!

ETH New Analysis (12H)This analysis is an update of the analysis you see in the "Related publications" section
The previous analysis is still valid | its timeframe is higher, but in this update, we've moved to the lower timeframes.
It seems a valid bottom has been formed on Ethereum, and we may not see a lower low, provided that the price doesn't move higher first but instead drops directly into our support zone. If that happens, the price could potentially move upward from there.
Ethereum seems to be searching for a support zone to reach higher levels. The marked area could potentially launch the price upward.
In this analysis, the support zone, targets, and invalidation level have been updated.
For risk management, please don't forget stop loss and capital management
When we reach the first target, save some profit and then change the stop to entry
Comment if you have any questions
Thank You

ETH Long / Buy SetupAs of many times mentioned that, will short eth above 3k or 3k, but it still shows Bullish momentum no sign of weakness, maybe this entry triggers during weekend due too low volume, search for ifvg, if any 1D or 4hr Bullish fvg truns into bearish ifvg then will take short on ETH. For now will take long with SL and proper risk management.

$ETH: The 1-week chart is an absolute disaster!Once again, I want to make it clear: I’m naturally a bull. But I live in Thailand, far from the noise of influencers shouting "buy, buy, buy!" I’ve learned my lesson—when they scream buy, you get rekt. That’s why I rely solely on the charts.
Charts are just mathematics—they don’t lie. So here’s my honest interpretation of what I’m seeing for Ethereum:
🕐 Daily Outlook
Yes, we might see a few nice bounces in the short term. But if your plan is to hold ETH, you should be paying attention to higher timeframes, especially the weekly.
📉 Weekly Chart — It's Ugly
We’re clearly in a descending wedge, and overall, ETH is bearish. Don’t be fooled by the hype or the people trying to take your money.
- RSI is bearish, with a strong bearish divergence still unfolding.
- MACD is on the verge of a bearish crossover, and what’s worse, it’s doing that without even touching the neutral zone—a major red flag.
The last time we saw this setup? November 2021. The price crashed below $1,000.
🔍 Where’s the Support?
This cycle, the support zone looks closer to $1,500, mainly due to institutional interest and the ETF narrative. A full retracement seems unlikely, but technically speaking—it’s still a possibility.
🤔 Why Is This Happening Despite Institutional FOMO?
Here’s the key: ETH has staking, and every month, new CRYPTOCAP:ETH is minted to pay stakers. This creates constant inflation. On top of that, many stakers compound their rewards, accelerating the inflation. And guess what? These same stakers are selling as soon as ETH pumps.
So fundamentally, Ethereum is under pressure because of its own staking mechanics—a system flaw that creates long-term selling pressure.
Do your own research (DYOR). I could be wrong—but at least I’m not trying to sell you a course.

ETHUSD h4 next move downThe resistance at 1.36554 may be weak due to:
Multiple taps already
Reduced seller interest
A breakout above this zone could trigger short covering → sharp rally
✅ 2. Higher Low Structure
Recent low at 1.35475 held strong
Current consolidation appears like a bullish flag or accumulation range
Could indicate continuation, not rejection
✅ 3. Fakeout Reversal Setup
If price dips into the support at 1.35475 again, it might:
Trap breakout traders
Reverse and form a new impulse leg upward
Target = 1.3700–1.3750 zone

ETH Pullback Before Next Rally? Hello guys!
Ethereum is currently testing a strong resistance zone around the $2,678 level, which has previously acted as a key barrier. Price action has been climbing steadily within an ascending channel, indicating a clear bullish trend in play.
However, since ETH is right at the resistance, we could see a short-term correction or pullback toward the $2,560–$2,580 support range (highlighted zone), which also aligns with the midline of the channel and previous consolidation structure.
If this support holds, a healthy bounce from this area would likely push ETH toward the next bullish target around the $2,760–$2,800 zone, which sits near the upper boundary of the current channel.

$ETH clear for an impulsive move to $3600?CRYPTOCAP:ETH has slowly but surely cleared resistance, with just the swing high to tackle which will activate another trade signal in my Trade Signals Substack.
Major support High Volume Node, daily pivot and daily 200 EMA proved tough support and demand continues to come in.
ETFs had an astonishing amount of inflows yesterday at $200M+
Analysis is invalidated below $2100
Safe trading

Ethereum Analysis – Vitalik’s Gas Cap Proposal Adds PressureToday, I want to show you the possible moves for Ethereum ( BINANCE:ETHUSDT ) this week.
Please stay with me .
Let’s first take a look at the important news that has come for Ethereum in the last 24 hours :
Ethereum’s Gas Cap Proposal Sparks Concerns
Ethereum co-founder Vitalik Buterin recently proposed EIP-7983 , introducing a gas limit cap to prevent potential DoS (Denial of Service) attacks on the network.
Bearish Takeaways:
This proposal reveals a current vulnerability in Ethereum’s infrastructure. If gas limits grow unchecked, nodes may fail to sync, leading to possible network instability.
Imposing a gas cap could temporarily reduce transaction throughput, affecting DeFi protocols and NFT platforms that rely on Ethereum’s scalability.
The market tends to react cautiously to core protocol changes, and this uncertainty could trigger short-term selling pressure.
Bullish Counterpoints:
The cap aims to strengthen the network’s long-term stability against spam and DoS attacks.
It’s still in the proposal stage, with no immediate impact on users or network performance.
Conclusion:
While the long-term impact may be positive, the short-term uncertainty and exposed risks provide a bearish narrative for Ethereum, especially amid growing competition from alternative chains.
--------------------------------------
Now let's take a look at the Ethereum chart on the 4-hour time frame .
Ethereum is currently trading near the Heavy Resistance zone($2,929-$2,652) and Resistance lines , and is also trying to break the Support line .
In terms of the Elliott Wave theory , it seems that Ethereum has completed the Zigzag Correction(ABC/5-3-5) , so we can expect the next bearish wave .
I expect Ethereum to fall to at least $2,433 AFTER breaking the Support line, and if the Support zone($2,491-$2,323) is broken, we should expect further declines.
Second Target: $2,374
Note: Stop Loss (SL) = $2,689= Worst Stop Loss(SL)
Please respect each other's ideas and express them politely if you agree or disagree.
Ethereum Analyze (ETHUSDT), 4-hour time frame.
Be sure to follow the updated ideas.
Do not forget to put a Stop loss for your positions (For every position you want to open).
Please follow your strategy and updates; this is just my Idea, and I will gladly see your ideas in this post.
Please do not forget the ✅' like '✅ button 🙏😊 & Share it with your friends; thanks, and Trade safe.

#ETH Update #2 – July 10, 2025🟢 #ETH Update #2 – July 10, 2025
Ethereum has formed a new high above its previous impulsive leg. Although this peak is lower than the one a month ago, the current structure looks healthy. During this move, ETH left an imbalance around the 2373 level, which aligns closely with a potential retracement zone. Volume appears to be decreasing or reaching exhaustion, suggesting the rally may be losing strength. A correction towards 2685 could be on the table. For now, the setup does not favor either a long or short position.

ETH | Bullish Pattern - Cup and Handle +15%A Bullish pattern is appearing on the Ethereum chart.
From a Cup and Handle pattern, we can easily expect atleast a 15% increase. This is true for the near term. A +15% would put us here:
Just under $3K we may see heavy resistance. This is also the neckline resistance, as it was the previous support for the breakout that ultimately led to a new ETH ATH.
_______________________________
BYBIT:ETHUSDT

ETH Gearing Up for Lift-Off — Eyes on $4,000+ETH Weekly Outlook
ETH is currently trading around $2,660 on the weekly timeframe and holding up well at these levels.
If the momentum continues, the upper resistance zone near $3,550 could act like a magnet — pulling price higher. A breakout above this zone may trigger a strong rally toward $4,000+.
And when ETH starts to move big… altcoins usually follow.
Keep an eye on it. The next few weeks could get interesting.
DYOR, NFA

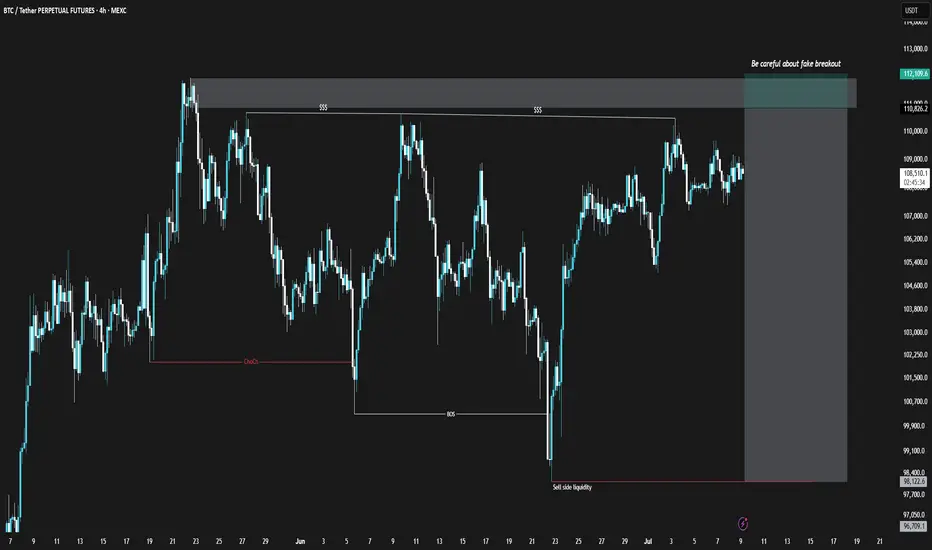
BTCUSDT Short Position (25/Jul/9)Bitcoin, similar to the TOTAL chart, is showing weakness in its bullish momentum. However, unlike TOTAL, the divergence in Bitcoin is clearly noticeable. Additionally, within the marked zone on the Bitcoin chart, there is a possibility of a fake breakout and liquidity grab. I suggest entering only with proper confirmation.
⚠️ This Analysis will be updated ...
👤 Sadegh Ahmadi: GPTradersHub
📅 2025.Jul.9
⚠️(DYOR)
❤️ If you apperciate my work , Please like and comment , It Keeps me motivated to do better
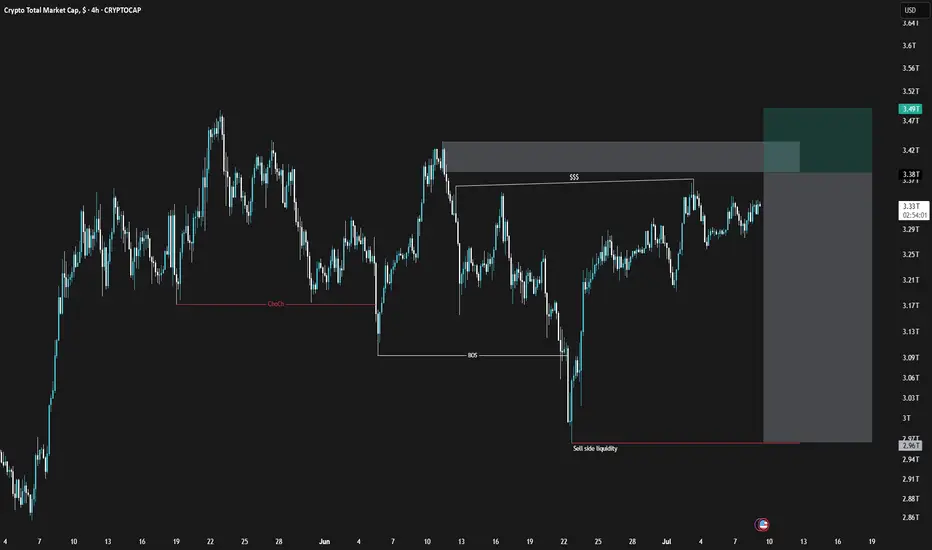
TOTAL SELL SIGNAL 25/Jul/9The TOTAL chart has shown a structural change in the 4-hour timeframe, indicating weakness in the bullish trend. Don't rush into buying and avoid falling into FOMO.
⚠️ This Analysis will be updated ...
👤 Sadegh Ahmadi: GPTradersHub
📅 2025.Jul.9
⚠️(DYOR)
❤️ If you apperciate my work , Please like and comment , It Keeps me motivated to do better
ETHEREUM ROADMAPI tried to predict based on previous time periods and elliot waves.
Please note that my analysis is not short-term. Of course, there may be short-term correction waves in Ethereum.
* The purpose of my graphic drawings is purely educational.
* What i write here is not an investment advice. Please do your own research before investing in any asset.
* Never take my personal opinions as investment advice, you may lose your money.

ETH/USDT 1W Chart📊 Trend structure (Price Action)
Downtrend (historical):
A series of Lower Highs (LH) and Lower Lows (LL) — a classic downtrend.
Confirmed by the orange downtrend line.
A change in structure — a possible beginning of an uptrend:
A Higher Low (HL) has recently been formed after a Lower Low (LL).
Suggests a possible end to the downtrend and an attempt to break out upwards.
Currently:
The price is testing the upper downtrend line.
A breakout above the orange line may confirm a trend change.
🟢 Key Resistance Levels (Green Lines):
Level Meaning
3.058 USDT Potential target after a breakout from consolidation
2.767 USDT Nearest strong resistance - currently being tested
3.427 USDT Deep resistance level from the previous high (HH)
🔴 Key Support Levels (Red Lines):
Level Meaning
2.234 USDT Nearest support - previous breakout
1.883 USDT Early 2023 support
1.507 USDT Local bottom
1.204 USDT Historical support - LL extreme
📉 Stochastic RSI (Momentum Indicator):
Currently in the overbought zone.
This may suggest a short-term correction before an actual breakout.
However, in a strong uptrend, the indicator may "hang out" in the overbought zone for a long time.
📈 Potential scenario:
If the breakout above 2.767 and the orange trendline holds:
A possible move to 3.058 USDT as the first target.
Extended target: 3.427 USDT (HH).
If the breakout fails:
Correction to 2.234 USDT or lower.
There is a risk of returning to a downtrend.
✅ Bullish signals:
Higher Low (HL) formation after Lower Low (LL).
Testing the upper downtrend line with an attempt to breakout.
Volume is increasing (based on candles).
⚠️ Bearish threats:
Stochastic RSI in the overbought zone.
Breakout not confirmed by 100% (needs a weekly closing candle above 2.767).
Resistance at 3,058 could halt the move.
📌 Conclusion:
Ethereum (ETH) could be on the cusp of a new uptrend, but a breakout above 2,767 USDT is needed for confirmation. If it does, a move to 3,058 and then 3,427 is possible. However, the current overbought level on the Stochastic RSI could signal a short-term correction before the trend gains strength.

ETH | Price PredictionI believe that COINBASE:ETHUSD is the most important ecosystem for crypto and am bullish on it. The price of many great assets is absolutely dependent on ETH, because those assets have ETH as the key liquidity. I love assets from the ecosystem: OKX:MORPHOUSDT , BINANCE:WLDUSDT , BINANCE:OPUSDT , BINANCE:ARBUSDT , BINANCE:LDOUSDT , $BINANCE:STRKUSDT.
Those levels are from my platform. I believe that up to "Bullish" is really easy to hit this "cycle".

ETH Long Swing Setup – Sideways Hold with Dip-Buy OpportunityETH continues to hold above the key $2,300 support, showing resilience and consolidating within range. We’re watching for one more dip into the $2,300–$2,375 zone to trigger a long entry, with momentum building for a potential breakout.
📌 Trade Setup:
• Entry Zone: $2,300 – $2,375
• Take Profit Targets:
o 🥇 $2,900 – $3,000
o 🥈 $3,300 – $3,400
o 🥉 $4,000 – $4,200
• Stop Loss: Daily close below $2,000

ETH to 3KETH is looking set to challenge the 3k level.
You can see by the small breakout and old resistance acting as new support levels at fig 1 that ETH is building towards a leg up.
Look for ETH to move higher with a small breakout (fig 2), retest (fig 3) before moving higher towards the 3K range.

ETHUSDT Long / Buy SetupMust take from the entry and USE tight SL. Can be a fakeout, if real breakout then tps are mentioned. In case sl hit, use the previous setup, it's still valid. While for short I'm still waiting for 3k or above.

Time to go long!!
1) A candle broke out and closed above the descending parallel channel.
2) The price has been consolidating above Fib0.0382 level for weeks.
3) The recent candles are sitting above EMA21.
4) EMA 21 is above EMA55.
5) EMA200 is running horizontally still but it is getting close to cross EMA55.
6) All momentum indicators are in the bull zone and still plenty to go before it hits overbought territory.
There might be a strong breakout to the upside.
It is time to go long.
Ethereum Faces Key Resistance: Potential Pullback AheadHello Guys!
What I see:
Head and Shoulders Pattern:
Left Shoulder: Formed
Head: Peak, followed by a drop.
Right Shoulder: Formed.
The neckline break around $2,450 initiated a downside move, confirming the bearish setup.
Current Price Action:
ETH is currently trading near $2,519, attempting to reclaim the broken neckline zone, which now acts as resistance.
The price action is showing lower highs, hinting at weakening bullish momentum.
Bearish Retest in Progress:
The chart shows an anticipated bearish retest of the support-resistance flip zone ($2,530–$2,550), with a probable rejection leading ETH back down toward the $2,440–$2,450 support zone.
Demand Zone:
A strong demand area is visible between $2,420–$2,450. Price may revisit this zone before making the next major move.
Trend Channel:
ETH is moving within an ascending channel, and the lower bound coincides with the highlighted demand zone.
________________________
Let's check this deja vu:
You can see that previously the price formed an H&S and after that did a hunting of the head! And after that price experienced a drop there! Same scenario here!
