ETHUSDT on daily+weekly support zone, could be a good buy zoneThe same story on ETHUSDT. The price is at daily+weekly support zone. It has dipped only a bit in this zone but might go deeper. Anyways, this again is a good buy opportunity. However, the demand is not that strong as visible from the strength of bounce. It is possible that it dip further more in this support zone before having a proper bounce. The bounce shall be targeted to the daily resistance around 1936.
Ethusdtlong

ETH Bullish Adam & EveKUCOIN:ETHUSDT
ETH sitting in a huge Adam & Eve on the D timeframe with small buildup after breakout.
Possible measured move of 50% to 3K level - will take time to develop.
Enter on Break and Retest of Breakout.
Lower timeframe move already in +15%.
All depends on the puppet master - Bitcoin!
Always having Plan A and Plan B scenarios so we can react once the markets provide an opportunity to execute our edge.
If you liked this idea or if you have your own opinion about it, write in the comments.
The information and publications are not meant to be, and do not constitute, financial, investment, trading, or other types of advice or recommendations.


📈ETH analysis above 1900 level📉BINANCE:ETHUSDT
COINBASE:ETHUSD
Hey everyone, first take a look at my previous analysis and positions.
As previously analyzed, Ethereum continued its upward trend and reached above the HKEX:1903 level.
In order to continue the upward trend, Ethereum needs to stay above 1850.
Don't forget to risk-free your position.
Consider the impact of the Shanghai update.
Please share ideas and leave a comment,
let me know what's your idea.
CrazyS✌

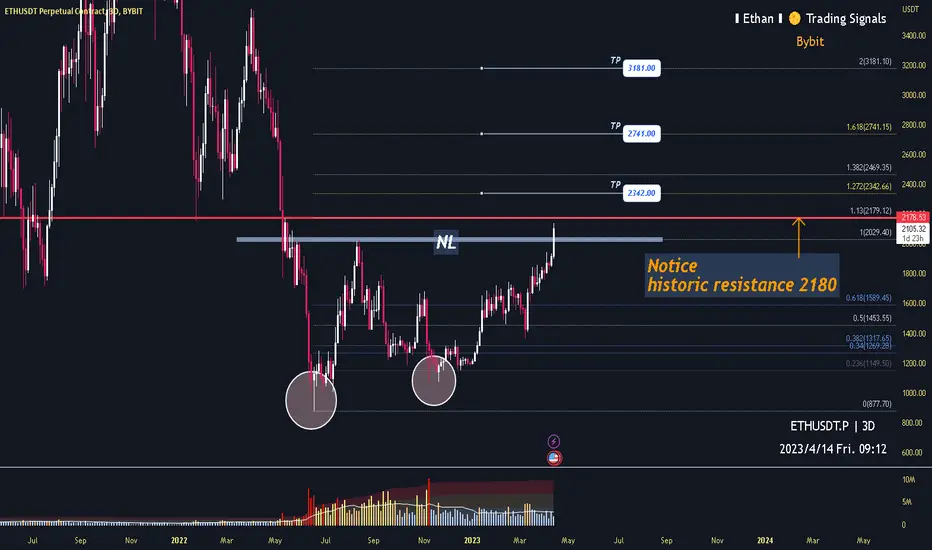
Ethereum creating a huge double bottom!BYBIT:ETHUSDT.P
3 day time frame
-
Ethereum creates this big potential double bottom after breaking above 2030
We can plan a long trading and targets as marked.
***Notice also approaching to historic resistance 2180.
Ethereum - Altseason 🚀 First Stop $2000Hi Traders, Investors and Speculators of the Charts 📈📉
Ev here. Been trading crypto since 2017 and later got into stocks. I have 3 board exams on financial markets and studied economics from a top tier university for a year.
Over the past few weeks, I've noticed that fractals from early bull markets during 2018 and 2021 are repeating across the charts. I've made a few updates on charts that have been following similar charts patterns. On Ethereum , I have observe similar price behavior around the current resistance zone a few weeks ago and so far, this fractal is playing out perfectly. If we consider a chart fractal from February 2021, we can expect ETHUSDT to head towards $2000 as soon as BTC takes a breather.
Fractals can be very useful to determine how the price might react on certain price levels judging by historic events. The current immediate resistance zone will be defended by the bears / sellers / suppliers, but if we can see a weekly candle close ABOVE this supply zone , the next logical stop is $2000 and beyond.
Make sure you have a solid trading plan in place to buy the support zone and sell on the resistance zone . And remember... Don't be a Bob-Trader:
The continues market cycle between Bitcoin and altcoins can clearly be seen at the moment. It goes something like this:
🤩 Bitcoin goes UP ... Bob Fomo buys the rally
🤔 Bitcoin corrects ... Bob panics and sells
🤑 Altcoin rallies ... Bob thinks, screw BTC , I'm going all in on this altcoin
😨 Altcoins correct ... Bob panics. Altcoins are scams! Sells everything
🤩 Bitcoin goes up .... Bob Fomo buys the rally
Moral of the story...Don't be like Bob. Don't try to FOMO in whilst the price is going up. Plan your trade, preset your TP and SL and keep in mind that there is a constant rotation between BTC and altcoins.
While you're here 👀 Have you heard about the SVB saga? More info here:
_______________________
📢Follow us here on TradingView for daily updates and trade ideas on crypto , stocks and commodities 💎Hit like & Follow 👍
We thank you for your support !
CryptoCheck

ETHUSDT - Broadening Wedge PatternETHUSDT (1D Chart) Technical analysis
ETHUSDT (1D Chart) Currently trading at $1785
Buy level: Above $1800
Stop loss: Below $1550
TP1: $2000
TP2: $2175
TP3: $2450
TP4: $2600
Max Leverage 2x
Always keep Stop loss
Follow Our Tradingview Account for More Technical Analysis Updates, | Like, Share and Comment Your thoughts

Ethereum & Continue the upward trendEthereum vs Dollar ETHUSD and ETHUSDT
BINANCE:ETHUSDT
⚠️🚨 Risk warning, disclaimer: the above is a personal market judgment and analysis based on published information and historical chart data on The trading view,
And only some of these analyzes are my actual real trades.
I hope Traders consider I am Not responsible for your trades and investment decision.
✅ Please write any advice or suggestions.

ETHUSDT LONGHello my friends , how are you ? today I came up with a buying idea on ETHUSDT that is also a high probability zone . see everything in the chart and I think it is going to be clear but I want you to understand this is how I see the market and I have my own edge over the market. you need to do your own research before taking any trade. trading is a probability game , understanding this will change the way you trade and you will become profitable when you understand this. happy trading

ETH/USD 1DAY UPDATE BY CRYPTO SANDERSHello, welcome to this ETHEREUM /USD update by CRYPTO SANDERS.
CHART ANALYSIS:-Ethereum The price started today's session in the green as it attempted to move back toward the 1900 level.
After a low of 1845.99 on Friday, ETH climbed to a peak of 1879.11 to start the weekend.
The world's second-largest cryptocurrency broke a two-day losing streak after holding above a floor at 1830.
Ethereum price strength remains below support at 61.00.
The 14-day RSI is tracking at 60.42, and should there be a breakout, the price would be more likely to move above 1900.
I have tried to bring the best possible outcome to this chart.
Hit the like button if you like it and share your charts in the comments section.
Thank you

ETHUSDT Bullish Harmonic Pattern AB=CD 1H TFETHUSDT instrument shows bullish harmonic pattern AB=CD at 1h TF

#ETHUSD- $2000 NEXT!! Hey Everyone, ETHUSD have been bullish and it will continue doing it so, crypto outlook remain stable throughout this year began, expecting price to fall first once it comes to our' equal lows' area we expect price to bounce from there and create another bullish impulse.

ETHUSDTDaily Trend is Bearish ...
1. Price will go up till the Supply zone followed by Imbalance and unmitigated order flow.
2. Target is the demand zone followed by imbalance.
Can be Long in the current scenario but can be short for the longer term till the price hits the supply zone.

ETHUSDT Potential Long setup-Ethereum making Uptrend structure on Weekly/Daily/4H Timeframe
- Wait for the price to retest around the support + Fibonacci 61.8% + 50EMA+ Trendline before considering a continuation trade
Take profit 1 - 1915
Take profit 2 - 2000

Current Move For ETH / updateHello traders, I am expecting a dump from ETH by staying below the red box... and you can enter at current price of 1910-1920, with stop loss: 1925-1930
last target: 1780
by staying in the red box it can hit 2020$ and then it will dump to 1450-1500
put stop loss to entry price when it drops to 1870-1880
enjoy trading <3

📈ETH analysis above 1801 level📉BINANCE:ETHUSDT
COINBASE:ETHUSD
Hey everyone, first take a look at my previous analysis and positions.
For a long position, Ethereum needs to stay above 1800-01usdt.
Don't forget to risk-free your position.
Please share ideas and leave a comment,
let me know what's your idea.
CrazyS✌

Ethereum could rise above 2kIn my previous analysis, I said that Eth is trading in a range, and for clarification, we need a break of support or resistance.
Initially, EthUsd had an attempt to break under support, but bulls quickly took control around 1700 support.
At the time of writing Ethereum is trading above 1800 and it seems like the break will be to the upside.
At this moment I'm bullish and looking to buy dips under 1800.
A break above 1850 should lead to acceleration and 2k could be the first target, but, considering the chart structure since the beginning of the year, 2300 is very probable in the medium term.
Only a daily close under 1700 would negate this scenario

ethusdt BINANCE:ETHUSDT
At the moment, Ethereum is on its own roof, and the possibility of breaking the roof is very high
Therefore, we must be very careful to enter a long position if the roof of the channel breaks

ETH/USD CME Chart Update.Check It Before Trade On ETHETH We Have Two CME Gap Left At 2500$ level & Another One At 1430$ Level. I Expect A Pump Till 2k$ psychological Level Then A Dump Till 1.4$ And Then A Monster Pump Till 2.5K$

Bullish Continuity ETHUSD The market has taken a pause and is ready for the bullish continuation. Bullish rectangle is formed with no divergence confirming the uptrend.

ETHUSDT breaking up from daily resistance, likely to move upETHUSDT is breaking out from the daily resistance. Currently it is trading above the resistance. This is a good sign. It seems likely that the daily candle close will be above this resistance. However, let us monitor that. The next target for the bullish move would be 1950 area.

read captionThe analyzes may be slightly changed because I may not have the correct data and the target chart is another chart. Also, according to the exact place where the corrections end, the details may change a little. The previous analysis must be read. Also, if the high time analysis ends or something like that, be sure to comment and I will change my analysis form in the high times.

ETH will probably stay in a Horizontal channel Hello friends, we're almost near to monthly candle closing, and I think there's a probability which ETH and BTC dump will be delayed to monthly candle close (01/apr/2023)......
and they may stay in a horizontal channel as you can see on the chart...
happy trading <3
