Ethereum Weekly Chart Shows Strength Above Key SupportEthereum is showing strong structure on the higher time frame. After rejecting lower levels, price has reclaimed the mid support/resistance zone, and is now consolidating just above it.
What’s key here is the long-term rising trendline, which has held beautifully since 2020 and once again acted as a springboard for the recent bounce. This kind of confluence — trendline + zone flip — adds weight to the current price structure.
If ETH maintains this zone, we could see accumulation continue, followed by a breakout toward the upper resistance line. For now, the chart leans bullish, but patience is key as consolidation plays out.
DYOR, NFA
Ethusdtlong

ETH/USDT – Bearish Reversal from Resistance Zone ETH/USDT – Bearish Reversal from Resistance Zone 📉
The chart above clearly illustrates a strong bearish setup on the ETH/USDT pair. Here's a professional breakdown:
📊 Technical Overview:
Resistance Zone (~2750–2850 USDT):
Marked by three distinct rejections (highlighted by red arrows).
Every attempt to break above this zone has resulted in a sharp price rejection, indicating strong selling pressure.
Current Price: 2529.69 USDT
Price has already broken below the immediate support formed after the last rejection.
The pair is now trending lower with bearish momentum.
Support Zone (~2250–2350 USDT):
This is the next major demand zone where previous accumulation took place.
The projection arrow indicates the likely path toward this area.
🔍 Price Action Insights:
Repeated failure to break resistance confirms a triple top pattern, a classic bearish reversal signal.
The recent sharp drop from the top is accompanied by strong bearish candles, showing momentum.
Minor consolidation might occur before continuation downward, as suggested by the zigzag arrow.
📉 Conclusion:
If bearish momentum sustains, ETH/USDT is likely to drop toward the 2,300 USDT support zone. A break below could open the door for even lower levels, while any bounce would need to reclaim the 2,700 USDT level to shift sentiment.
📌 Traders should watch for lower highs and bearish confirmations before entering short positions.

Let the Market Teach You PatienceEvery red candle has a reason. Every drawdown has a lesson.
In this journey, it's not just about profits, it's about who you become.
As traders, we don’t just manage risk, we grow through it. Let patience, discipline, and humility shape you in silence, just like the markets do.
This is the mindset behind the candles.
#PEACE

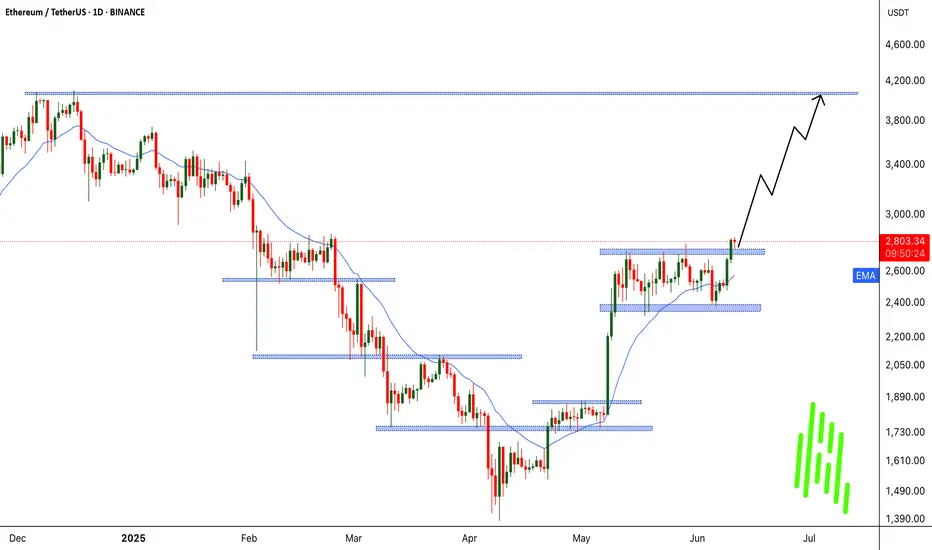
Bad Time Over for ETH? Second Wave Toward $4,000 Incoming!!🟢 Bad Time Over for ETH? Second Wave Toward $4,000 Incoming
MARKETSCOM:ETHEREUM ( CRYPTOCAP:ETH ) appears to be leaving its consolidation phase behind, and all signs point to a fresh bullish wave. After outperforming Bitcoin in recent days, CRYPTOCAP:ETH has now broken out of a key structure — signaling the potential start of a major uptrend.
We’re also witnessing rising CRYPTOCAP:ETH inflows, suggesting growing investor confidence. This kind of accumulation behavior has historically led to significant rallies. Previously, ETH consolidated between $1700–$1800 before a strong move up. More recently, it ranged between $2400–$2700, and now that it’s broken out, we’re anticipating another powerful leg — possibly the second wave of this trend.
If the current momentum continues, a move toward $4000 looks likely, and with enough strength, even a new all-time high isn’t off the table.
BINANCE:ETHUSDT Currently trading at $2795
Buy level : Above $2750
Stop loss : Below $2305
Target : $4000
Max leverage 3x
Always keep stop loss
Follow Our Tradingview Account for More Technical Analysis Updates, | Like, Share and Comment Your thoughts
Ethereum Set for a Massive Pump!ETHUSDT Technical analysis update
ETH price has been trading within a channel pattern for the past 30 days, with the 100 and 200 EMA acting as strong support on the 4H chart. Therefore, the likelihood of the price dropping below the 100 and 200 EMA on the 4H chart is very low. Once the price breaks above the channel resistance, we can expect a strong bullish move in CRYPTOCAP:ETH
BITSTAMP:ETHUSD

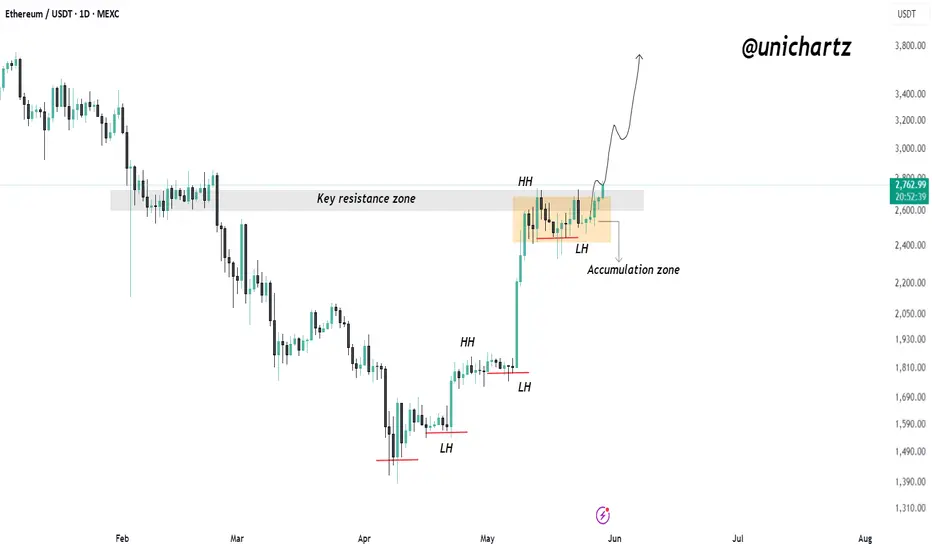
ETH Technical Structure: Bullish Bias Unless This Level BreaksEthereum is at an interesting spot.
After forming a clear bullish structure with Higher Highs (HH) and Higher Lows (HL), ETH entered an accumulation zone right below the key resistance zone.
Currently, price is retesting the 50 EMA + 100 EMA confluence zone — a critical area of demand. This level has previously acted as a strong support, and the Stoch RSI is bouncing from oversold territory, signalling possible bullish momentum ahead.
If ETH holds this accumulation zone and the EMA support, we could see another push toward the key resistance zone or even a breakout. However, if this zone fails, a deeper pullback toward lower support levels is likely.
For now, watch how price reacts here — this is a decision point.
If you liked it, do comment and follow us for regular market updates.
THANK YOU

ETH/USDTStrong Accumulation can be seen on #ETH, BlackRock buying more than usual, as well as bigger wallets and whales are accumulating heavily in the last two weeks. Something is loading for ETH and I think our decision to swap all of our XRP into ETH will play out big. In the meantime. Since taking full profit on XRP, its down 7% since then, meanwhile our ETH position is at 6% in profit. This is the beginning

ETHUSD: Buying opportunityWarning, this is highly speculative!
Ethereum faced a gruesome decline since the peak of around 4000 back in december, reaching a bottom of ~$1400
Then, in may, we had a huge rally, boasting a nearly 100% bounce from bottom to top.
Now, this fact alone has many people holding off on buying short term, as they feel a drop could be just around the corner, however, i think for this exact reason, aswell as an inbound risk-on environment, it will continue the rally, and much faster and for much longer than anticipated, creating that FOMO wave people seem so desperate to try and catch.
The whole reason you end up with the feeling of FOMO, is because your past decisions seem stupid in hindsight, and recent price action makes it seem obvious.
Well let me tell you, its NOT obvious, and that is precisely why it runs and creates that FOMO wave.
Price targets are irrelevant, focus on recognizing when greed runs amok, and take profits accordingly.
EOY Would be an obvious point at which selling heavy might be smart, but then again, its never obvious... Goodluck!

ETH/USDT – Breakout Brewing?Ethereum is currently consolidating within a bullish ascending triangle on the 4H chart. The price is coiling just below the key resistance, so a breakout could ignite the next leg up.
RSI hovering near 50 shows room for momentum buildup.
Setup Analysis:
Structure: Bullish ascending triangle
Momentum: Healthy consolidation after strong rally
RSI: Mid-range, potential to climb
Key Levels:
Resistance: $2,849
Support: $2,430 | $2,243
Breakout Target: ~$3,200 and possibly $3,420 if momentum sustains
Entry (Breakout Play):
Above $2,850 on strong volume
Target Zones:
$3,200, $3,420
Longer-term: $4,050
Stop-loss:
Below $2,430 (pattern invalidated)
Watch closely — breakout confirmation could present a solid bullish opportunity.
This is not financial advice, please do your research before investing, as we are not responsible for any of your losses or profits.
Please like, share, and comment on this idea if you liked it.
#Ethereum #ETH #CryptoTrading #TechnicalAnalysis #Altcoins #Breakout #ETHUSDT #BullishSetup

ETH looks good and bullish dont , its just ranging if Eth break level above (2800) its next target its 3300-3400 usd,

#ETH/USDT#ETH
The price is moving within a descending channel on the 1-hour frame, adhering well to it, and is heading for a strong breakout and retest.
We are seeing a bounce from the lower boundary of the descending channel, which is support at 2465.
We have a downtrend on the RSI indicator that is about to break and retest, supporting the upward trend.
We are looking for stability above the 100 moving average.
Entry price: 2558
First target: 2640
Second target: 2702
Third target: 2768

ETHUSDT Bullish Structure Intact: Higher Highs Continue#ETHUSDT – 1D Chart
Ethereum is in a strong uptrend, consistently forming higher highs (HH) and higher lows (LH).
Price recently broke above a key resistance zone after consolidating in an accumulation range. This breakout confirms bullish strength.
If ETH holds above this zone, we could see a continuation move to the upside in the coming days.
Structure remains bullish — trend is intact.
$ETH Pressing Resistance – A Break Above Could Fly!CRYPTOCAP:ETH Update
Ethereum is looking strong right now.
The price is pushing against a key resistance zone near $2,725 and forming higher lows showing pressure is building for a breakout.
If it breaks above this zone clearly, ETH could rally toward $4,000 (that’s a 55% upside).
Support to watch on the downside is around $2,465 if price pulls back.
Keep an eye on ETH, this breakout could be big.
DYOR, NFA
#ETH #Ethereum

#ETH/USDT#ETH
The price is moving within a descending channel on the 1-hour frame, adhering well to it, and is on its way to breaking it strongly upwards and retesting it.
We are seeing a rebound from the lower boundary of the descending channel, which is support at 2313.
We have a downtrend on the RSI indicator that is about to break and retest, supporting the upward trend.
We are looking for stability above the 100 moving average.
Entry price: 2400
First target: 2466
Second target: 2512
Third target: 2602

ETH Staying Bullish – Break Above Could Target $3K+$ETH/USDT Update
ETH is moving strong, forming clear higher highs and higher lows. Right now, it’s ranging in an accumulation zone just below key resistance.
As long as it holds above the 50 EMA and recent low, the trend looks bullish. A breakout here could send it flying toward $3,000+.
Still healthy, still in play.
DYOR, NFA

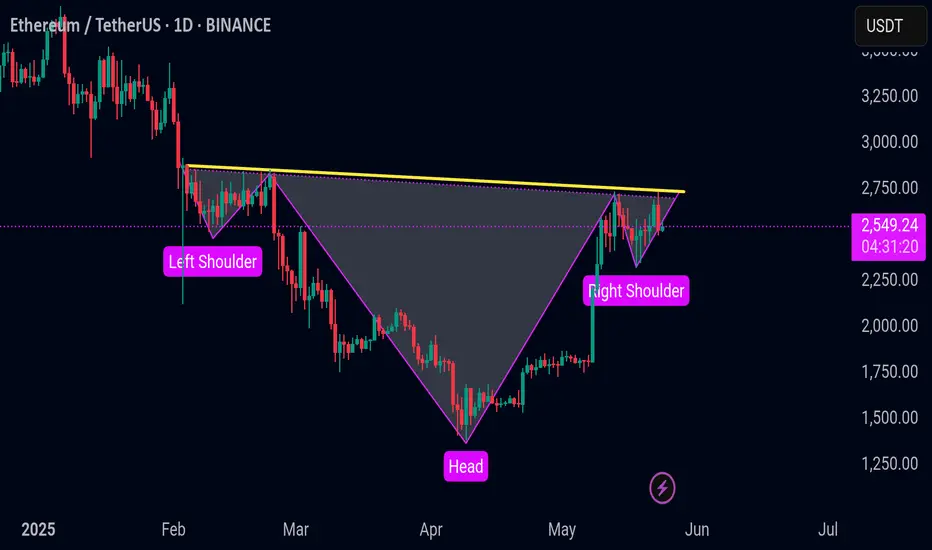
ETHUSDT UPDATE ETHUSDT
Ethereum is currently trading around the \$2550 level and is forming an inverse head and shoulders pattern on the daily timeframe. This is typically seen as a bullish reversal pattern, especially after a sustained downtrend.
If the price breaks above the neckline and closes with strong volume, it could confirm the pattern and signal a potential move to the upside. This breakout would likely invite bullish momentum and lead to higher price targets in the short to mid term. On the other hand, if Ethereum fails to break the neckline and gets rejected, it may continue to consolidate or revisit lower support areas.
Keep a close watch on the neckline level, price action, and volume — these will be key in validating the potential breakout.
My first recording for ETHUSD - FxDollars - {25/05/2025}Educational Analysis says that ETHUSD may give countertrend opportunities from this range, according to my technical analysis.
Broker - bitstamp
So, my analysis is based on a top-down approach from weekly to trend range to internal trend range.
So my analysis comprises of two structures: 1) Break of structure on weekly range and 2) Trading Range to fill the remaining fair value gap
Let's see what this pair brings to the table for us in the future.
Please check the comment section to see how this turned out.
DISCLAIMER:-
This is not an entry signal. THIS IS FOR EDUCATIONAL PURPOSES ONLY.
I HAVE NO CONCERNS WITH YOUR PROFIT OR LOSS,
Happy Trading, Fx Dollars.

ETHUSDT: Possible Minor to Major Corrections May HappenETHUSDT has a higher chance of experiencing a minor or major correction in the coming days, although we haven’t confirmed this yet. We need more confirmation before we can be certain about the future of ETH. However, if the price decides to undergo a major correction, it’s likely to drop to our second area, where it’s expected to fill the liquidity gap and then reverse, continuing towards our three targets.
Please use this analysis as secondary bias only or even only for educational purposes. Always conduct your own analysis and risk management before trading or investing in cryptocurrencies, as they carry significant financial risk. Good luck and trade safely.
If you want to support us, you can do so by liking the idea, commenting with your views, or sharing it.
Much love ❤️
Have a great weekend
Team Setupsfx_

ETH/USD "Ethereum vs U.S Dollar" Crypto Heist Plan (Day/Swing)🌟Hi! Hola! Ola! Bonjour! Hallo! Marhaba!🌟
Dear Money Makers & Robbers, 🤑 💰💸✈️
Based on 🔥Thief Trading style technical and fundamental analysis🔥, here is our master plan to heist the ETH/USD "Ethereum vs U.S Dollar" Crypto Market. Please adhere to the strategy I've outlined in the chart, which emphasizes long entry. Our aim is to escape near the high-risk YELLOW ATR Zone. Risky level, overbought market, consolidation, trend reversal, trap at the level where traders and bearish robbers are stronger. 🏆💸"Take profit and treat yourself, traders. You deserve it!💪🏆🎉
Entry 📈 : "The heist is on! Wait for the MA breakout (1840) then make your move - Bullish profits await!"
however I advise to Place Buy stop orders above the Moving average (or) Place buy limit orders within a 15 or 30 minute timeframe most recent or swing, low or high level for Pullback entries.
📌I strongly advise you to set an "alert (Alarm)" on your chart so you can see when the breakout entry occurs.
Stop Loss 🛑: "🔊 Yo, listen up! 🗣️ If you're lookin' to get in on a buy stop order, don't even think about settin' that stop loss till after the breakout 🚀. You feel me? Now, if you're smart, you'll place that stop loss where I told you to 📍, but if you're a rebel, you can put it wherever you like 🤪 - just don't say I didn't warn you ⚠️. You're playin' with fire 🔥, and it's your risk, not mine 👊."
📍 Thief SL placed at the nearest/swing low level Using the 3H timeframe (1650) Day / Swing trade basis.
📍 SL is based on your risk of the trade, lot size and how many multiple orders you have to take.
🏴☠️Target 🎯: 2100 (or) Escape Before the Target
🧲Scalpers, take note 👀 : only scalp on the Long side. If you have a lot of money, you can go straight away; if not, you can join swing traders and carry out the robbery plan. Use trailing SL to safeguard your money 💰.
💰💵💴💸ETH/USD "Ethereum vs U.S Dollar" Crypto Market Heist Plan (Day / Swing Trade) is currently experiencing a bullishness🐂.., driven by several key factors.☝☝☝
📰🗞️Get & Read the Fundamental, Macro Economics, COT Report, Quantitative Analysis, Sentimental Outlook, Intermarket Analysis, Future trend targets... go ahead to check 👉👉👉🔗🔗
⚠️Trading Alert : News Releases and Position Management 📰🗞️🚫🚏
As a reminder, news releases can have a significant impact on market prices and volatility. To minimize potential losses and protect your running positions,
we recommend the following:
Avoid taking new trades during news releases
Use trailing stop-loss orders to protect your running positions and lock in profits
💖Supporting our robbery plan 💥Hit the Boost Button💥 will enable us to effortlessly make and steal money 💰💵. Boost the strength of our robbery team. Every day in this market make money with ease by using the Thief Trading Style.🏆💪🤝❤️🎉🚀
I'll see you soon with another heist plan, so stay tuned 🤑🐱👤🤗🤩

ETHUSDT - UniverseMetta - Signal #ETHUSDT - UniverseMetta - Signal
H4 - Formation of a 3-wave structure in continuation of the upward trend + exit from the channel. Stop behind the minimum of the 2nd wave.
Entry: 2589.93
TP: 2823.31 - 2992.67 - 3147.16 - 3408.07
Stop: 2437.44

ETHUSDT is Breaking Out!! Is the Bull Run Finally Here?After a long period of consolidation within a descending channel, BINANCE:ETHUSDT is showing signs of life as it finally breaks out with bullish intent. This technical breakout could mark the beginning of a fresh bull run, reminiscent of past explosive moves we’ve seen from MARKETSCOM:ETHEREUM following major corrections. Historically, CRYPTOCAP:ETH has experienced drawdowns of over 90%, only to bounce back stronger and reach new all-time highs.
Currently, BITSTAMP:ETHUSD remains deep in the oversold zone, suggesting it’s still undervalued relative to its potential. As momentum begins to pick up, we could see targets being hit one by one, driven by renewed investor interest and favorable market conditions.
Moreover, the recent surge in COINBASE:ETHUSD ETF inflows adds fundamental weight to the technical setup. This institutional participation could act as a catalyst for a sustained rally, reinforcing the bullish bias.
That said, risk management is key. Always trade with a clear stop loss and position sizing to protect capital. The opportunity is brewing – the question is, are you ready to ride the wave?
BYBIT:ETHUSDT Currently trading at $1790
Buy level : Above $1750
Stop loss : Below $1490
Target : $4000
Max leverage 3x
Always keep stop loss
Follow Our Tradingview Account for More Technical Analysis Updates, | Like, Share and Comment Your thoughts

$ETH Cooled Off After Pump – Healthy Correction Ahead?CRYPTOCAP:ETH pumped hard and touched $2,738 but now it’s pulling back a bit.
If you look at this 6H chart, you’ll notice price didn’t really take a healthy pause on the way up.
It just went straight up.
In my opinion, a pullback toward the $2,100–$2,150 zone would actually be a good thing. That area lines up with multiple supports, EMAs, previous breakout, and trendline, so it’s strong.
This type of dip could reset the momentum and build a base for the next rally.
Stay tuned and follow for more updates!
#Ethereum #ETHUSD #ETHUSDT

ETHUSD Multi Time Frame Trend Analysis, Profit Surging InsightsDaily Chart (1D) Overview
The daily chart reflects a powerful bullish breakout, where ETHUSD surged past prior resistance levels, now potentially turning into support. Key observations:
Support Zones:
The $2,300 to $2,400 zone has emerged as a strong demand area. This zone was previously resistance and has now flipped into support after the breakout.
A deeper retracement could potentially revisit the $1,750 to $1,850 demand area, though that would suggest a breakdown of current bullish momentum.
Resistance Zones:
The price is currently testing minor resistance around $2,600 and $2,650, with historical supply and reaction zones visible from previous consolidation.
A broader supply zone exists between $2,800 to $3,400, marked in red, which could be the next major target area if the bulls maintain momentum.
Structure:
ETH formed a higher low in late April followed by a higher high in early May, confirming a trend reversal from the earlier bearish structure.
The clean breakout from consolidation signals a fresh bullish leg, with increasing volume and momentum indicators likely aligning with upward bias.
Trend Direction: Bullish on both Daily and 4H
✅ Market Structure: Higher highs and higher lows
✅ Key Short-Term Support: $2,350 to $2,450
✅ Key Resistance Zones: $2,620 to $2,650 → $2,800 → $3,400
✅ Upside Targets:
1. Short-Term: $2,650 → $2,800
2. Medium-Term: $3,400 → $4,108
✅ Potential Retracement Levels:
3. Shallow: $2,420
4. Deeper: $2,200 and $1,850
If the price holds above $2,400, the bullish outlook remains intact, with increasing likelihood of testing higher resistance levels. However, a sustained move below $2,300 could trigger deeper retracements.
