#ETH: LOOK GOOD TO LONG!!Hi guys, This is CryptoMojo, One of the most active trading view authors and fastest-growing communities.
Consider following me for the latest updates and Long /Short calls on almost every exchange.
I post short mid and long-term trade setups too.
Let’s get to the chart!
I have tried my best to bring the best possible outcome to this chart, Do not consider it a financial
ETH UPADTE
ETH is forming this bullish pennant pattern we can long after the confirmed breakout of this pattern with SL: If any candle closes below the lower support of this pattern
I would also love to know your charts and views in the comment section.
Thank you
Ethusdtlong

ETHUSDT LongTime Frame: 4H
Symbol: ETHUSDT
Entry: 1697.87
TP: 1837.23
SL: 1597.22
Bias: Long
We are bullish here for this instrument. The trend pattern is suggestive a bullish bias.

ETHUSDT minor correction with continued growthETHUSDT minor correction with continued growth
continued formation of the ascending channel
❤️ If you find this helpful and want more FREE predictions on TradingView
. . . . . Please show your support
. . . . . . . . Click the 👍 LIKE button
. . . . . . . . . . . Leave your feedback below in the comments!
❤️ I use all my transactions in real trading in my account, my account has already reached Profitability:
1549.04%🙏!❤️
It's your turn!
Be sure to leave a comment and let us know how you see this opportunity and prediction.

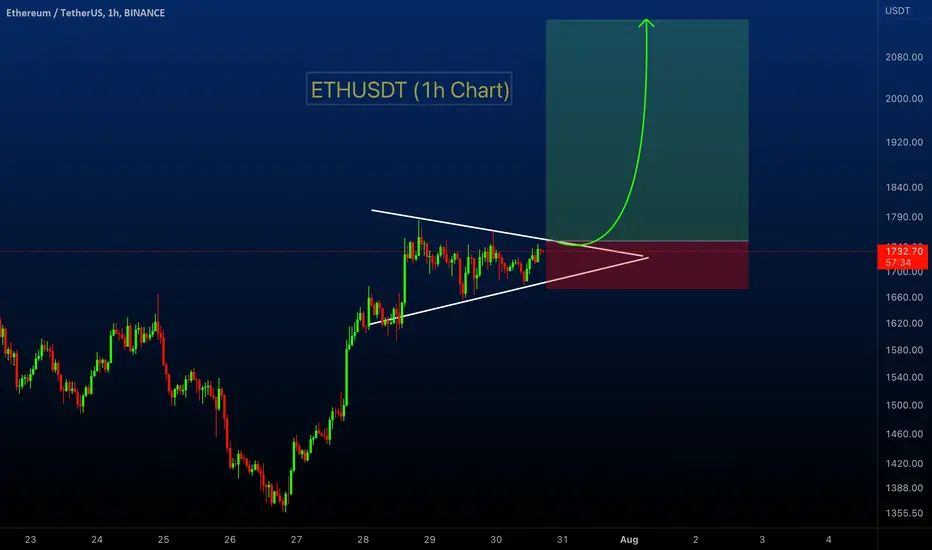
ETHUSDT Forming Flag/Pennant Pattern!!ETHUSDT (1h Chart) Technical analysis
ETHUSDT (1h Chart) Currently trading at $1734
Buy level: Above $1745 (Buy after breakout)
Stop loss: Below $1670
Target 1: $1780
Target 2: $1875
Target 3: $2000
Target 4: $2150
Max Leverage 3x
Always keep Stop loss
Follow Our Tradingview Account for More Technical Analysis Updates, | Like, Share and Comment Your thoughts
ETH - Buying signalBYBIT:ETHUSDT
1 Hour trend
-
ETH is going to break out the downtrend line, here is a timing to long.
-
Targets:
1) $1785
2) $1837.7~$1859.05
3) $1904.75
Stop: $1690.3
R/R: 1.3

ETH: Should hold this support!!Hi guys, This is CryptoMojo, One of the most active trading view authors and fastest-growing communities.
Consider following me for the latest updates and Long /Short calls on almost every exchange.
I post short mid and long-term trade setups too.
Let’s get to the chart!
I have tried my best to bring the best possible outcome to this chart, Do not consider it a financial
ETH breakout this flag pattern but it is currently at the resistance let's see if it will be able to break out this resistance or not.
I would also love to know your charts and views in the comment section.
Thank you

ETHUSD Idea H4Here is my view for ETHUSD on H4. The price could go up, you can put a pending order on the Order block or find an entry on LTF within OB Zone. Trade Safe!

ETH been crazy bullish since USD dropsETH long idea - take most of the posistion at swing high point and take partials allong other TP's (green lines)

#ETHUSDT: Will we keep falling?Hi guys, This is CryptoMojo, One of the most active trading view authors and fastest-growing communities.
Consider following me for the latest updates and Long /Short calls on almost every exchange.
I post short mid and long-term trade setups too.
Let’s get to the chart!
I have tried my best to bring the best possible outcome to this chart, Do not consider it a financial
On the chart we can see the descending channel, in which the price broke through upwards for the first time and is trying to consolidate above the level, earlier this boundary was worked out by the price very clearly and the price reacted strongly to it.
We can see that there is a battle for the side in the 1500-1600 area, either the bears or the bulls.
My guess is that the bears may prevail and bring the price back under the 1438 level, as there are no hints that the price will rise yet. The short-term target is support at 1438 and the medium-term target is the border of the lower range at 1264.
This chart is likely to help you make better trade decisions if it does consider upvoting it.
I would also love to know your charts and views in the comment section.
Thank you

#ETH/USDT TRADE SUTUP Hi guys, This is CryptoMojo, One of the most active trading view authors and fastest-growing communities.
Consider following me for the latest updates and Long /Short calls on almost every exchange.
I post short mid and long-term trade setups too.
Let’s get to the chart!
I have tried my best to bring the best possible outcome to this chart, Do not consider it a financial
ETH looks good But in a shorter time frame.
Entry range:-CMP AND ADD MORE UP TO $1508
Target:- %30
SL: CLOSE LONG POSITION if ETH breaks down this lower support
Lev:- 20x to 10x
This chart is likely to help you make better trade decisions if it does consider upvoting it.
I would also love to know your charts and views in the comment section.
Thank you

#ETH 1hour important support !!Hello dear traders, we here new so we ask you to support our ideas with your LIKE and COMMENT, also be free to ask any question in the comments, and we will try to answer for all, thank you, guys.
ETH/USDT Update!
As we can see ETH 1 hour chart eth is bouncing by 150MA don't panic if the position hold then do if ETH breaks is 150MA downside to close and $1470
Remember:-This is not a piece of financial advice. All investment made by me is at my own risk and I am held responsible for my own profit and losses. So, do your own research before investing in this trade.
Thanks for your time, we hope our work is good for you, and you are satisfied, we wish you a good day and big profits.
THANK YOU.

#ETH/USDT 4HOUR UPDATE !!Hello dear traders, we here new so we ask you to support our ideas with your LIKE and COMMENT, also be free to ask any question in the comments, and we will try to answer for all, thank you, guys.
ETH/USDT Update!
As we can see from the above chart that ETH performed well as per my previous chart, it was able to gain 9% from the lower green support level.
In the current scenario, ETH is highly likely to move higher toward the price level of $1780.
Here the Black MA is also reacting as a strong support area.
Rejection from this level will result in a decline towards the lower support level of $1300.
Remember:-This is not a piece of financial advice. All investment made by me is at my own risk and I am held responsible for my own profit and losses. So, do your own research before investing in this trade.
Thanks for your time, we hope our work is good for you, and you are satisfied, we wish you a good day and big profits.
THANK YOU.

#ETH/USDT 4HR CHART UPDATE !!Hello everyone welcome you all to this exclusive ETH4hr chart update.
If you find my updates helpful and productive, hit the like button follow and comment your view in the comment section, this motivates me to bring this kind of update regularly.
Let’s look into the chart,
As we can see in the above-mentioned chart that ETH performed well and printed a rally of 58% in almost 11 days.
In the current scenario ETH currently retesting the upper green support of $1450.
It needs to hold this level to climb above its next resistance which is highly likely in upcoming days towards the level of $1700 which is more than 15% from the current level.
Rejection from the current level can print meltdown towards the lower support levels of $1200.
Let’s see how it goes in the upcoming hours.
NOTE: If you find this update helpful, hit the like button and follow for this kind of regular update.
If you have anything to ask about this analysis you can ask in the comment section.
This is not financial advice. This is for education purposes only. I am not responsible for the profits or losses you generate from your investments.
DO YOUR RESEARCH BEFORE MAKING ANY TRADES.
Thank you.

ETHUSDT: Elliott Waves Intraday TradingETH price continues to rise within the ascending momentum of wave C.
Locally, a correction may form in wave 4, after which the price may continue to rise to complete the big ABC correction pattern in ascending wave 4.
As before, I plan to sell after the completion of local wave 5, after the formation of a false breakdown of the trend line.
I consider opening a long position only in case a bullish pattern of the current trend continuation is formed.
Best Regards,
CEO Tornado Capital

ETHUSDT LongTime Frame: 4H
Symbol: ETHUSDT
Entry: 1600.14
TP: 1770.61
SL: 1489.33
Bias: Long
For this instrument our overall bias is short. However, if we consider the short term momentum trading we can go for a long opportunity.

ETH: Is at resistance!!Hi guys, This is CryptoMojo, One of the most active trading view authors and fastest-growing communities.
Consider following me for the latest updates and Long /Short calls on almost every exchange.
I post short mid and long-term trade setups too.
Let’s get to the chart!
I have tried my best to bring the best possible outcome to this chart, Do not consider it a financial
#ETH UPDATE
Update: ETH form this big channel in 2d time frame.
Currently, ETH is facing two resistance one is this horizontal resistance and the second this the middle of this channel.
ETH need to break this resistance if it reject then it will go test $1280.
Let’s see how the market will react.
Let me know in the comments. Do show your support with your likes and if you don't want to miss any updates then follow my channel.
This chart is likely to help you make better trade decisions if it does consider upvoting it.
I would also love to know your charts and views in the comment section.
Thank you

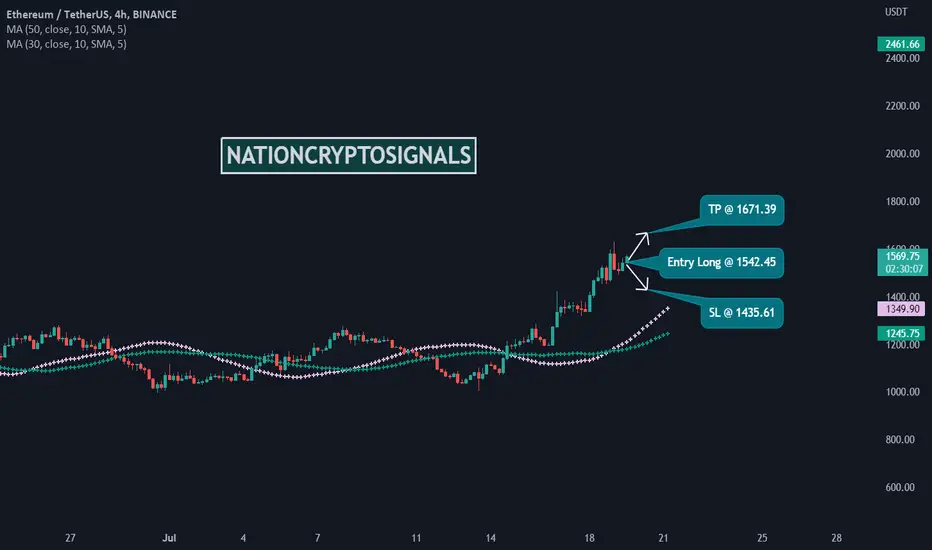
ETHUSDT LongTime Frame: 4H
Symbol: ETHUSDT
Entry: 1542.45
TP: 1671.39
SL: 1435.61
Bias: Long
We are bullish for this instrument. The current trend pattern of this pair is showing a bullish bias.
Ethereum Climbing Stairs.Ethereum - Intraday - We look to Buy at 1461 (stop at 1409)
Our short term bias remains positive.
There is no clear indication that the upward move is coming to an end.
Bespoke support is located at 1450.
20 4hour EMA is at 1430.
We look for gains to be extended today.
Our profit targets will be 1584 and 1624
Resistance: 1600 / 1630 / 1700
Support: 1500 / 1450 / 1400

ETHUSDT Elliott Waves Analysis (GLOBAL VISION)Hello friends.
Please support my work by clicking the LIKE button👍(If you liked). Also i will appreciate for ur activity. Thank you!
Everything on the chart. (sorry for a dirt)
It is quite possible that the bottom of the ether was passed around $900,
and we have completed the formation of the global wave (IV) and we are expecting a good growth in wave (V) in the area of 6-8 thousand.
Target zone: 6000-8000$
Risk/Reward: 1 to 15
Stop: ~900
Good luck everyone!
Follow me on TRADINGView, if you don't want to miss my next analysis or signals.
It's not financial advice.
Dont Forget, always make your own research before to trade my ideas!
Open to any questions and suggestions.

ETHUSDT: Medium Term Wave LevelsIn today's review, I present to you my trading plan for Ethereum.
I don't like WXY models and truncations in corrective waves, but it's almost impossible to work and trace the possible logic of price behavior otherwise.
Criticism from the outside is almost inappropriate, because. I am not trying to prove anything, but simply sharing my plans for the near future, which may help to understand my actions.
In general, the structure of Ethereum wave levels is similar to the wave structure on bitcoin. In both cases, I am considering the formation of a large wave 4, after which the price may, with a high probability, go to new historical lows.
What drivers can serve for such dynamics?
So far, it's hard to predict.
However, they may appear later, when the price will be already in a downward momentum.
Do I consider a scenario with continued growth in the current market structure?
Definitely - Yes.
But, this can be determined by the fact of the formation of bullish patterns of continuation of the trend.
Now I am guided by dry facts, price dynamics, trading volume and the general structure of prices in the crypto derivatives market.
I will consider going short Ethereum at the end of wave 5 of wave C (in wave 4).
Good luck planning good trades)
Best Regards,
CEO Tornado Capital

💡Don't miss the great buy opportunity in ETHUSD @ethereumTrading suggestion:
". There is a possibility of temporary retracement to the suggested support line (1263.32).
. if so, traders can set orders based on Price Action and expect to reach short-term targets."
Technical analysis:
. ETHUSD is in a range bound, and the beginning of an uptrend is expected.
. The price is above the 21-Day WEMA, which acts as a dynamic support.
. The RSI is at 69.
Take Profits:
TP1= @ 1419.70
TP2= @ 1537.09
TP3= @ 1645.61
TP4= @ 1735.38
TP5= @ 1916.51
SL= Break below S2
❤️ If you find this helpful and want more FREE forecasts in TradingView
. . . . . Please show your support back,
. . . . . . . . Hit the 👍 LIKE button,
. . . . . . . . . . Drop some feedback below in the comment!
❤️ Your support is very much 🙏 appreciated!❤️
💎 Want us to help you become a better Forex / Crypto trader?
Now, It's your turn!
Be sure to leave a comment; let us know how you see this opportunity and forecast.
Trade well, ❤️
ForecastCity English Support Team ❤️

💡Don't miss the great buy opportunity in ETHUSD @ethereumTrading suggestion:
". There is a possibility of temporary retracement to the suggested support line (1263.32).
. if so, traders can set orders based on Price Action and expect to reach short-term targets."
Technical analysis:
. ETHUSD is in a range bound, and the beginning of an uptrend is expected.
. The price is above the 21-Day WEMA, which acts as a dynamic support.
. The RSI is at 70.
Take Profits:
TP1= @ 1419.70
TP2= @ 1537.09
TP3= @ 1645.61
TP4= @ 1735.38
TP5= @ 1916.51
SL= Break below S2
❤️ If you find this helpful and want more FREE forecasts in TradingView
. . . . . Please show your support back,
. . . . . . . . Hit the 👍 LIKE button,
. . . . . . . . . . Drop some feedback below in the comment!
❤️ Your support is very much 🙏 appreciated! ❤️
💎 Want us to help you become a better Forex / Crypto trader ?
Now, It's your turn !
Be sure to leave a comment; let us know how you see this opportunity and forecast.
Trade well, ❤️
ForecastCity English Support Team ❤️

#ETH/USDT UPDATE!!Hi guys, This is CryptoMojo, One of the most active trading view authors and fastest-growing communities.
Consider following me for the latest updates and Long /Short calls on almost every exchange.
I post short mid and long-term trade setups too.
Let’s get to the chart!
I have tried my best to bring the best possible outcome to this chart, Do not consider it a financial
#ETH UPDATE
Update: ETH lately, showed some greens which were suitable for the market. The current scenario of ETH is under a bullish expanding triangle which technically is bullish. It is testing the resistance at $1240. This is quite a decisive moment for ETH. If it successfully breaks and closes above the resistance level then we can expect some good rally. But if it gets rejected from the resistance, the trend will get reversed and we may see some drops.
Fundamentals: ETH is having a conference meeting on the 19th of July 2022. The Ethereum Community Conference (EthCC) is the largest annual European Ethereum event focused on technology and community.
What is your opinion about ETH? Do you think it will rally higher or will it drop badly?
Let me know in the comments. Do show your support with your likes and if you don't want to miss any updates then follow my channel.
This chart is likely to help you make better trade decisions if it does consider upvoting it.
I would also love to know your charts and views in the comment section.
Thank you
