ETHUSDT TargetsEthereum would need avoid the $4,217 pivot level to support a run at the first major resistance level at $4,535.
Support from the broader market would be needed, however, for Ethereum to break out from last week’s ATH $4,461.96.
Barring an extended crypto rally, the first major resistance level would likely cap any upside.
In the event of another extended breakout, Ethereum could test resistance at $5,000 levels before any pullback. The second major resistance level sits at $4,780.
A fall through the $4,217 pivot would bring the first major support level at $3,972 into play.
Barring an extended sell-off in the week, Ethereum should steer clear of sub-$3,800 levels. The second major support level sits at $3,655.
At the time of writing, Ethereum was up by 0.63% to $4,316.98. A mixed start to the week saw Ethereum fall to an early Monday low $4,281.33 before rising to a high $4,328.05.
Ethereum left the major support and resistance levels untested early on.
Long Term Targets For Ethereum :
1st Target = $5000
2th Target = $7000
3th Target = $11000
Ethusdtlong

eth/usdtAfter seen a double bottom on the 50 MA and a red candle surging after we should expect eth on a long
practicing my skills
just my idea not a financial advice

ETHUSDT Roadmap ETH is great for investment. As you see on the chart, 9k, 12k, and 17k are the major points that will be touched in the future. Hold and whenever it falls, you can add to your wallet. BTC, ETH, and DOT have the same capacity, and all these ones are going to touch upper levels. As a tip, whenever you are in profit, you can take your profit! HODL and enjoy!

ETH/BTC - Will Alt Season be coming on the next Month?when we look at ETH/BTC price, the price is still in consolidation, if the price breakout the Upper Resistance, we will see Alt Season, my prediction is about next month we will see Alt season

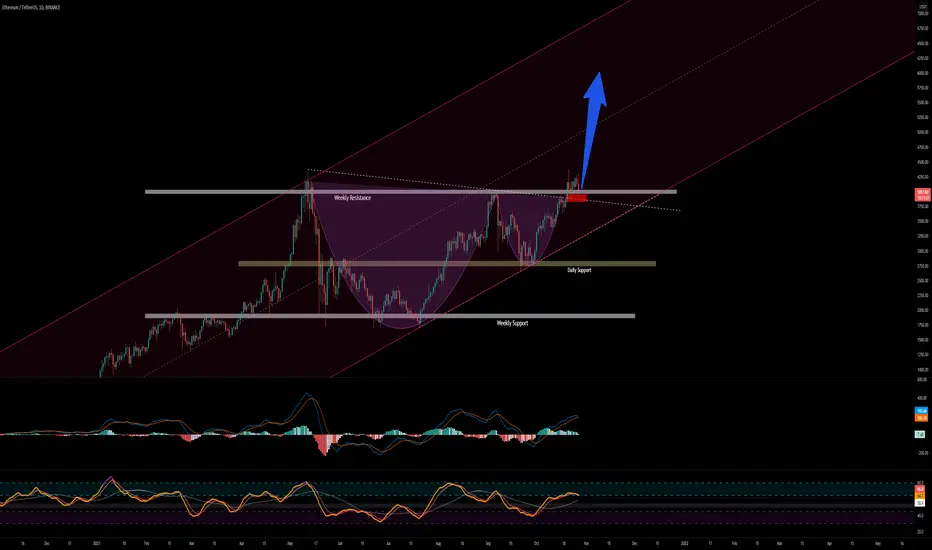
#ETHUSDT to $6,275 ? , Massive Pattern BrokeoutWelcome to this quick update, everyone.
ETHUSDT looks really bullish here.
I know the market looks scary here but this chart says otherwise.
The Cup and Handle pattern has broken out.
If the upcoming weekly closes above the 42k level it's highly likely we will see a 6k+ ETH by the end of this year.
just to clear your doubt:- There's always a shakeout before every big rally and I believe the current market is in that situation.
We can have some long wicks to the downside which will eventually be bought by the bulls.
The target of this pattern is $6275 roughly a 55% Rally.
21D MA is the indicator that you need to follow for the invalidation of this chart.
Any close below 21D MA will either invalidate or delay this rally.
This is not financial advice, DYOR before taking any trading action.
What do you think about this chart?
Do hit that like button and share your views in the comment section.
Thank you
#PEACE

ETHUSDTETH You have good conditions for buying and maintaining. Targets are $ 4,500, $ 5,500 and $ 6,000.
Due to the fall of Bitcoin today, we did not see much correction in this currency and it is well supported in the daily support range and the neckline of the Cup.
ETH in Bullish Channel on 1D !Eth is going perfectly and following the buying channel ( up trend ) ! which will leads to alt coins pump i.e altseason will go up soon !!
Ps:- This is not a financial advice ! this is only my views on chart !

ETH Head And Shoulder
we have two entries long to complete this pattern.
after reach these points you can join or wait for right shoulder.

ETHUSDT , Its moving exactly toward the target :D :D :D :DHello every body
Did you take in position guys ?
The price exactly move from the buy zone area and its ready to reach to the 1st Tp
Be with us and enjoy your profit
Good Luck
Abtin

EthUsd- 4500 soonAfter a strong volatile day last week, EthUsd is tightening the range and is consolidating October's gains.
At this point, bulls need a break above 4200 and the next target is psychological level of 4500.
This bullish scenario is negated if price closes under 4k

updat btcusdtMy opinion is until the bitcoin reaches the range of 90 thousand dollars and the way forward and the time ahead

ETHUSDT Next Target $10,000 ?ETHUSDT Technical Analysis Update
ETHUSDT currently trading at $4100
Major resistance trend line breakout in day chart. price can consolidate at 4000- 4400 level before making new ATH.
Long Entry level: $3900 - $4100
TP 1 : $5000
TP 2 : $6000
TP 3 : $7500
TP 4: $10,000
Stop loss: $3000
Max leverage : 2x or buy it on spot market

ETH going above 4500$ in a few daysDespite the correction, ETH remained in the channel and did not drop below the support line. Moreover, a bullish signal for H4 was formed on the last candlestick. Expect ETH to recover to 4500 and move higher in the next few days.

ETHUSDT , We are in buy zone ...Hello guys
According to our previous analysis , the market moved exactly to our way
At this time from the past we are in upward channel and we are near the base trendline and we need to take signal and watch carefully to take signal and take position and buy
Maybe it can break the base of trendline like BTCUSDT chart that we published but its not have high chance for it
Previous analysis :
Dont forget use stop loss and attention to money management
Be with us and sleep comfortably
Good Luck
Abtin


ETHUSDT....1D*** Cross the upper triangle line.
*** Inside a bullish price channel (blue).
***Purchase(Very Strong):=4185 //5090 // 5834.
*** Sell (very weak): = If he breaks 3950, he goes to the blue trend
*** Point 3950 is the boundary between buying and selling.

ETHUSDT Next destination !!!!!I'm bullish on Eth, Eth has huge upward potential guys. Keep eye on it.

ETHUSDT , Its moving as same as ...Hello everybody
I hope everyone is in profit
In here we have a upward channel like BTC that we published it and exactly happend and we expect that ETH is moving like BTC movement
Until the price is in this channel we expect the market is rising the price and moving toward the TP
You can buy in here or you can check again the area for taking signal then take in position
Bitcoin analysis :
Dont forget stop loss
Be with us and sleep comfortably
Good Luck
Abtin

ETHUSDT LONGETHUSDT is a pair that has seen several uptrend that breaks new resistance levels. In my forecast, price will eventually get to 4102.71 after breaking the resistance level of 4034.14

ETH Long Term Bullish 20kIt may not reach the 20k or 13k target overnight but it'll eventually go there. be patient and watch.

ETH Buy Flat PatternHello Traders!
Right time to jump in to the Ethereum especially if you have missed the previous bull run entry point:
Buy Setup:
==========
Buy now
Take Profit between : $3950 and $4000
Stop Loss : As you wish
Good Luck!
Happy trading

ETH/USD (Test Swing Top 4k?)💎Technical Analysis Summary💎
ETH/USD
-Ethereum finally broke its mid resistance area after 37 days
-One of the early signs of strength before the breakout is EMA19 is respected
-With the help of Bitcoin's recovery from 53k up to 57k dollars today
-Now, if BTC will remain stable or sideways in the coming days
-I think ETH will likely test its recent swing top at 4k dollar
-Everything is looking good for this coin and expecting a good move up
-As long as it can hold above its previous resistance at 3.6k dollar
⚠️Please always read the description⚠️
Thanks for donating 💰 via Tradingview coins ozzyman2 🙏🎉
``````````````````````````````````````````````
If you need help🙋 don't hesitate to
Send me a message here PolarHusk 😊
``````````````````````````````````````````````
Trading Involves High Risk ⚠️
Not Financial Advice 💸
Exercise Proper Risk Management 💱
``````````````````````````````````````````````

💡Don't miss the great buy opportunity in ETHUSD @ethereumTrading suggestion:
". There is a possibility of temporary retracement to the suggested support line (3603.67).
. if so, traders can set orders based on Price Action and expect to reach short-term targets."
Technical analysis:
. ETHUSD is in a range bound, and the beginning of an uptrend is expected.
. The price is above the 21-Day WEMA, which acts as a dynamic support.
. The RSI is at 67.
Take Profits:
TP1= @ 3848.59
TP2= @ 4031.03
TP3= @ 4169.79
TP4= @ 4353.22
TP5= @ 4546.84
SL= Break below S2
❤️ If you find this helpful and want more FREE forecasts in TradingView
. . . . . Please show your support back,
. . . . . . . . Hit the 👍 LIKE button,
. . . . . . . . . . Drop some feedback below in the comment!
❤️ Your support is very much 🙏 appreciated!❤️
💎 Want us to help you become a better Forex / Crypto trader?
Now, It's your turn!
Be sure to leave a comment; let us know how you see this opportunity and forecast.
Trade well, ❤️
ForecastCity English Support Team ❤️
