ETH/USDT Bullish Reversal Analysis Chart Overview:
Ethereum (ETH) has shown a strong bullish reversal from the support zone near $2,200, forming a V-shaped recovery pattern. The price is currently trading around $2,450, with upward momentum targeting the next key resistance level.
📌 Key Technical Highlights:
✅ Support Zone:
Clearly respected at $2,200 – $2,300 range
Multiple candle wicks suggest strong buyer interest
✅ Resistance Zone:
Major resistance expected around $2,900
Historical rejection indicates potential selling pressure
✅ Target Level:
Short-term target marked at $2,610 🟣
If momentum sustains, price could push towards this zone before facing resistance
📈 Bullish Momentum:
Strong breakout from downtrend channel
Formation of higher highs and higher lows
Price action respecting upward trend structure
🛠 Pattern Structure:
Reversal pattern after corrective phase
Bullish engulfing candles suggest continuation
📊 Forecast Path:
Two potential scenarios are outlined:
📈 A clean push to the $2,610 target, followed by consolidation
🔄 A short pullback to $2,374 before continuation to the target
⚠️ Conclusion:
ETH/USDT is showing bullish signs with potential to reach $2,610. Watch for consolidation or pullbacks as buying opportunities, but be cautious of heavy resistance above $2,900. Ideal for short- to mid-term bullish setups
ETHUSDTPERP

MACD Divergence Flashing Red, Could This Trigger a -30% Crash?Hey Realistic Traders!
Bearish Reversal Signal Flashing on BINANCE:ETHUSDT , Is the Bull Run Over?
Let’s Break It Down..
On the daily timeframe, Solana (SOL) has formed an ascending broadening wedge, which has now broken to the downside through both the lower trendline and a major support zone, indicating a shift in market structure.
Price action has also remained consistently below the 200-day EMA, signaling a potential transition from a bullish to a bearish trend.
A bearish divergence has appeared on the MACD indicator, where price makes higher highs while the MACD forms lower highs. This divergence indicates that buying momentum is weakening, even as the price pushes higher. Such a pattern often precedes a trend reversal and supports the expectation that the price may continue to move lower.
Given these technical signals, the price is likely to continue moving lower toward the first target at 1849.07, with a possible extension to the second target at 1534.44.
This bearish outlook remains valid as long as the price stays below the stop-loss level, currently marked at 2734.40. A move above this level would invalidate the bearish setup.
Support the channel by engaging with the content, using the rocket button, and sharing your opinions in the comments below.
Disclaimer: "Please note that this analysis is solely for educational purposes and should not be considered a recommendation to take a long or short position on ETHUSDT.

ETH/USDT Bullish Reversal from Support Zone Chart Analysis:
The chart illustrates a range-bound consolidation with clear support around $2,381.45 and resistance near $2,556.54.
🔍 Key Observations:
✅ Multiple Support Tests: Price has tested the support zone several times (highlighted by orange circles) and respected it, indicating strong buying interest at the lower boundary.
📉 Fakeout and Recovery: A false breakout below support occurred, but the candle quickly reversed, signaling a bear trap and potential for bullish momentum.
🔼 Rejection Wick & Consolidation: A strong rejection wick on the most recent candlestick shows buyers defending the zone aggressively. The current price action shows consolidation — a bullish accumulation pattern.
🎯 Upside Target: Based on the range breakout projection, the price could potentially revisit the resistance zone at $2,556.54, marked as the TARGET on the chart.
📌 Technical Outlook:
🟢 Bias: Bullish as long as the price holds above $2,381.45.
💹 Entry Idea: Aggressive buyers may enter near current levels with a stop below the wick low.
🛑 Risk Level: Tight stop-loss needed as the structure relies heavily on support holding.
📈 Conclusion:
A classic range rebound setup is forming with potential for upside movement back toward resistance. A breakout above $2,556.54 could initiate a trend continuation rally

Ethereum at PRZ: Bullish Setup _ Short termEthereum ( BINANCE:ETHUSDT ) reacted from the Potential Reversal Zone (PRZ) around the confluence of key Fibonacci levels , the Important Support line and 50_SMA(Daily) .
From an Elliott Wave point of view , we can identify a Expanding Flat (ABC/3-3-5) structure ending right above the Support zone ($2,474-2,437) .
The structure also hints at the formation of a new upward leg , potentially leading ETH toward the Resistance zone ($2,564-$2,524) and the upper line of the Ascending Channel .
I expect Ethereum to test the 38.2%($2,531=First Target) - 50%($2,561) Fibonacci retracement levels on the way to a potential retest of the previous swing highs .
Note: Stop Loss (SL) = $2,451= Worst Stop Loss(SL)
Please respect each other's ideas and express them politely if you agree or disagree.
Ethereum Analyze (ETHUSDT), 15-minute time frame.
Be sure to follow the updated ideas.
Do not forget to put a Stop loss for your positions (For every position you want to open).
Please follow your strategy and updates; this is just my Idea, and I will gladly see your ideas in this post.
Please do not forget the ✅' like '✅ button 🙏😊 & Share it with your friends; thanks, and Trade safe.

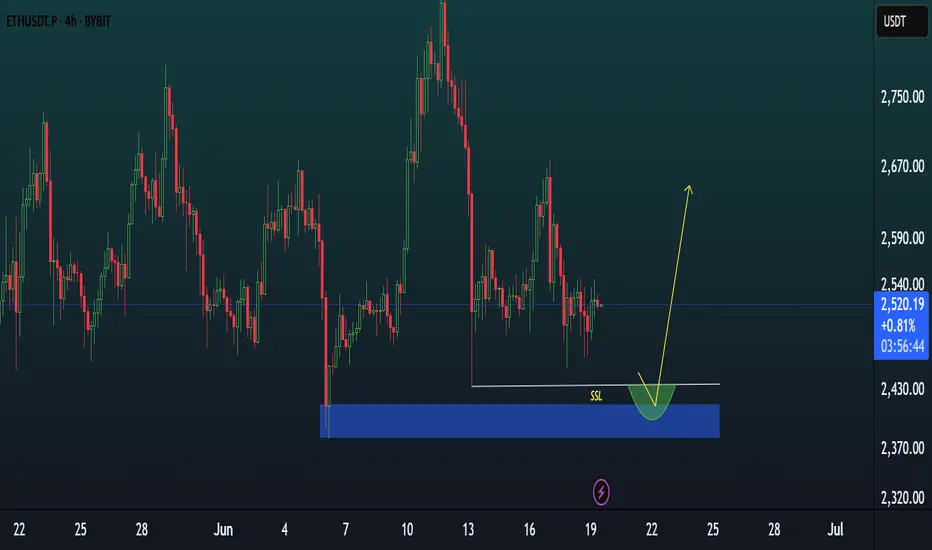
ETH NEXT BUYZONE.ETH has created a wick and below that is a huge liquidity cluster. I want price to fill that liquidity cluster and then upside.

ETH/USDT – Bearish Reversal from Resistance Zone ETH/USDT – Bearish Reversal from Resistance Zone 📉
The chart above clearly illustrates a strong bearish setup on the ETH/USDT pair. Here's a professional breakdown:
📊 Technical Overview:
Resistance Zone (~2750–2850 USDT):
Marked by three distinct rejections (highlighted by red arrows).
Every attempt to break above this zone has resulted in a sharp price rejection, indicating strong selling pressure.
Current Price: 2529.69 USDT
Price has already broken below the immediate support formed after the last rejection.
The pair is now trending lower with bearish momentum.
Support Zone (~2250–2350 USDT):
This is the next major demand zone where previous accumulation took place.
The projection arrow indicates the likely path toward this area.
🔍 Price Action Insights:
Repeated failure to break resistance confirms a triple top pattern, a classic bearish reversal signal.
The recent sharp drop from the top is accompanied by strong bearish candles, showing momentum.
Minor consolidation might occur before continuation downward, as suggested by the zigzag arrow.
📉 Conclusion:
If bearish momentum sustains, ETH/USDT is likely to drop toward the 2,300 USDT support zone. A break below could open the door for even lower levels, while any bounce would need to reclaim the 2,700 USDT level to shift sentiment.
📌 Traders should watch for lower highs and bearish confirmations before entering short positions.


ETH LONG TRADE PLAN.ETH long below the liquidity line in demand zone. Below sell side liquidity is our entry zone.

ETHUSDT.P H1 : Short-Term CorrectionBy analyzing the 1-hour timeframe, we can see that the price may drop from the 2780–2820 zone down to 2600

ETH Bullish Setup: Pullback to 200_SMA(D) May Launch Next Rally Ethereum ( BINANCE:ETHUSDT ) seems to have finally managed to break the Resistance lines and the 200_SMA(Daily) in the fifth attack . However, the number of Resistance lines inside the Heavy Resistance zone($2,929_$2,652) is high, and Ethereum will find it difficult to break through them.
In terms of Elliott Wave theory , it seems that Ethereum is completing microwave 4 , and we should wait for this wave to complete. Microwave 4 could act as a pullback to the resistance lines and 200_SMA(Daily) .
I expect Ethereum to start rising from the Support zone($2,745_$2,650) again and rise to at least the Potential Reversal Zone(PRZ) .
Note: If Ethereum touches $2,537 , we can expect further declines.
Please respect each other's ideas and express them politely if you agree or disagree.
Ethereum Analyze (ETHUSDT), 1-hour time frame.
Be sure to follow the updated ideas.
Do not forget to put a Stop loss for your positions (For every position you want to open).
Please follow your strategy and updates; this is just my Idea, and I will gladly see your ideas in this post.
Please do not forget the ✅' like '✅ button 🙏😊 & Share it with your friends; thanks, and Trade safe.

Bad Time Over for ETH? Second Wave Toward $4,000 Incoming!!🟢 Bad Time Over for ETH? Second Wave Toward $4,000 Incoming
MARKETSCOM:ETHEREUM ( CRYPTOCAP:ETH ) appears to be leaving its consolidation phase behind, and all signs point to a fresh bullish wave. After outperforming Bitcoin in recent days, CRYPTOCAP:ETH has now broken out of a key structure — signaling the potential start of a major uptrend.
We’re also witnessing rising CRYPTOCAP:ETH inflows, suggesting growing investor confidence. This kind of accumulation behavior has historically led to significant rallies. Previously, ETH consolidated between $1700–$1800 before a strong move up. More recently, it ranged between $2400–$2700, and now that it’s broken out, we’re anticipating another powerful leg — possibly the second wave of this trend.
If the current momentum continues, a move toward $4000 looks likely, and with enough strength, even a new all-time high isn’t off the table.
BINANCE:ETHUSDT Currently trading at $2795
Buy level : Above $2750
Stop loss : Below $2305
Target : $4000
Max leverage 3x
Always keep stop loss
Follow Our Tradingview Account for More Technical Analysis Updates, | Like, Share and Comment Your thoughts
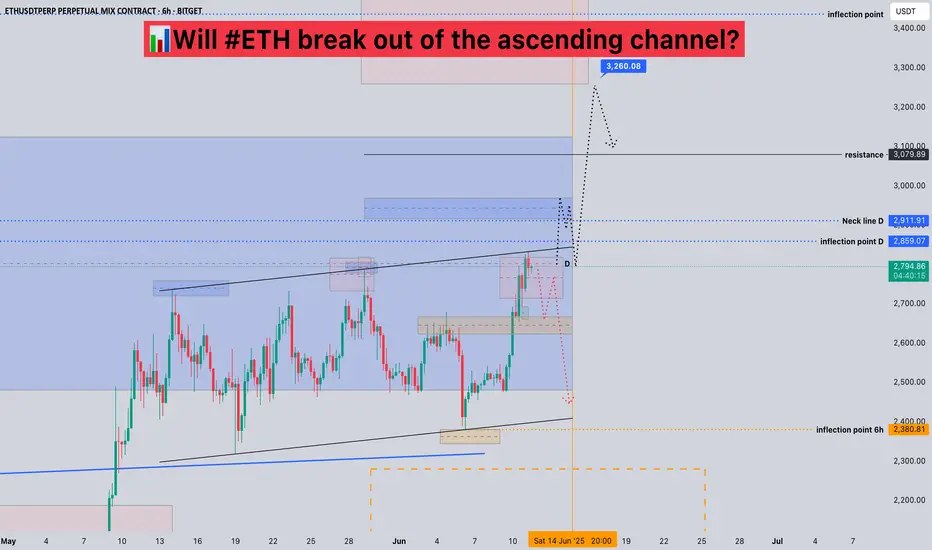
Will #ETH break out of the ascending channel?📊Will #ETH break out of the ascending channel?
🧠From a structural perspective, we are currently in the resistance zone at the daily level, so we have digested the selling pressure here by sideways consolidation. Because the selling pressure here is large, we still need to remain cautious.
➡️From a graphical perspective, we are currently blocked at the upper edge of the ascending channel, so we need to be vigilant about the risk of a pullback at any time. If we continue to break upward, then we need to pay attention to trading opportunities after the support and resistance conversion.
⚠️Even if it breaks upward, the nearby 2911 is also resistance. If it breaks upward again, then the resistance worth our attention is around 3300.
Let's see 👀
🤜If you like my analysis, please like 💖 and share 💬 BITGET:ETHUSDT.P
#ETH Bearish Head and Shoulders📊#ETH Bearish Head and Shoulders📉
🧠From a structural perspective, we failed to break through the blue resistance zone yesterday, but fell below point 4, which means that the previous rise is over and the probability of continuing the bullish force is reduced. If it went straight up yesterday and reached the heavy resistance area of 2860-2911 that I want to focus on, then I would try to short trade, but the market did not give us such an opportunity.
➡️From a graphical perspective, we have built a bearish head and shoulders structure in the resistance area, and we have formed a rising wedge after this period of sideways consolidation. Both models are bearish expectations, so we need to be wary of the risk of a pullback.
Let's take a look👀
🤜If you like my analysis, please like💖 and share💬 BITGET:ETHUSDT.P

Quasimodo Pattern + Validator Support = Bullish Signal for ETHToday I want to analyze Ethereum ( BINANCE:ETHUSDT ) for you, many tokens are on the Ethereum network , and the increase or decrease of Ethereum directly affects most tokens.
So please stay with me.
Ethereum is trading in a Heavy Resistance zone($2,929_$2,652) near the Resistance lines and 200_SMA(Daily) . It is worth noting that Ethereum is preparing itself for a third attack on 200_SMA(Daily).
In terms of Price Action Analysis , Ethereum could start to rise with the help of the Bullish Quasimodo Pattern and break out of 200_SMA(Daily) and Resistance lines .
In terms of Elliott Wave theory , Ethereum appears to have completed a main wave 4 near Important Support lines . The structure of the main wave 4 is a Double Three Correction(WXY) . By breaking the 200_SMA(Daily) and Resistance lines , we can confirm the end of the main wave 4 .
The ETHBTC ( BINANCE:ETHBTC ) chart conditions are bullish , so it seems like investing in Ethereum could be better than Bitcoin . At least if the market falls , Ethereum is likely to be less likely to suffer a decline .
Note : Over 150,000 Ethereum validators, representing approximately 15% of the network, signaled support for increasing the gas limit from 36 million to 60 million units. This proposed change aims to enhance network capacity, reduce transaction fees, and improve scalability. While this development could positively impact ETH's price by making the network more efficient, it's essential to monitor potential technical risks and ensure that decentralization is maintained.
Note: If Ethereum touches $2,547 , we can expect further declines.
Please respect each other's ideas and express them politely if you agree or disagree.
Ethereum Analyze (ETHUSDT), 1-hour time frame.
Be sure to follow the updated ideas.
Do not forget to put a Stop loss for your positions (For every position you want to open).
Please follow your strategy and updates; this is just my Idea, and I will gladly see your ideas in this post.
Please do not forget the ✅' like '✅ button 🙏😊 & Share it with your friends; thanks, and Trade safe.

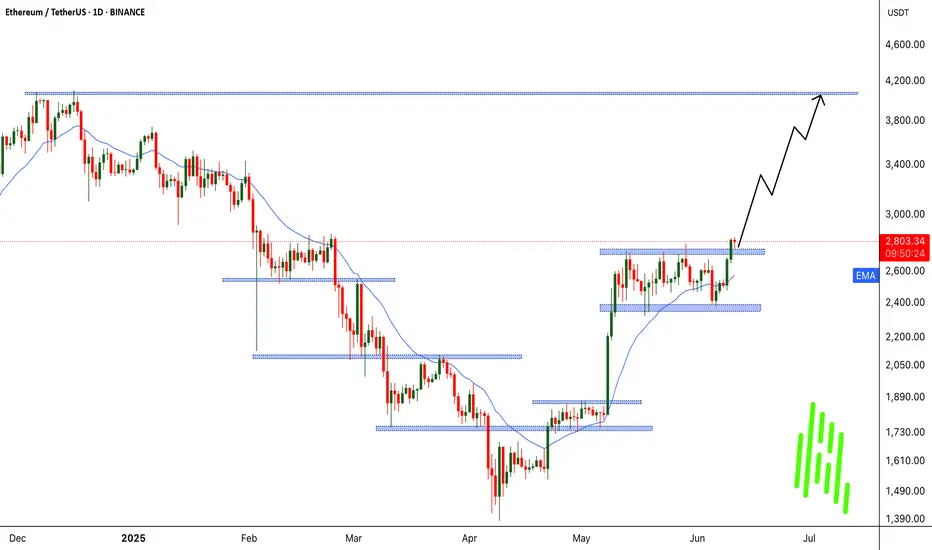
ETHUSDT Bullish Structure Intact: Higher Highs Continue#ETHUSDT – 1D Chart
Ethereum is in a strong uptrend, consistently forming higher highs (HH) and higher lows (LH).
Price recently broke above a key resistance zone after consolidating in an accumulation range. This breakout confirms bullish strength.
If ETH holds above this zone, we could see a continuation move to the upside in the coming days.
Structure remains bullish — trend is intact.
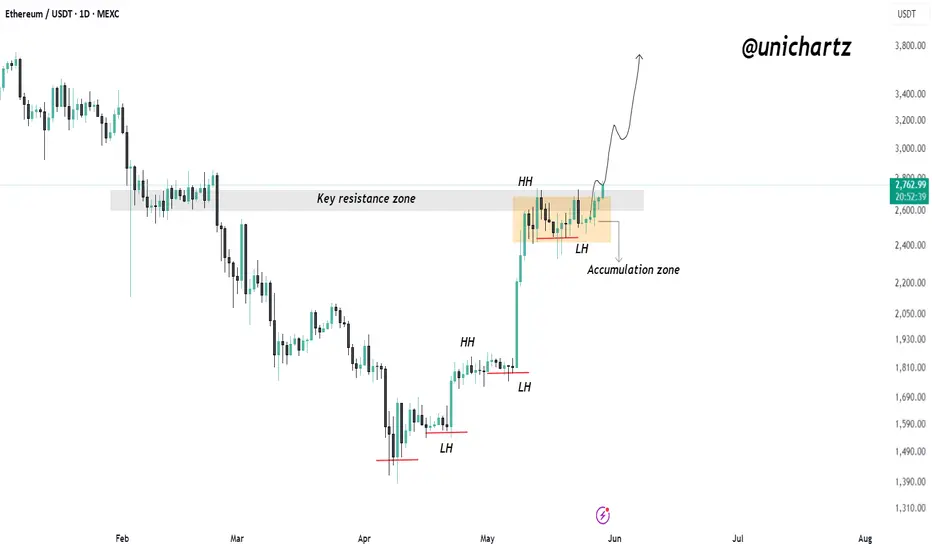
ETH Staying Bullish – Break Above Could Target $3K+$ETH/USDT Update
ETH is moving strong, forming clear higher highs and higher lows. Right now, it’s ranging in an accumulation zone just below key resistance.
As long as it holds above the 50 EMA and recent low, the trend looks bullish. A breakout here could send it flying toward $3,000+.
Still healthy, still in play.
DYOR, NFA

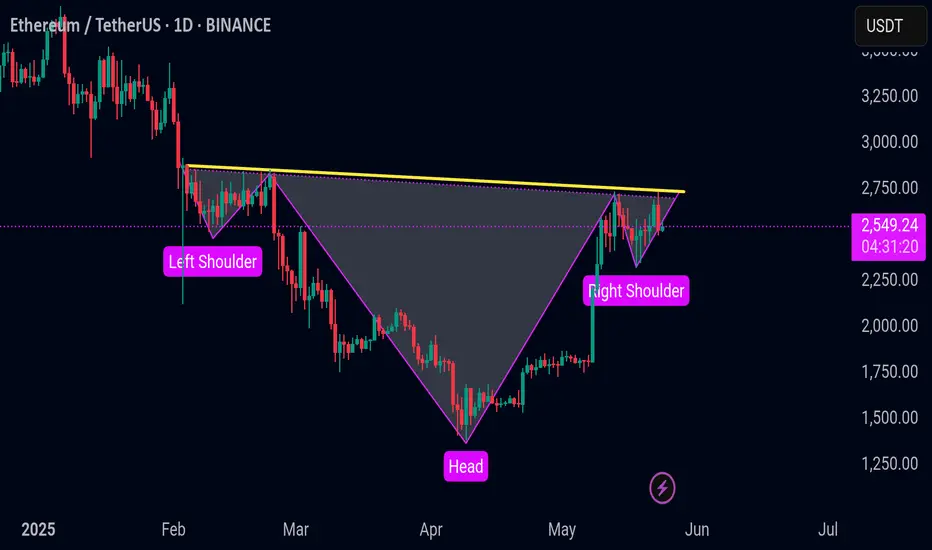
ETHUSDT UPDATE ETHUSDT
Ethereum is currently trading around the \$2550 level and is forming an inverse head and shoulders pattern on the daily timeframe. This is typically seen as a bullish reversal pattern, especially after a sustained downtrend.
If the price breaks above the neckline and closes with strong volume, it could confirm the pattern and signal a potential move to the upside. This breakout would likely invite bullish momentum and lead to higher price targets in the short to mid term. On the other hand, if Ethereum fails to break the neckline and gets rejected, it may continue to consolidate or revisit lower support areas.
Keep a close watch on the neckline level, price action, and volume — these will be key in validating the potential breakout.
ETHUSDT: Possible Minor to Major Corrections May HappenETHUSDT has a higher chance of experiencing a minor or major correction in the coming days, although we haven’t confirmed this yet. We need more confirmation before we can be certain about the future of ETH. However, if the price decides to undergo a major correction, it’s likely to drop to our second area, where it’s expected to fill the liquidity gap and then reverse, continuing towards our three targets.
Please use this analysis as secondary bias only or even only for educational purposes. Always conduct your own analysis and risk management before trading or investing in cryptocurrencies, as they carry significant financial risk. Good luck and trade safely.
If you want to support us, you can do so by liking the idea, commenting with your views, or sharing it.
Much love ❤️
Have a great weekend
Team Setupsfx_

ETHUSDT is Breaking Out!! Is the Bull Run Finally Here?After a long period of consolidation within a descending channel, BINANCE:ETHUSDT is showing signs of life as it finally breaks out with bullish intent. This technical breakout could mark the beginning of a fresh bull run, reminiscent of past explosive moves we’ve seen from MARKETSCOM:ETHEREUM following major corrections. Historically, CRYPTOCAP:ETH has experienced drawdowns of over 90%, only to bounce back stronger and reach new all-time highs.
Currently, BITSTAMP:ETHUSD remains deep in the oversold zone, suggesting it’s still undervalued relative to its potential. As momentum begins to pick up, we could see targets being hit one by one, driven by renewed investor interest and favorable market conditions.
Moreover, the recent surge in COINBASE:ETHUSD ETF inflows adds fundamental weight to the technical setup. This institutional participation could act as a catalyst for a sustained rally, reinforcing the bullish bias.
That said, risk management is key. Always trade with a clear stop loss and position sizing to protect capital. The opportunity is brewing – the question is, are you ready to ride the wave?
BYBIT:ETHUSDT Currently trading at $1790
Buy level : Above $1750
Stop loss : Below $1490
Target : $4000
Max leverage 3x
Always keep stop loss
Follow Our Tradingview Account for More Technical Analysis Updates, | Like, Share and Comment Your thoughts

ETHUSDT LONG TRADE IDEA.ETHUSDT is showing strength but I will not long it blindly, first I will look for liquidity sweep then reclaim that point which is marked as POI. Then you can ride on long.

$ETH Cooled Off After Pump – Healthy Correction Ahead?CRYPTOCAP:ETH pumped hard and touched $2,738 but now it’s pulling back a bit.
If you look at this 6H chart, you’ll notice price didn’t really take a healthy pause on the way up.
It just went straight up.
In my opinion, a pullback toward the $2,100–$2,150 zone would actually be a good thing. That area lines up with multiple supports, EMAs, previous breakout, and trendline, so it’s strong.
This type of dip could reset the momentum and build a base for the next rally.
Stay tuned and follow for more updates!
#Ethereum #ETHUSD #ETHUSDT
