Ethusdtsell


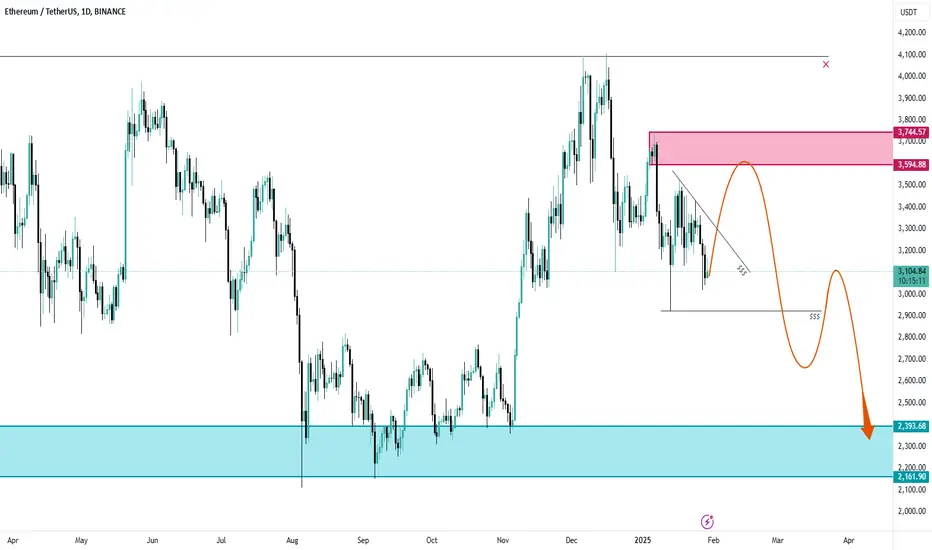
ETHUSDT; Will we see 2400 again ?Hello traders, hope you're doing great.
for upcoming days, I expect an upward correction to 3600- 3750 level and after that a downward movement in this pair, we also have liquidity below 2920 that increases our theory. Remember that today we also have FOMC meeting and can cause volatility in market .
And finally tell me what are your thoughts about ETHUSDT; UP or DOWN ? comment your opinion below this post.
ETHUSDT at weekly support, will that hold?The price has fallen back again to the weekly support 1 zone which screams for a buy but here is a bit of confusion I have when I see the BTC chart. BTCUSDT chart is suggesting that it is going down which means further down move for ETHUSDT towards weekly support 2 zone. Or its the other way round, ETHUSDT is suggesting no further down move and so BTCUSDT shall hold. Kind of conflicting, but pure ETHUSDT chart without considering any other factor suggests a long trade favorable here. But since other factor is involved, the risk shall be minimized by smaller position size and strict stop loss management.

ETHUSDT Bullish Harmonic AB=CD & Bear Flag ETHUSDT instrument behaving bearish with DXY closed bullish. Crypto has high probability of being next week bearish if DXY went up or stuck at next level support. Instrument also shows clear bearish flag and harmonic AB=CD pattern at 1H TF. Trade with 1% of portfolio with two trades hitting TP1 and TP2.

ETHUSDT to head down for hourly support around 2012The price has retraced a bit. However, there is nothing on its way till 2012 and it is likely to retrace till there in this pull back. A short will be favorable from hourly resistance zone and the target should be 2012.

ETHUSDT seems to retrace a bit hereIt seems that the price wants to retrace here a bit. A short seems to be favorable here with a very limited stop loss range.

ETHUSDT headed to daily support around 1811The price is trading under 4h resistance zone. The previous reach of the price to zone was rejected and that was the ideal short entry. I have missed that so I will look to enter around 1866 if price reaches there. The target for this short is the daily support around 1811.

ETHUSDT : Short Trade , 1hETHUSDT sell Entry : 1642.15
Stop : 1688.81 , Target1 : 1591.93 , Target2 : 1548.85
Risk/Reward Ratio : 2

ETHUSDT : Short Trade , 1hETHUSDT sell Entry : 1554.88
Stop : 1612.05 , Target1 : 1498.18 , Target2 : 1440.67
Risk/Reward Ratio : 2

ETHUSDT 4H: Possible SHORT#ETHUSDT The market has the potential for an downtrend after test level 1350$
Sell positions and stop loss should look for on the local market after test

EthereumHello traders. I expect the price to drop to $1,900 in the first phase and $1,350 in the next phase after reaching $3,150. Be profitable.
