ETSY holding multiple supportThe are multiple technicals showing support at the current level.
1. 50sma hasn't been broken since early april. (orange trend-line)
2. has seen reversals at the lower end of the trend (blue line)
3. we are above, and holding the previous resistance from early July (red-dotted-horizontal-line)
4. Drawing a Fibonacci retracement from: All-time-high to 100sma, we are about to touch the 38.2% fibonacci retracement level.
ETSY

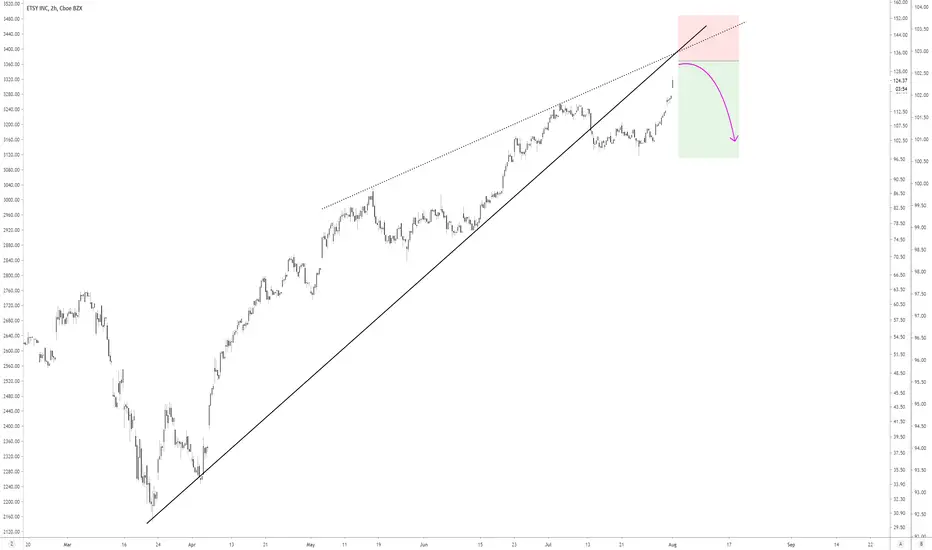
ATTENTION - ETSY with a monthy reversalATTENTION ‼️
ETSY with a huge monthly Reversal Candle.
Etsy is a Top Growth Company and its performance of the last month is insane (roughly 300% from March Low). But it might be time for a correction.
--> Bullish Target Zone at 96 USD
--> Bearish Target Zone at 73 USD
iSqore: 7️⃣0️⃣.55
Profit: B
Growth: A-
Value: C-
Health: B-

Etsy Inc (NASDAQ:ETSY) Explodes On Covid19 Triggered OpportunityThe Market Signal was created as a platform to help investors, if you own (NASDAQ:ETSY) and want to join the fastest growing community of investors on the web then sign up to the link below. Members get free access to the best investment tools in the world. Start trading like a pro today. This is a limited time offer so click the link below NOW.
themarketsignal.com
(Click link above or copy, paste and hit enter in your browser for your report)
Etsy Inc. (NASDAQ: ETSY) shares have been trading higher ever since the stock bottomed, in the aftermath of the COVID-19-triggered market crash in March. The stock is already up by more than 150% in what is turning out to be a break out year, for the online market place for buyers and sellers.
Etsy Outlook
The meteoric rise does not come as a surprise as the pandemic has presented a perfect business opportunity for e-commerce platforms. A change in consumer shopping patterns from brick and mortar stores to online has seen the likes of ETSY enjoy a surge in online traffic, leading to an increase in sales. A better than expected second-quarter report coupled by impressive third-quarter guidance is the latest development strengthening Etsy sentiments in the market.
The stock has already hit a buy zone with pullbacks emerging as buy opportunities from where bulls have come and continued to push the stock higher. As it stands, ETSY is trading in a steep uptrend and looking extremely bullish. The stock remains well supported for further upside action above the $120 level.
Resistance, on the other hand, is seen at $141. A rally followed by a close above the resistance level should pave the way for Etsy to continue powering high. Similarly, a breach of the $121 support level could pave the way for bears to push the stock back to the $100 level, which happens to be the next support level.
About ETSY
Etsy is an e-commerce company that operates online marketplaces for buyers and sellers. The company offers over 66 million items spread across various retail categories. In addition, it offers seller services such as Etsy payments and advertising platform Etsy Ads.
Why is Etsy Rallying - Online Sales Surge
Etsy has taken the market by storm in recent months on investors taking note of a unique business opportunity presented by COVID-19. With the pandemic disrupting the retail landscape, Etsy has seen an influx of traffic into its e-commerce platform as people do their shopping online and have items dropped at their doorstep.
The online store blew second-quarter financial results affirming the perfect business opportunity presented by the pandemic. Q2 profit more than quadrupled to $96.4 million or 75 cents a share against $18 million or 14 cents reported a year earlier. Etsy has a proven track record of earnings growth with a growth rate of 73.6%. EPS is expected to grow by 50% this year, crashing the industry average of -2.3%.
Revenue more than doubled to $429 million from $181 million reported a year ago attributed to an increase in traffic that saw the platform attract more than 18.7 million new buyers.
Double-digit earnings growth attests to a company in a phase of robust growth, backed by solid underlying fundamentals. It also affirms the company’s long term prospects amid a change in consumer shopping patterns to online.
themarketsignal.com
(Click link above or copy, paste and hit enter in your browser for your report)
“Our extremely strong second-quarter results, with consolidated GMS and revenue up 146% and 137% respectively, are a testament to the agility of our team, the strength of our brand, the innovation of our sellers, and the unique and special nature of inventory on our core Etsy marketplace,” said Josh Silverman, Etsy, Inc. Chief Executive Officer.
An impressive second-quarter report affirms the scalability of the Etsy marketplace model. Backed by a highly variable cost structure and disciplined strategy, the company is in for an impressive year when it comes to revenue and earnings growth. This might as well explain the renewed investor interest in the stock as depicted by the stock powering to all-time highs.
Q3 Outlook
Etsy has invested a great deal on its brand and market place, positioning itself to be one of the biggest beneficiaries amid a change from offline to online shopping. With events of the past few months triggering a dramatic shift in consumer shopping habits, Etsy remains bullish about its performance going forward
Likewise, the company expects its third-quarter revenue to increase by between 85% and 115% to between $366 million and $426 million. Adjusted EBITDA margin, on the other hand, is expected at between $111 million and $127 million, representing an increase of between 28% and 32%.
Bottom Line
Etsy is poised for an impressive year going by the developments in the aftermath of COVID-19. A shift in consumer shopping patterns from offline channels to online shopping is a development that continues to fuel the company’s e-commerce craft leading to sales and earnings growth.
The Brooklyn-based firm niche e-commerce platform is growing steadily, having attracted more than 18 million new customers in the second quarter. Better than expected, second-quarter results depicted by revenue and earnings growth explain why the stock has skyrocketed nearly 200%, crushing the likes of Amazon.com, Inc. (NASDAQ: AMZN) and eBay Inc. (NASDAQ: EBAY).
A combination of strong stock performance at the back of favorable technical and improving fundamentals suggests that the stock could continue rallying after the recent spike.
Please email or contact us for any edits or errors relating to this stock market news.
If you would like information on using our press release distribution service aimed at helping investors with the best stocks to buy and how to create your own stock portfolio. We cover the US Stock Market, Canadian Stock Market, the Australian Stock Market and other Stock Market news.

ETSY starts a new wave extension with a pennantETSY finished a wave correction last week and initiated a new wave extension.
It signaled gathering steam with a pennant in wave 1.
Short term target is the previous high around 136. Longer term if markets hold up, we could be looking at 155.45. Our stop's right below the pennant at 127.

ETSY looking bullish on a double pennantETSY had a mini correction after earnings recently. It has started to move up on a double pennant.
Quite unusual to see but as I've drawn and labeled. ETSY formed the first pennant on the 6th and the second on the 7th as a result of market dip.
As a result, I'm expecting a bullish move up which actually started at 2 EST and could continue into Monday, 8/10.

ETSY Strategy: $125 Entry, Long PT at $150Right now, I'm still guessing an overall long position at ETSY, but think it will continue having some more resistance until reaching the $125 price point prior to retesting. That being said, I think by November, this stock can easily reach $150 for a long PT target. The correlations seem to point to positive support levels overtime. As always, please do your own due diligence. Everything I say is on an opinion based basis. Proceed with caution at your own risk.

Etsy Will Soon Be A Good Shorting OpportunityEtsy has been in a very nice rising wedge from the March lows. As it reaches the top range of this wedge, it should be a good shorting opportunity. I expect it to fall from its wedge. The eventual target is the origin of the lower channel, or about $30.
We also have good bearish divergence on the RSI, on the daily:

ETSY - 9.95% Potential Profit - Ascending TriangleClear uptrend corridor with Support and Resistance confirmed multiple times over the past 4 months.
Ascending Triangle formed.
Short term swing trade that I would close before earnings on 5th August.
- Historical uptrend
- RSI + Stoch well above 50
- MACD above Signal.
Suggested Entry $117.68
Suggested Stop Loss $114.47
Target price $130

ETSY $96 short on backrest rejection of broken support line Seems like a good play, respecting that trend line perfectly so far.
THE WEEK AHEAD: BYND, ROKU, SQ, ETSY, UBER EARNINGS; GDXJ, SLVEARNINGS:
There's a bunch, but here are the ones that interest me most for volatility contraction plays:
BYND (46/87/17.2%)*, announcing Tuesday after market close.
ROKU (40/84/16.6%), announcing Wednesday after market close.
SQ (40/74/13.4%), announcing Wednesday after market close.
ETSY (38/74/14.8%), announcing Wednesday after market close.
UBER (15/73/11.9%), announcing Thursday after market close.
Pictured here is a directionally neutral iron condor in BYND in the September cycle with the shorts camped out at the 21 delta strikes. A 3.26 credit as of Friday's close, it's paying nearly one-third the width of the wings. Naturally, you can go with the August monthly, but this is one that's known to be a mover, so I'd opt to go longer duration for more room to be wrong. For those who prefer naked: the September 18th 106/165 was paying 8.55 at the mid price as of Friday's close, with the August 21st 105/160 (18 delta) paying 5.45.
EXCHANGE-TRADED FUNDS WITH 30-DAY >35%, ORDERED BY RANK, AND SHOWING SEPTEMBER SHORT STRADDLE PRICE AS A PERCENTAGE OF STOCK PRICE:
SLV (46/58/15.0%)
XLE (26/40/11.5%)
GDXJ (22/57/16.0%)
GDX (22/46/13.0%)
EWZ (20/46/12.4%)
XOP (13/53/14.6%)
From a buck banging perspective, it's GDXJ (16.0%), followed by SLV (15.0%), and XOP (14.6%) for premium selling. I've already got GDXJ and SLV plays on, so may consider something in XOP if I'm desperate to add to my theta pile.
BROAD MARKET:
IWM (29/34/9.1%)
QQQ (22/27/7.5%
EFA (21/23/6.0%)
SPY (19/23/6.2%)
The volatility was nice ... while it lasted. I may switch over to IWM put selling in the IRA in lieu of SPY given that RUT is where the volatility is at relative to the others. The 16 delta strike nearest 45 days until expiry would be the September 18th 130, paying 2.05.
IRA DIVIDEND-GENERATORS:
XLU (23/20/5.6%) (3.19% yield)
IYR (22/28/7.2%) (3.27% yield)
EWA (22/30/8.4%) (3.72% yield)
EWZ (20/46/12.4%) (3.17% yield)
SPY (19/23/6.2%) (1.75% yield)
TLT (17/17/4.3%) (1.64% yield)
HYG (15/15/3.0%) (5.00% yield)
EMB (11/11/2.9%) (4.22% yield)
EWZ (12.4%), followed by EWA (8.4%), then IYR (7.2%). Getting kind of tired of laddering out EWZ, but you go where the volatility's at.
* -- For earnings, the August 21st at the money short straddle is used for determining the short straddle/stock price percentage; for everything else, I'm using September.

$ETSY Ascending Triangle - Near Term Breakout Candidate$ETSY Ascending Triangle - Near Term Breakout Candidate
Strong close today above resistance. Expecting follow through move tomorrow.
Near term target - $100-$105 range
Note: Not investment advice.


Short Target for Etsy at $70First off, please don't take anything I say seriously. As always, this is on opinion basis, and not financial advice. That being said, let me get into a few key points I want to make. Right now Etsy seems bullish and many analyst are giving it buy and hold ratings. I believe for a quick profit turn over with mitigated risk for day traders, a $70 short target should be quite reasonable as your next move.

Shopify and ETSY: Covid and Earnings CallFirst off, please don't take anything I say seriously as this is opinion basis. That being said, let us get into my insight. I believe due to the Coronavirus, likely online shopping and e-commerce have seen a spike in activity. This is due to people shopping online more. Not just e-commerce went up, but so did remote collaboration and other sectors as well. Looking at both Shopify and Etsy, the earnings calls for both companies seem quite soon, and even though Shopify went up tremendously, I think a $650+ target could still be reasonable. In terms of long gain potential though, I think Etsy may take the cake at a really lower cost stock, but only time will tell. It is still to early to call that. Both stocks are medium to high risk, and a lot depends on the earning calls. I think though it may be worth the bet, but there are other assets that have higher gain potentials as well (with lesser risk). As I said in 2018, Shopify still seems like a gold mine and is an example of one of those startup success stories or the American dream (well actually Canadian dream). Also keep in mind, in 2015, Shopify's IPO offering price was $17 and the early trade price was $28, meaning in 5 years you could have seen a 23 to 38 times profit for your investment.

Break above $62.6 and back tested, possible break out furtherBreak above $62.6 last week after 2 inside daily candles. and back tested level, possible break out further to all time highs $73. Online companies have been on fire, like SHOP and Wayfair. Earnings May 6, but this has run quite a bit. May options interest $70 calls with 1295, June $65 calls with over 6000 OI and $75 calls over 2200 OI. There isnt a chart pattern, maybe a small cup and handle. Good Luck!


ETSY Short ETSY at beginning of downtrend. Distribution up top and currently pushing up against channel, looking to make a large move down. There is a good size unfilled gap from previous bull channel. Targeting bottom of gap with weak resistance to this point. Peace out playas.

ETSY - Current Long position, and Potential Gap TradeThe stock ETSY has hit the 50% Fibonacci resistance line and bounced off of it. The Fib line represents a trend that had been in place from February 2017, around $9 price, until the high of $73 in February 2019. This resistance line is very strong, and can represent reversals along with other indicators.
Currently we see on the 1D, 4H, and 1H charts, that the 5d MA has crossed over the 8d MA, potentially signalling bullish movement. I have opened a trade at $43.80, with a short to previous resistance of upward movement (about $42.80). I have a 50% sell at $46, and the other 50% will be aiming for the Gap Trade that could be in play. The downward movement on October 31 represented a $8 drop in price, which often eventually finds it's way back to the starting price, before resuming previous trend. IF the $46 trade hits it's mark, I will set the Sell at $52, and will be moving up my stop loss to $43.80.
Depending on how the MA plays out, I will keep this trade open to continue trade #2.

ETSY - LONG SETUPSHOWING EXHAUSTION ON RSI. GAP FILL AROUND 52 ish. DOUBLE BOTTOM ON HISTORICAL SUPPORT LEVELS ? PRETTY LOW RISK ENTRY HERE.
