EUR/USD Continuation at 61.8/ LH? 14:36:30 (UTC) Mon Sep 28Looking to take the Euro short this week, with textbook market structure aswell as confluences combined with the DXY (U.S. dollar) which looks to be forming support to take it thus further breaking resistance at 94.5 to a weekly upside of 95.5
EU

EURUSD Price movement prediction 28-09-2020Using the triple trap strategy, these are possible setups of this pair EU has been in down trend ( we can see it making lower lows nd highs). On Friday it broke the previous support, which tells the EU may drop, currently waiting for the retest to the zone and if we draw Fibonacci, we can see the previous support aligns with the 61.8 zone. this shows that it is a high probability setup for sell.
the triple trap strategy is trapping price between a channel, SNR and a possible trendline opposite to channel. In this way we can predict the next movement of the price by seeing the price respecting either one of the traps( a channel, SNR and a possible trendline).


euro upside 1.16950I had a short idea that I posted a few hours ago, that is still in consideration however from what price action is presenting I am looking for upside targets of 1.16950

EURUSD Price movement prediction 24-09-2020trend continuation in EU, broke the previous support and became resistance and at the lvl bearish candlestick pattern so gone for sell once again


POSSIBLE GU BUY THEN SELLWill be watching these levels for ideally buys first and then sells, if time allows. ( 8:30 AM - 11:00 AM ) (Est.)

POSSIBLE EJ BUY THEN SELLWill be watching these levels for ideally buys first and then sells, if time allows. ( 8:30 AM - 11:00 AM ) (Est.)

POSSIBLE EU BUYSWill be watching these levels for buys, if time allows. ( 8:30 AM - 11:00 AM ) (Est.)

Bear Down Chicago Bears . XAU EU SP BTCGo Bears! I might be gambling I might have a problem.
This MONTH! I'm picking Gold, Euro, SP, and BTC to stink it up hard, stink it up fast out the gate, maybe show signs of life 2 weeks in but done and out by 4.
One month, hard dump. Short, take a nap near family. Like a bear.
I don't know what odds are. I don't know what numbers mean. All i know is upsie downsie get wrong get short.
OANDA:XAUUSD
OANDA:EURUSD
OANDA:SPX500USD
OANDA:BTCUSD

Bullish Butterfly PatternThe Butterfly Pattern on the 1H time frame adds confluence to the deeper retest of the entry on the 4H Gartley.
Entry: - 1.17854
Stop: - 1.17541
TP1: - 1.18293
TP2: - 1.18565
To view a basic Tutorial on how to identify this pattern click the chart below ...

Bullish Gartley PatternPrice has already made a reaction to the initial test of the entry.
I would expect a deeper retest of the entry before the main upward move commences.
Entry: - 1.17882
Stop: - 1.17529
TP1: - 1.18377
TP2: - 1.18682
To view a basic tutorial on how to identify this pattern click the chart below ...


EU . Nothing To See Here . I'm Short but EU might be Long. I keep hearing the word Kangaroo.
1.14
OANDA:EURUSD
disclaimer, i may or may not be in this trade when you see it. i may or may or may not have been shakin out for 2 pips. But I'm still bearish stalking shorts til otherwise posted.
Side note, Go watch the show AP Bio on PeacockTV. I can't help wondering which kid is the WeBull'r and which one just trades FOREX.
Trading Triangles: Part TwoAt Target One of the Daily Triangle 50% of the position is closed.
It would then be logical to assume Price would drop by 50% of the move from Entry.
Price did not drop by 50% and instead began to form a new Triangle pattern.
Dropping to a lower time frame (4H) we can see the process begin to repeat itself.
Targets One and Two for the 4H Triangle are shown below.

Trading Triangles: Part OneTriangles occur during periods of consolidation.
They represent indecision in the market as to whether the overall trend will reverse or continue.
The direction is confirmed by a candle close above or below the boundaries of the triangle.


EURUSD Long IdeaEU Looks to be approaching this area of liquidty (Support Zone). We are looking for it breaking this area to grab liquidty and hit this money block (Sniper zone).

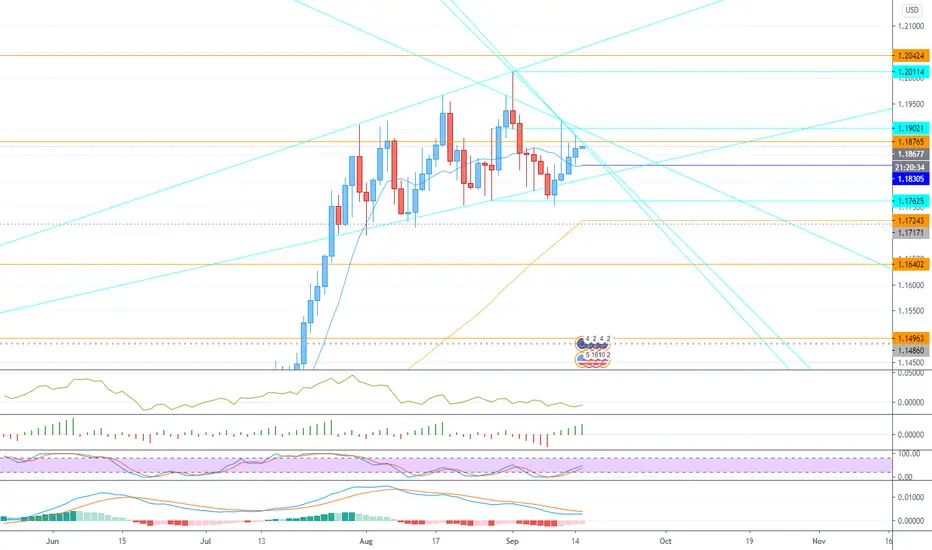
EURUSD LONG TERM BUY DAILY TF! Light Blue line is my 1st target and baby if it breaks that we gonna be popping bottles with all kinds of bitches!! xD

EURUSD Short ScenarioAfter a nice bullish rejection from outside of the flat movement we can jump on a bearish train!
SHORT:
1- USA session close BELOW 50% MARGIN ZONE
2- Enter with any englufing Pattern
LONG:
1- USA session close ABOVE 50% MARGIN ZONE
2- Enter on Retest

