EURUSD SHORT!! EYES ON DATA!What we see on the EU is quite clear,
So we expect price to have bearish move in higher time-frame, in lower time frame we can collect some orders just above then we start out bearish move,
I do not believe we break 1.08464,
This week is challenging week for EU as we have different data coming in euro-zone,
SO you have to be careful of the data and you have to study them properly then imply them on the chart,
For now we are above important demand zone we expect to collect more liquidity from above to have a strong bearish move,
Personally waiting for London Session to open then decide and see how it goes,
Any question comment me bellow!
@FxShzd team
EU

EURUSD - Monday BiasOANDA:EURUSD
My Bias for EU on Monday is bullish.
I expect to see a break of structure to the upside and a retracement which is where I will enter from.
This is based on how the Friday candle closed.
The candle suggested that price want to give a bullish retracement on lower time frames which means Monday or Tuesday price might be bullish even though the short term trend on daily is bearish.

EU - Weekly Timeframe Analysis (ICT)Price displaced up, to and through the NWOG, stopping almost exactly the top on the weekly timeframe before getting rejected almost just as quickly as it got there.
The previous week traded into a weekly FVG above, and in IOFED fashion it displaced back down to a weekly iFVG.
Currently, price is at equilibrium and could go either way from here. I will be waiting to see if price trades through the iFVG below, or back higher to use the previous FVG as possible support. Only time will tell.

EU - Monthly Timeframe Analysis (ICT)Last month we saw a sharp rejection after taking out a monthly high and monthly open. Currently no body has closed below the monthly FVG/Sibi.
I would be interested to see if price is drawn to take out the previous month's low, and if so, how does it react afterwards. If it takes out the second monthly lows, then the monthly FVG/Sibi would be a nice objective.
Price seems to be delivered efficiently at the monthly -OB, so I would be curious to see if price will be drawn back up there for a higher target.
Overall, no solid bias on my side.

EURUSD Analysis - Potential LongThis is a potential long setup on EURUSD.
I do believe we are gonna start seeking higher prices either CPI today, or PPI tomorrow.
The only other alternative is a drive lower to hunt for liquidity, push the bearish sentiment to the masses, and then crawl back up whilst taking out anyone looking for an opportunity to get in short. Both are valid ideas. Only thing I am confident about is that we will be heading up sooner or later, and this isn't the end of the road.
This setup is based on price not breaking the current low. I used GBPUSD as confluence. The POI is an Orderblock on multiple timeframes. That is the only clear area I can see for a possible retracement, faking a bearish move and heading higher very... VERY... rapidly. Time and price will offer more clues.
Best bet is wait for the high impact news to show the true colours of the market, then get in from there. Other than that, it would be a gamble.
R2F

Looking to take intraday longs on $EU after sweep of news candleFirst we see a big sweep and rejection, then we see demand chain and orderflow established on 15/5m so we are looking for confirmations on LTF once price taps that 1h/15m demand zone
keep in mind that we are still bearish overall and we still expecting lower prices, that's why we targeting HTF high to sweep it, bcs we may see a pullback after that
15m

EURUSD Analysis - Long SetupPossible long setup on EU.
The overall higher timeframe bias is not confirmed in my eye yet, but there may be a potential long intraday form within the current expansion range.
CPI and PPI at the end of the week, so be prepared for funky stuff.
R2F

EUR/USD - Long SetupI believe EU can make some higher prices after a retracement. There is much imbalance above.
On the HTF I think we could see lower prices, but will see how this play goes.

EURUSD - Nice moves during BOJOANDA:EURUSD
BOJ sure rocked USDJPY for a bit, BUT the EU holding course...

EU Weekly Analysis - ObservationEU had a big move last week during CPI and PPI. We are now in the New Week Opening Gap territory. There is no immediate setup on this timeframe, so it is better to wait for more confirmation. Let chasers get chopped out while we stay still.
- R2F

EURUSD - Anther private school short entryThe current trade setup for EUR/USD shows a bullish overall trend, while the short-term trend is bearish. Traders with a swing trading strategy might consider seeking long-term buying opportunities. It is crucial to emphasize the importance of employing effective risk management techniques throughout the trading process.
Happy trading!

EUR/USD Analysis - Go Long, Johnny!This is my outlook for EUR/USD.
I'm anticipating Tuesday or Wednesday to make the low of the week, but it is not an issue if it does. Those 2 projections are where I expect price to retrace to before moving higher to finally make new highs.
- R2F

Looking to buy after sweep of orders + nice reaction to demandas we can see; price swept alot of lows on 15m and tapped nicely on that wick demand, and impulsed back up, which is what we all like to see
it also formed a demand chain on 1h after sweep of the low, so we have good confluences now to take a buy with confidence following the bullish orderflow and intent of price
will update if we get into a trade or not
1h
15m
5m

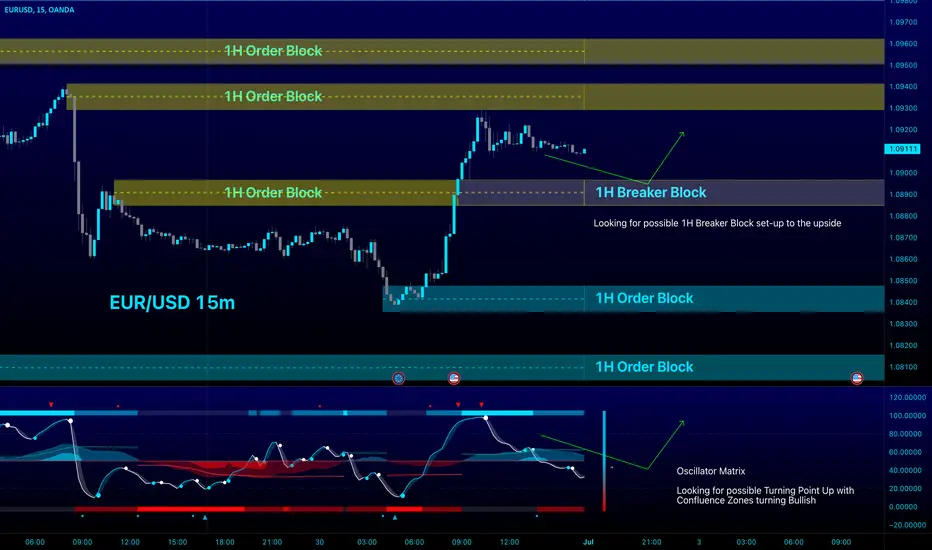
EUR/USD Setting Up?OANDA:EURUSD
Looks like a prime 1H Breaker Block set-up on the 15m time frame
We shall see how this plays out...
EU BUY FOR THE WEEKEURUSD Top to Bottom Analysis.
Started from a Weekly TF down to 30min TF.
Projecting a buy for the week.

The Quiet before the Storm 🪁 : Eurusd With the close of the Daily candle in the next 1.5 Hours, Longs would prefer a candle closure above 1.0782. This would confirm another Higher High in market structure. In an uptrend price creates Higher Highs and Higher Lows. If this occurs then we can anticipate a bottom wick ( Higher Low) and then a consequential new bullish candle push to the upside back towards 1.0813 daily resistance zone. At this current time price is Bullish on the weekly timeframe and has broken the previously week's candles high. The Daily timeframe will print the second bullish candle of the week which was expected in my previous analysis. FOMC tomorrow will cause quite the stir. FOMC could cause Eurusd to easily dip back to retest 1.0746 Daily support level before continuing it's ascent or going into a volatile range. Price has reached my bullish target for the week which was 1.0813 ( a 65 pip increase ). CPI data has resulted in Higher High on the 1Hr timeframe. Price ended up pulling back and correcting the increase made during London session. We currently sit above our Daily S/R level 1.0782, late NY session Tuesday.
New Bullish target for this week with fomc : 1.087 Daily resistance zone
The way CPI data distributed at 1.0813 makes me think. We reached my weekly target 1.0813 before schedule. We had an initial increase in price and I'm sure some players bought the high and are now holding drawdown as we move into FOMC tomorrow. If I was a buyer I would consider getting out for B.E. because the Daily candle is closing in 1.5 hours with a significant top wick. Larger than the body of the bullish candle at least.
New Bearish target for this week with fomc : 1.06915

The Eagle eyes a ( Risk on ) Inflation report 🦅The market is going up for asian session and I'm anticipating a correction of this price action during lodnon session. With USD CPI data during New york session it is possible price could just fly to the next daily resistance zone 1.0813. This will likely occur if the 4.1% forecasted inflation rate isn't met and inflation decreases at a slower rate than what is expected. I think this to be the more likely scenario because a .8% decrease in inflation seems like a bit much to me. I'm not anticipating that EURUSD will take it's lovely time increasing.
It will be abrupt and cutthroat as the market blows through Investors's ***** ... Okay I will stop there because I don't want to make things to explicit. That's whats happening when price fluctuates 50 pips in the blink of an eye anyways. It's not what you want to hear but it's the truth. The unprepared will be taken to the slaughterhouse. I will implement my trading system as it allots. Risk management / Position sizing and capital preservation are especially significant during times like this. CPI data releases have acquired an important role in the last 2 years due consistently high inflation.
If Eurusd continues it's downtrend on Higher timeframes and last week's bull candle was just a dead cat's bounce, then we may anticipate that price will spike at or above 1.0782 Daily resistance level or even go touch 1.0813 Daily resistance level before returning to the downside as the current daily candle closes back underneath 1.0782 Daily level and goes back down prior to FOMC interest rate news on Wednesday.
Price has estalbished a new Daily support level at 1.0746

EURUSD Potential Forecast | 5th June 2023 Fundamental Backdrop
ISM Services PMI forecast at 52.6 with 51.9 previous.
EUR Services PMI along with ECB Lagarde speaking may induce volatility in the market.
Hawkish tone will result in bullish momentum in EURUSD, vice versa.
Technical Confluences
Resistance level at 1.0765 where price has rejected.
Support level at 1.0533 which could be a potential target.
Price is currently on a downtrend and we will be looking for shorts.
Idea
Will wait for retracement before entering onto shorts.
NOT FINANCIAL ADVICE DISCLAIMER
The trading related ideas posted by OlympusLabs are for educational and informational purposes only and should not be considered as financial advice. Trading in financial markets involves a high degree of risk, and individuals should carefully consider their investment objectives, financial situation, and risk tolerance before making any trading decisions based on our ideas.
We are not a licensed financial advisor or professional, and the information we are providing is based on our personal experience and research. We make no guarantees or promises regarding the accuracy, completeness, or reliability of the information provided, and users should do their own research and analysis before making any trades.
Users should be aware that trading involves significant risk, and there is no guarantee of profit. Any trading strategy may result in losses, and individuals should be prepared to accept those risks.
OlympusLabs and its affiliates are not responsible for any losses or damages that may result from the use of our trading related ideas or the information provided on our platform. Users should seek the advice of a licensed financial advisor or professional if they have any doubts or concerns about their investment strategies.

USOIL Medium Term UpdateI promised in the previous post that I would discuss medium-term charts.
I've been calling for an abrupt rise in ABC flat for a while now. However, price movements develop much more slowly than the human brain expects. I believe I read about this bias in books by R. Prechter on the fundamentals of Elliott Wave analysis.
This time, there is another layer of uncertainty because Brent did not follow WTI in the flash crash on May 4, which marked the local bottom (wave B low) for WTI but not for Brent.
While my expectation of the impending impulse wave C matches the WTI chart perfectly, it is not the same for Brent, where I anticipate an ending diagonal to complete the correction.
This weekend is the much-awaited OPEC+ meeting. However, as I mentioned in my previous post, I suspect limited progress in production-cut talks or a tepid market reaction to any agreed cuts. OPEC core members are grumbling about the cuts as Russia's seaborne exports hit all-time highs to markets that OPEC countries consider their fiefdom, forcing them to redirect volumes to the EU, missing out on shipping.
Therefore I doubt OPEC+ can come up with a decision that will drive oil prices sharply higher in June-July and keep them elevated by the end of the summer. OPEC+ decisions usually lag the market developments and tend to cause short-lived fluctuations at best (though painful when unexpected).
Instead, war drums and EU discussions about the 11th sanctions package could be the catalysts. The EU is considering prohibiting EU entities from purchasing refined products made of Russian oil. Read - India can no longer buy cheap Russian crude to produce diesel and ship to the EU.
I have some ideas about what it could mean for energy markets in the long run, which I will elaborate on in a website article.

Does "News" Impact Price Behavior? 🐒We can Observe that After the 1st Quarter of the Year, January-March the price of Eurusd has increased. Now As we near the middle of the second quarter, I can't help but visualize a Breakout.
Price is currently sitting at 1.102. So far price has respected the Weekly Level at 1.106. The High for the first quarter was 1.103. We have now spent quite a bit of time at these extreme prices. I can often observe price using News//Data Releases on Lower time frames as a boost. A Boost of momentum in the preceding direction.
I can observe 3 Potential News//Data Releases causing and becoming a Catalyst to leave a Large Trading Range.
1. NFP
2. CPI
3. FOMC Interest Rates.
Will FOMC provide the Volume?
Do we have enough Liquidity?
Or may price dip from here back to our 1.086 Weekly S/R Zone before increasing any further?
My Bias is Bullish moving into FOMC. Safe Trading Everyone.
Not Financial Advice. Educational Purposes Only.

EURUSD Is this the End? 🥶 [ 1 Month Long Range ]Is it over EURUSD !! Don't leave the Range! Not yettt 😢. 1 Month of ranging on the Daily timeframe. A Swing traders Dream. A Scalper's Dream. We'll See if Price retreats to 1.086 Weekly S/R Zone as plotted out as a potential scenario before FOMC Data last Week.

EURUSD 4HR Bearish ProjectionThe current analysis of EURUSD indicates a downward trend. Yesterday, it broke a significant support level and closed below it. While a temporary reversal may occur before the bearish movement continues, it's important to note that the DXY (US Dollar Index) has surpassed a major resistance level. This development suggests that EURUSD is likely to decline further towards the 1.05553 price zone, which represents the next significant support level in the coming weeks.
It's crucial to remain aware that market conditions can shift unexpectedly. If the price manages to surpass the extended trendline and break above it, my bias would change. However, as of now, I maintain a bearish outlook on EURUSD.
What's your thought on this? Kindly comment below

Shaking it up 💵 Can you close Below 1.08392? EurusdIt took a Few Days before Price was able to punch out a new Low after Printing an Engulfing Candle on the weekly timeframe last week.
The candle engulfed almost 5 weeks of previous gains by Bulls. Price corrected to the S/R Zone 1.0866 and pulled back from our Quarterly Highs around 1.103- 1.108.
The Next Weekly Level sits a 1.06650 which currently sits 170 Pips away. We do have unemployment data during the second to last NY session of the week tomorrow.
We'll see how the American workforce is doing. This news release can be a catalyst for a continuation in trend to the downside. Our Last Daily Support Level that I can see being tricky will be 1.08392. If the Daily Candle can close a solid candle below there, we can expect more downside to come. Maybe it can also act as a good Break and retest level for Short Entries. But first we must observe the Daily Close. One guy has a swing entry from 1.086 and another guy has a swing from 1.082. Both Short Entries. Both are Good traders. All of the gossip and panic about institutions dumping the Dollar. You would've missed this 200-250 Pip Short trade from the Highs that coincided with hawkish FOMC data. Thinking there may be more to come.
We have creased below all our Daily Level's
-1.08607 Daily Level created on Monday
-1.0853 Daily Level created on April 11th
-1.08392 Daily Level created on April 3rd
The next Daily Level sits at 1.07592.
A good technical indicator for the Daily candle is it closing with a larger body then a bottom wick. We would like to see bears protect 1.08392
What is concerning is that we may have alot of shorts piling in now. Are they Late? We will see.
The market is not going to feed everyone so we may see a hard pullback up to 1.08742 Daily Level once again
Unemployment Claims has been climbing since February 7th of this year. It is expected to be a small improvement over the last period.
If the Daily Candle can pull back up and close above 1.08607 Daily Level that was created on Monday, Definitely Buys on EU here, good RR back to Top of our Daily Range , first back to 1.089 4Hr level
We would want the bears to Ideally respect the Break and retest Level 1.08462 on the 4Hr timeframe. The 4hr Is about to close and is closing below 1.08462, good for bears
