EURAUD (4H) LONGEUR/AUD is heading to a fundamental support area.
Support Range: Around 1.5967 - 1.60032
Potential Long Entry
Entry Price: As close to or in support range
Take Profit (TP) target:
TP 1: 1.60990 (immediate)
TP 2: 1.61162 (strong)
TP 3: Price hit trendline (Final)
Cut Loss:
When Support Range fails to hold.
Eur-aud


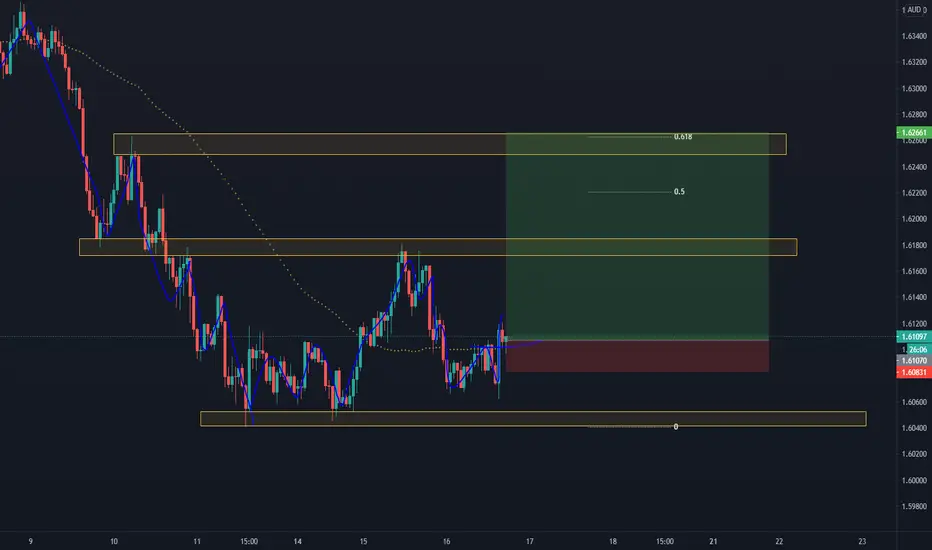
EURAUD looking up 🦐EURAUD after testing the weekly resistance structure at 1.60750 couldn't break below.
The price attempts a break and then starts a new leg up with a break and retest of the structure at 1.61500.
IF the market will break above the resistance area we will set a nice long order according to Plancton's strategy.
–––––
Follow the Shrimp 🦐
Keep in mind.
🟣 Purple structure -> Monthly structure.
🔴 Red structure -> Weekly structure.
🔵 Blue structure -> Daily structure.
🟡 Yellow structure -> 4h structure.
⚫️ Black structure -> <4h structure.
Here is the Plancton0618 technical analysis , please comment below if you have any question.
The ENTRY in the market will be taken only if the condition of the Plancton0618 strategy will trigger.


EURAUD HomerunPrice is in a support zone. Price dipped down to this zone 4 or more time since '19. Furthermore, price bounced up 9 times to the 1.65537 threshold within that same time. Long term hold. Using small lot size.

EURAUD - false break out Far level retest.
The price is returned for the retest level the previous touch of the level more than 1 month ago. Moreover, a strict number of false breakdowns.
local vision:
Push like if you think this is a useful idea!
Before to trade my ideas make your own analysis.
Write your comments and questions here!
Thanks for your support!

EURAUD: Bearish Accumulation
EURAUD is trading within a descending triangle formation on 4H.
With a sequence of lower highs and equal lows, the pair is preparing for an important breakout attempt.
1.6045 - 1.6065 is strong horizontal support.
In case of a bearish breakout of that (4H candle close below), chances will be high that new selling wave will start.
Goals will be:
1.60
1.5975

Triangle I EURAUDWe are in a downtrend at EURAUD. At the same time, the price fails to make lower bottoms and peaks, but closes in a triangle.
This allows us to look for an entry here after a break!
Support levels:
1.6014
1.5980
1.5925
The scenario fails down when the previous peak breaks.
If you have questions about how to trade this or another situation, contact us!
To support us, like and comment! comments!

EURAUDTF: 15 Min
Looks like something to keep an eye on. Price looks like it may want to continue up here. Price looks like it is holding at this zone. I am looking for a bullish candle for confirmation

EUR/AUD Short Setup | DovyFXFinally EUR pushed back up to retest this zone. I have been waiting for this for 3 days... I will wait for price to close below the blue line to go short on this setup. Cheers!
DovyFX

EURAUD shorts EURAUD SHORTS
FIB GIVES us a road map if we see this stop at any level before our 78.6 we could see this pair fall to the levels below


EURAUD - PREDICTIONI'm actually bearish for the first time in 2 months on this pair now we've broken the weekly support.
Looking for the retest and continuation of the channel structure.

Euraud...Looking for some pullback to short...Waiting to short this onto the downside.Right now not the time yet...
If you like my analysis and it helped you ,do give me a thumbs ups on tradingview! 🙏
And if you would like to show further support for me, you can gift me some coins on tradingview! 😁
Thank you!
Disclaimers:
The analysis shared through this channel are purely for educational and entertainment purposes only. They are by no means professional advice for individual/s to enter trades for investment or trading purposes.
The author/producer of these content shall not and will not be responsible for any form of financial/physical/assets losses incurred from trades executed from the derived conclusion of the individual from these content shared.
Thank you, and please do your due diligence before any putting on any trades!

EUR/AUD Short SetupWith 4h closure below strong resistance I would like the price to come back to test the level and with a nice indication of resistance I can see EUR/AUD dropping lower.

EURAUD - SWING - 07. DECE. 2020Welcome to our weekly trade setup ( EURAUD )!
-
1 HOUR
Strong bullish reaction towards main sr level.
4 HOUR
Overall bearish market structure about to drop!
DAILY
Great short entries, prices too high imo.
-
FOREX SWING
SELL EURAUD
ENTRY LEVEL @ 1.63170
SL @ 1.64070
TP @ 1.61920
Max Risk. 0.5% - 1%!
(Remember to add a few pips to all levels - different Brokers!)
Leave us a comment or like to keep our content for free and alive.
Have a great week everyone!
ALAN

EUR/AUD Long - Target pattern highs- Daily - Slight descending channel with a double bottom at the 3rd touch of the pattern. Leading up to the double bottom there was another descending channel which price impulsed out of and in the next flag correction, I was looking for buys.
- 4hr - After the impulse out of the descending structure, a bull flag formed with a double bottom that I was looking for signals for an entry.
- 1hr - As price approached the double bottom within the flag, price formed another descending channel and I set my order on the break of the pattern.

EURAUD - PREDICTIONDon't be put off by all the charting, let me break it down.
Firstly what can we see?
The blue line is a weekly trend line dating back years which as you can see, isn't breaking.
This is followed up by the daily support in grey.
In red, we have a Bullish Flag pattern. Buys on the break of the high of the flag is favoured with clean traffic.
Alternatively, we could see the usual correction to 61.8% fib as highlighted before another push.
3rd scenario is we retest that bottom support but unlikely.


EURAUD trend reversalThis week we saw an exceptional strength of the euro and it is the strongest against the USD.
This leads to a break of the downward trend in EURAUD and an expected reversal.
We already have a test and a repulse, so we can look for the next rise.
The first target will be 1.6478, followed by 1.6539.
There are 180 pips to the second goal, and the price should not return below the previous bottom.
If you liked this situation, like the analysis and share in the comments!

